
The 3-2-1 crack spread explained: refining margin in one formula

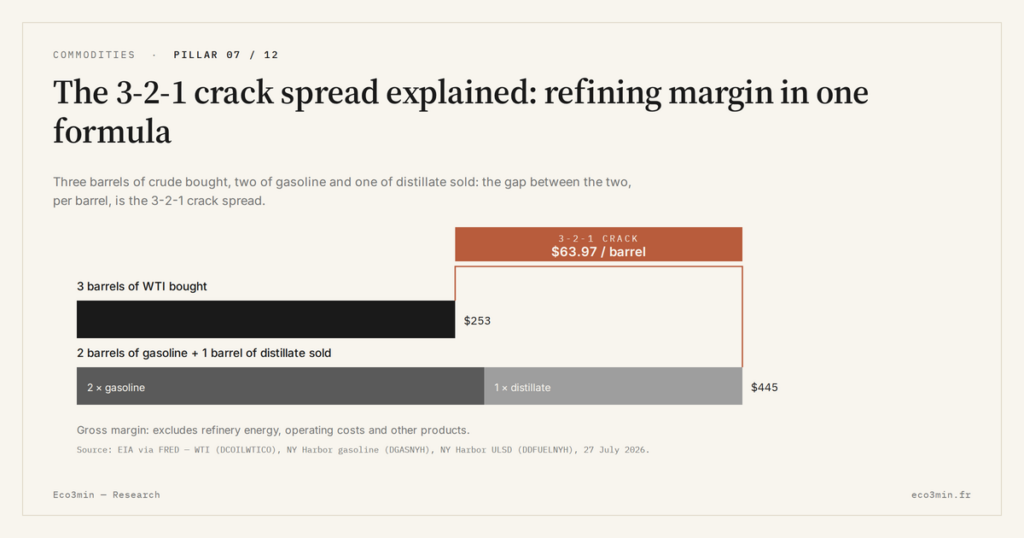
A refinery is, in the crudest terms, a spread trade: it buys crude oil, transforms it, and sells refined products. The gap between what it pays for the barrel and what it collects for the fuels is its gross margin. The oil market has a shorthand for that gap, quoted every trading day and watched by refiners, traders and analysts alike: the 3-2-1 crack spread. The number sounds technical. The idea behind it is simple, and once the convention is clear the whole economics of refining reads differently.
This page is the companion to the US 3-2-1 crack spread dataset, which keeps the daily series and the downloads. Here we do the definitional work: what the crack measures, the exact formula, why the ratio is 3-2-1 and not something else, and, just as important, what the crack is not.
In short
The 3-2-1 crack spread turns a refinery’s gross economics into one number, using a fixed recipe of three barrels of crude yielding two of gasoline and one of distillate.
- The formula is (2 × gasoline + distillate) × 14 minus WTI, with product prices in dollars per gallon and crude in dollars per barrel; on 6 July 2026 it worked out to $59.45 per barrel.
- The 3:2:1 ratio approximates the light-product yield of a typical US refinery, which is why it became the market’s default proxy rather than a single-product spread.
- It is a gross margin, not a profit: it ignores refinery energy, operating costs and every product outside gasoline and distillate. Over 1986–2026 it averaged roughly $12 per barrel.
The crack spread exists because a refinery does not sell what it buys. It buys crude, a single input priced as one barrel, and it sells a slate of finished products priced separately, mostly gasoline and diesel. To read a refiner’s fortunes you cannot look at the oil price alone, nor at the fuel price alone: you need the distance between them. The crack spread is that distance, standardised into a recipe so the whole market quotes the same number.
What the 3-2-1 crack measures
Take three barrels of crude oil. Run them through a refinery and, in a simplified accounting, you get roughly two barrels of gasoline and one barrel of distillate (diesel and heating oil belong to the same distillate family). Sell those three product barrels, subtract what the three crude barrels cost, divide by three, and you have the gross margin per barrel of crude processed. That single figure, expressed in dollars per barrel, is the 3-2-1 crack spread.
The word crack comes from the refining process itself, where heavy hydrocarbon molecules are cracked into lighter, more valuable ones. The spread names the value the market attaches to that transformation on any given day. When products are scarce relative to crude, the crack widens and refining is lucrative; when products are abundant or demand falls, it compresses toward zero, and running a refinery earns little on each barrel.
The formula, and why 3-2-1
The mechanical version is short. US gasoline and distillate are quoted in dollars per gallon; crude (WTI) is quoted in dollars per barrel; a barrel holds 42 gallons. To put everything on a per-barrel-of-crude basis you weight the products by the recipe (2 gasoline, 1 distillate), convert gallons to barrels, and subtract the crude:
THE 3-2-1 CRACK, WORKED ON REAL DATA (6 JULY 2026)
| Gasoline spot | $3.006 / gal |
|---|---|
| Distillate spot | $3.206 / gal |
| WTI crude | $69.60 / bbl |
| (2 × 3.006 + 3.206) × 14 | $129.05 / bbl |
| 3-2-1 crack (minus WTI) | $59.45 / bbl |
The factor 14 is simply 42 gallons divided by the 3 crude barrels. Source: Eco3min US 3-2-1 crack spread series (WTI, RBOB gasoline, ULSD distillate).
So why 3-2-1 rather than 1-1-1 or 5-3-2? Because the ratio is meant to mirror the physical reality of a refinery, not to be arithmetically tidy. A typical US refinery configured for road fuels converts a barrel of crude into more gasoline than distillate, in a proportion close to two-to-one across its light-product output. The 3-2-1 recipe encodes that yield: two units of gasoline and one of distillate for every three of crude. It is an approximation, deliberately, because it has to describe an entire industry with one number rather than any single plant.
Other ratios exist for other refinery configurations. A plant geared toward diesel might be better described by a 5-3-2 crack (five crude, three gasoline, two distillate), and analysts sometimes use single-product cracks (the gasoline crack alone, the heating-oil crack alone) to isolate one fuel. The 3-2-1 became the market default precisely because its blend matches the average US refinery closely enough to serve as a shared benchmark. Computed across a fleet that has itself changed shape, that average plant is a moving object: seventy-five fewer US refineries than in 1990, on more operable capacity than the country held then, an outcome that runs through every US refinery shutdown recorded since 1990.
What the crack is not
The single most common misreading is to treat the crack spread as a refiner’s profit. It is not. The crack is a gross margin: the difference between product revenue and crude cost, and nothing else. It says nothing about the energy a refinery burns to run its units, its labour and maintenance, its catalysts, or its financing. In a period of expensive natural gas, a wide crack can coexist with a thin operating result, because the fuel a refinery consumes eats into the paper margin. Whether that gap between paper margin and booked result is absorbed or felt in full depends on the shape of the operator, which is the ground covered by downstream margin exposure at pure-play refiners against integrated majors.
The crack is also incomplete on the product side. A real refinery sells jet fuel, petrochemical feedstocks, coke, asphalt and liquefied gases alongside gasoline and diesel, and the 3-2-1 recipe captures none of them. Jet fuel in particular, which tracks its own spot market, can be a meaningful part of a refinery’s revenue that the headline crack simply ignores.
A sense of scale helps here. Over the full 1986–2026 history the 3-2-1 crack averaged about $12 per barrel of crude, and for most of the pre-2020 era it sat closer to $9 to $10. Those are thin gross figures once refinery running costs are deducted, which is why refining is a high-volume, low-unit-margin business most of the time, punctuated by rare windows when the crack blows out. The determinants of those windows are the subject of the drivers of refining margins.
Reading the crack in context
Because the crack is a spread, it moves for reasons that have little to do with the direction of oil itself. Crude can fall while the crack widens, if product demand outruns refining capacity; crude can rise while the crack collapses, if a demand shock hits fuels harder than the barrel. Because the two legs move apart, refining P&L and sector equity returns tell different stories — part of what the long-run lag of energy shares reflects. That decoupling is the entire point of watching it: the crack isolates the refining leg from the crude leg, and it is the refining leg that drives downstream profitability. The wider mechanism, from the refinery gate through to profits, is set out in refining margins as the hidden driver of oil profits.
Historically, the crack has widened in periods of tight product supply and compressed in demand collapses. It reached the low single digits, and briefly turned negative, during the spring 2020 demand shock, and it blew out above $40 on average through 2022 when products were scarce. Analysts read a widening 3-2-1 crack as a period of stronger gross refining economics and a compressing crack as the reverse, a relationship observed across four decades of data rather than a forward-looking rule. The two product legs do not always move together, and their divergence is examined in diesel versus gasoline crack spreads. To turn the recipe into your own numbers, the refining margin simulator lets you vary crude and product prices directly.
Frequently asked questions
Why is the crack quoted per barrel when products are priced per gallon?
To make it comparable to the crude price, which is quoted per barrel. The formula multiplies the per-gallon product prices by 42 gallons and divides by the three crude barrels in the recipe, so the final crack is expressed in dollars per barrel of crude processed.
Is a high crack spread the same as a profitable refinery?
Not necessarily. The crack is a gross margin that excludes the energy, labour, maintenance and financing a refinery needs to operate. A wide crack alongside expensive natural gas can leave a modest operating result, so the crack indicates gross conditions, not the bottom line. What moves the crack from one week to the next is the crude-versus-products balance that the EIA’s weekly crude stock figures measure on the input side every Wednesday.
What is the difference between the 3-2-1 and a single-product crack?
A single-product crack (for example the gasoline crack) measures one fuel against crude. The 3-2-1 blends gasoline and distillate in a 2:1 ratio to approximate a whole refinery’s light-product slate, which makes it a broader proxy for refining economics than any single fuel spread.
Does the 3-2-1 crack use Brent or WTI?
Both conventions exist. A US 3-2-1 crack typically uses WTI crude with US gasoline and distillate quotations, while a European version pairs Brent with local product prices. The series on this site uses WTI, so it reflects the economics facing US refiners.
Go deeper
- How refinery throughput shapes the crack: reading the refinery utilisation rate.
- Where refining sits in the macro picture: commodities as macroeconomic regime signals.
Sources
- Eco3min US 3-2-1 crack spread series (WTI, RBOB gasoline, ULSD distillate), daily, 1986–2026.
- U.S. Energy Information Administration, refining and product supply concepts.
Last updated — 20 September 2026
Disclaimer – Financial Information: The analyses, commentary, and content published on eco3min.fr are provided for informational and educational purposes only. They do not constitute investment advice or a solicitation to buy or sell financial instruments. Past performance is not indicative of future results. All investment decisions involve risk and are the sole responsibility of the reader.
Read next
Full pillar →IMO 2020: the regulatory shock that rewrote product spreads
An environmental rule on marine sulfur can move a refining spread more than a swing in crude. IMO…
The 2022–2023 refining golden age: anatomy of an episode
In 2022, refined fuel prices climbed faster than crude. That gap, measured by the 3-2-1 crack spread, reached…
Diesel versus gasoline: why the two crack spreads diverge
The 3-2-1 crack blends gasoline and distillate into a single number, and that convenience hides something the market…


