
Every US Refinery Shutdown Since 1990
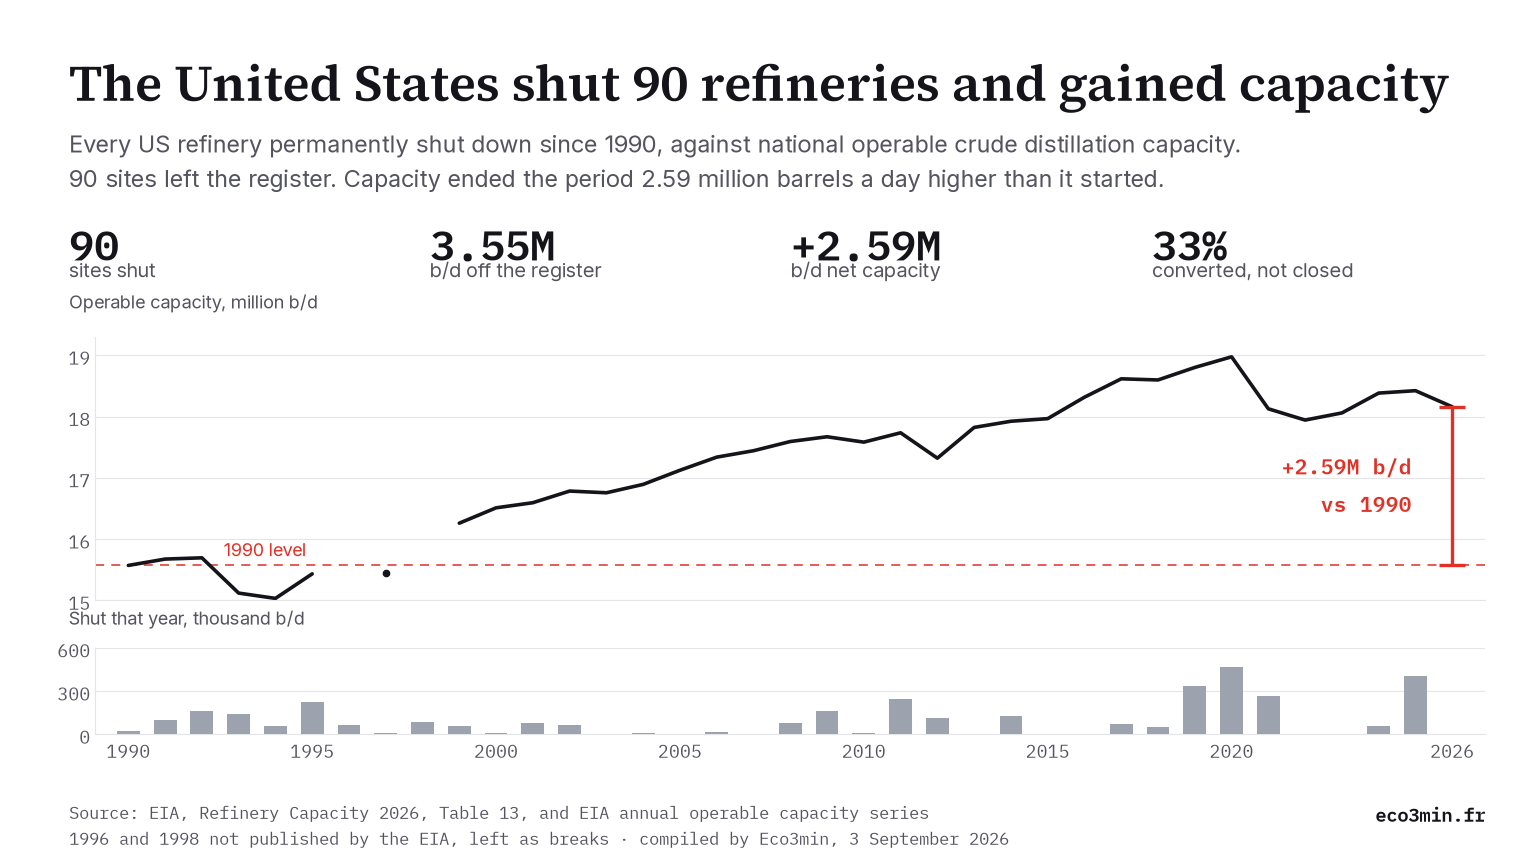
The EIA’s register of permanently shutdown refineries carries ninety entries for the 50 states between January 1990 and January 2026, totalling 3,550,327 barrels a day of crude distillation capacity. National capacity rose by 2,588,527 barrels a day over the same period.
Both figures come from the same agency, and neither is wrong. What separates them is everything the word closure hides: conversions, expansions at the sites that stayed, and a register almost nobody opens.
The press counts refineries that closed. The register counts capacity, and over thirty-six years the two move in opposite directions.
- Ninety permanent shutdowns in the 50 states between January 1990 and January 2026, 3,550,327 b/cd of crude distillation capacity, every line taken from EIA Table 13.
- Eleven of those ninety sites never stopped operating: six run as something other than a refinery, five became renewable diesel plants. They are 12 per cent of the sites and 33 per cent of the capacity.
- US operable capacity went from 15,571,966 b/cd in 1990 to 18,160,493 b/cd in 2026, spread across seventy-five fewer refineries.
- The decline is confined to the period since the January 2020 peak: down 815,592 b/cd, or 4.3 per cent, in six years.
In October 2025, the Phillips 66 refinery in Los Angeles processed crude for the last time. The EIA carries it in the register at 138,700 barrels a day, with a footnote saying the site still operates, as something other than a refinery. It is the most recent line in a list that opens in 1990, and it is a fair sample of the whole: the capacity is gone, the plant is not.
Add up every line and the United States has taken 3.55 million barrels a day of crude distillation capacity off the register since 1990. Over the same thirty-six years the country’s operable capacity rose by 2.59 million barrels a day. Both numbers belong to the same agency. Seventy-five fewer refineries, and more capacity than in 1990.
Every US refinery shutdown since 1990
One row per site, most recent first, dated by the month crude last ran through it. Capacity is atmospheric crude distillation in barrels per calendar day, the EIA’s own measure. The outcome column translates the agency’s footnotes: rows in red did not simply stop.
| # | Refinery | Location | b/cd | Last crude | Outcome | |
|---|---|---|---|---|---|---|
| 1 | Phillips 66 Company | Los Angeles, CA | 138,700 | Oct 2025 | other use | |
| 2 | Houston Refining LP | Houston, TX | 263,776 | Feb 2025 | other use | |
| 3 | Phillips 66 Company | Rodeo, CA | 58,200 | Mar 2024 | renewable diesel | |
| 4 | Phillips 66 Company | Belle Chasse, LA | 255,600 | Aug 2021 | other use | |
| 5 | Port Hamilton Refg & Transp Lllp | Kingshill, VI PADD VI | 176,400 | May 2021 | shut | |
| 6 | California Asphalt Production Inc | Santa Maria, CA | 9,500 | Apr 2021 | shut | |
| 7 | Shell Oil Products US | Convent, LA | 211,146 | Dec 2020 | shut | |
| 8 | HollyFrontier Cheyenne Refining LLC | Cheyenne, WY | 48,000 | Aug 2020 | renewable diesel | |
| 9 | Dakota Prairie Refining LLC | Dickinson, ND | 19,000 | May 2020 | renewable diesel | |
| 10 | Tesoro Refining & Marketing Co | Martinez, CA | 161,000 | Apr 2020 | renewable diesel | |
| 11 | Western Refining Southwest Inc | Gallup, NM | 27,000 | Apr 2020 | shut | |
| 12 | Philadelphia Energy Solutions | Philadelphia, PA | 335,000 | Aug 2019 | shut | |
| 13 | Continental Refining Company LLC | Somerset, KY | 5,500 | Feb 2018 | shut | |
| 14 | Shell Oil Products US | Saint Rose, LA | 45,000 | Jan 2018 | shut | |
| 15 | Axeon Specialty Products LLC | Paulsboro, NJ | 74,000 | Apr 2017 | shut | |
| 16 | Antelope Refining LLC | Douglas, WY | 3,800 | Feb 2015 | shut | |
| 17 | Pelican Refining Company LLC | Lake Charles, LA | 0 | Dec 2014 | shut | |
| 18 | Flint Hills Resources LP | North Pole, AK | 126,535 | May 2014 | other use | |
| 19 | Trigeant LTD | Corpus Christi, TX | 0 | Dec 2013 | shut | |
| 20 | Hess Corporation | Port Reading, NJ | 0 | Feb 2013 | shut | |
| 21 | Paramount Petroleum Corporation | Paramount, CA | 84,500 | Oct 2012 | renewable diesel | |
| 22 | Axeon Specialty Products LLC | Savannah, GA | 28,000 | Sep 2012 | shut | |
| 23 | Tenby Inc | Oxnard, CA | 2,800 | Dec 2011 | shut | |
| 24 | Sunoco Inc | Marcus Hook, PA | 178,000 | Dec 2011 | shut | |
| 25 | Western Refining Yorktown Inc | Yorktown, VA | 66,300 | Sep 2011 | shut | |
| 26 | Ventura Refining & Transmission LLC | Thomas, OK | 12,000 | Oct 2010 | shut | |
| 27 | Western Refining Southwest Inc | Bloomfield, NM | 16,800 | Dec 2009 | shut | |
| 28 | Sunoco Inc | Westville, NJ | 145,000 | Nov 2009 | shut | |
| 29 | Alon Bakersfield Operating Inc | Bakersfield, CA | 0 | Dec 2008 | shut | |
| 30 | Shell Chem Yabucoa Inc | Yabucoa, PR PADD VI | 77,900 | Oct 2008 | shut | |
| 31 | Chevron USA Inc | Perth Amboy, NJ | 80,000 | Mar 2008 | shut | |
| 32 | Paramount Petroleum Corporation | Portland, OR | 0 | Nov 2006 | shut | |
| 33 | Gulf Atlantic Operations LLC | Mobile, AL | 16,700 | Mar 2006 | shut | |
| 34 | Hunt Southland Refining Co | Lumberton, MS | 5,800 | Mar 2005 | shut | |
| 35 | Dow Haltermann Products | Channelview, TX | 880 | Sep 2004 | shut | |
| 36 | Young Refining Corp. | Douglasville, GA | 5,400 | Jul 2004 | shut | |
| 37 | Premcor Refining Group | Hartford, IL | 64,000 | Sep 2002 | shut | |
| 38 | Tricor Refining LLC | Bakersfield, CA | 0 | Jul 2001 | shut | |
| 39 | Chevron Phillips Chem | Guayama, PR PADD VI | 0 | Mar 2001 | shut | |
| 40 | Foreland Refining Corp. | Tonopah, NV | 0 | Feb 2001 | shut | |
| 41 | Premcor Refining Group | Blue Island, IL | 80,515 | Jan 2001 | shut | |
| 42 | Caribbean Petroleum Corp | San Juan, PR PADD VI | 42,000 | Dec 2000 | shut | |
| 43 | Chevron USA Inc. | Richmond Beach, WA | 0 | May 2000 | shut | |
| 44 | Calumet Lubricants Co LP | Rouseville, PA | 12,800 | Mar 2000 | shut | |
| 45 | TPI Petro Inc. | Alma, MI | 51,000 | Nov 1999 | shut | |
| 46 | Berry Petroleum Co. | Stephens, AR | 6,700 | Jul 1999 | shut | |
| 47 | Sound Refining Inc | Tacoma, WA | 11,900 | Oct 1998 | shut | |
| 48 | Shell Oil Co | Odessa, TX | 28,300 | Oct 1998 | shut | |
| 49 | Pride Refining Inc. | Abilene, TX | 42,750 | May 1998 | shut | |
| 50 | Petrolite Corp | Kilgore, TX | 600 | Dec 1997 | shut | |
| 51 | Gold Line Refining LTD | Jennings, LA | 12,000 | Jul 1997 | shut | |
| 52 | Total Petroleum, Inc. | Arkansas City, KS | 56,000 | Aug 1996 | shut | |
| 53 | Arcadia Refining & Mktg | Lisbon, LA | 7,350 | Jan 1996 | shut | |
| 54 | Indian Refining | Lawrenceville, IL | 80,750 | Sep 1995 | shut | |
| 55 | Cyril Petrochemical Corp | Cyril, OK | 7,500 | Sep 1995 | shut | |
| 56 | Pacific Refining Co. | Hercules, CA | 50,000 | Jul 1995 | shut | |
| 57 | Canal Refg Co. | Chuch Point, LA | 9,500 | Jul 1995 | shut | |
| 58 | Barrett Refg Corp | Vicksburg, MS | 8,000 | Jun 1995 | shut | |
| 59 | Powerine Oil Co. | Santa Fe Springs, CA | 46,500 | Jun 1995 | shut | |
| 60 | Laketon Refining | Laketon, IN | 11,100 | Jun 1995 | shut | |
| 61 | Sunland Refining Corp. | Bakersfield, CA | 12,000 | Mar 1995 | shut | |
| 62 | Pennzoil Producing Co. | Roosevelt, UT | 8,000 | Sep 1994 | shut | |
| 63 | Peerless Oil & Chemical | Ponce, PR PADD VI | 8,800 | Sep 1994 | shut | |
| 64 | Chemoil Refining Corp | Long Beach, CA | 18,000 | Feb 1994 | shut | |
| 65 | Amerada Hess | Purvis, MS | 30,000 | Jan 1994 | shut | |
| 66 | Intermountain Refining Co. | Fredonia, AZ | 3,800 | Jan 1994 | shut | |
| 67 | Dubach Gas | Dubach, LA | 8,500 | Dec 1993 | shut | |
| 68 | Marathon | Indianapolis, IN | 50,000 | Sep 1993 | shut | |
| 69 | Sunbelt Refining | Coolidge, AZ | 10,000 | Aug 1993 | shut | |
| 70 | Cibro Refining | Albany, NY | 41,850 | Jul 1993 | shut | |
| 71 | Coastal Refining & Mktg | Augusta, KS | 0 | Jun 1993 | shut | |
| 72 | Coastal Refining & Mktg | Wichita, KS | 28,800 | May 1993 | shut | |
| 73 | Saint Mary’s Refining Co | Saint Mary’s, WV | 4,000 | Feb 1993 | shut | |
| 74 | El Paso Refining | El Paso, TX | 50,000 | Oct 1992 | shut | |
| 75 | Crystal Refining | Carson City, MI | 3,000 | Oct 1992 | shut | |
| 76 | Fletcher Oil & Refining | Carson, CA | 29,675 | Sep 1992 | shut | |
| 77 | Longview Refining Assoc | Longview, TX | 13,300 | Aug 1992 | shut | |
| 78 | Rattlesnake Refining | Wickett, TX | 8,000 | Feb 1992 | shut | |
| 79 | Golden West | Santa Fe Springs, CA | 47,000 | Feb 1992 | shut | |
| 80 | Landmark Refining | Fruita, CO | 10,000 | Jan 1992 | shut | |
| 81 | Thriftway Co | Bloomfield, NM | 4,000 | Jan 1992 | shut | |
| 82 | Arochem International | Ponce, PR PADD VI | 75,600 | Dec 1991 | shut | |
| 83 | Farmland Industries | Philipsburg, KS | 26,400 | Dec 1991 | shut | |
| 84 | Amoco Oil Co. | Casper, WY | 40,000 | Dec 1991 | shut | |
| 85 | Anchor Refining Co. | McKittrick, CA | 10,000 | Jun 1991 | shut | |
| 86 | Chevron USA Inc | Kenai, AK | 22,000 | Jun 1991 | shut | |
| 87 | Intercoastal Energy Svcs Corp | Troy, IN | 1,250 | Nov 1990 | shut | |
| 88 | Vulcan Refining | Cordova, AL | 9,500 | Sep 1990 | shut | |
| 89 | Eagle Refining | Jackson, TX | 1,800 | Jan 1990 | shut | |
| 90 | Gibson Oil & Refining | Bakersfield, CA | 9,600 | Jul 1987 | shut | |
| 91 | Sabine Resources | Stonewall, LA | 12,000 | not stated | never ran | |
| 92 | Imron Refining, Inc. | San Leon, TX | 7,000 | not stated | never ran | |
| 93 | Primary Energy Corp | Richmond, VA | 6,100 | not stated | other use | |
| 94 | Eco Asphalt Inc. | Long Beach, CA | 10,550 | not stated | never ran | |
| 95 | GNC Energy Corp | Greensboro, NC | 3,000 | not stated | other use | |
| 96 | Coastal Refining & Mktg | El Dorado, KS | 0 | not stated | asphalt to 2004 |
What the word closure hides
Eleven of the ninety entries carry a footnote saying the site is still running. Six operate as something other than a refinery, which in practice means a terminal or a petrochemical unit; five were rebuilt as renewable diesel plants. Between them they account for 1,164,411 b/cd, or 33 per cent of everything that left the register, on 12 per cent of the sites.
That asymmetry is the point. Conversions are rare and large; dry shutdowns are common and small. The seventy-five sites that simply stopped average 31,418 b/cd. The eleven that were repurposed average 105,856 b/cd, larger by a factor of 3.4. A count of closures and a count of barrels therefore tell different stories about the same decade, and the count of closures is the one that circulates.
Three further entries never processed crude at all. They were registered, counted in the capacity statistics, and struck off without ever running, for 29,550 b/cd between them. One more, in El Dorado, Kansas, kept making asphalt until September 2004 with no crude distillation capacity left to report.
Seventy-five fewer refineries, and more capacity
The United States ran 205 operable refineries on 1 January 1990 and 130 on 1 January 2026. It refines crude in seventy-five fewer places and has 2,588,527 b/cd more capacity, a rise of 16.6 per cent.
The arithmetic closes one way only. If 3,550,327 b/cd left the register and the national total gained 2,588,527 b/cd, the sites that stayed, plus the few that opened, added 6,138,854 b/cd between them. That is 1.73 times everything that shut. Very little of it came from new refineries: the last American greenfield sites of any size date from the 1970s. It came from debottlenecking, from unit replacement, from the annual creep that turns a 150,000 barrel plant into a 250,000 barrel plant with no ribbon cut. The average operable refinery grew from 75,961 b/cd to 139,696 b/cd, a factor of 1.84.
The register carries the same signal in its own shape. Shutdowns are getting rarer and much bigger.
| Period | Sites | b/cd shut | Average |
|---|---|---|---|
| 1990s | 44 | 930,425 | 21,146 |
| 2000s | 15 | 427,895 | 28,526 |
| 2010s | 15 | 961,435 | 64,096 |
| 2020s, six years in | 10 | 1,191,922 | 119,192 |
The 44 shutdowns of the 1990s removed 930,425 b/cd between them. The ten of this decade have already removed 1,191,922 b/cd in six years. Fewer events, more barrels, and each one large enough to move a regional balance on its own. Regional balances are exactly the grain at which physical commodity markets — oil, gas, copper, critical minerals — get read, one basin at a time.
American refining emptied out geographically over thirty-six years without shrinking, because the survivors grew faster than the closures took away.
Where the loss is real
Everything above covers 1990 to 2026. Narrow the window and the sign flips. Operable capacity peaked at 18,976,085 b/cd on 1 January 2020 and stood at 18,160,493 b/cd six years later, a fall of 815,592 b/cd, or 4.3 per cent. The register puts ten sites in that window, worth 1,191,922 b/cd gross. It is the steepest six-year fall since the window that ended in 1994, and the creep at the surviving sites has stopped covering the exits. Less capacity to run means less crude pulled from storage each week, a shift that the weekly EIA series of US commercial crude stocks has recorded since 2020.
The losses are concentrated as well as recent. California alone accounts for seventeen of the ninety entries and 688,025 b/cd, 19 per cent of the national total, in a state that brings the balance in across a mountain range or by sea. Eco3min covers that recent window site by site in the closures since the 2020 peak, which counts eleven of them and about 1.72 million b/d gross.
That page and this one do not return the same subtotal for the same years, and the reason is the basis rather than an error in either. This register admits a site only once the EIA has recorded it as permanently shut down, at the agency’s own calendar-day capacity. The recent-window page works from company nameplate figures and trade press, including one site announced but not yet recorded as shut down by the EIA, which runs ahead of the official record. The clearest case is Valero’s refinery at Benicia, California: 145,000 b/cd, still counted as operating in the EIA file dated 1 January 2026, after the company had told the California Energy Commission on 16 April 2025 of its intent to “idle, restructure, or cease refining operations at Valero’s Benicia Refinery by the end of April 2026”. It belongs in the story and not yet in the table. It will enter the register in next year’s edition.
The error is reading a count of closed refineries as a measure of lost capacity. It misleads because the largest exits are conversions of very big plants while the typical exit is a small site nobody names, and because the survivors kept growing throughout. The count describes the map; only the barrels describe the supply.
What this register does not prove
Capacity is not output. A refinery counted at 200,000 b/cd may run at eighty per cent for a year, and that gap is wider than most of the closures in the table. What the plants actually did with the capacity sits in the weekly utilisation series, and the thresholds that make it readable are set out in how to read that rate.
Capacity is not product supply either. Nothing here measures the gasoline or diesel available to an American driver, which depends on imports, on the product slate each site is configured for, and on where the pipelines run. A barrel of capacity in Texas does not serve California.
The register is also silent on why. It records that a site stopped and, sometimes, what it became. It does not say whether the margin failed, the crude slate changed, the environmental capital cost landed badly, or the owner preferred the land. Those questions belong with the 3-2-1 crack spread, and with the way a margin lands differently on pure-play refiners and integrated majors.
Finally, permanent is a status, not a prophecy. The EIA counts separately the refineries that are idle without being struck off: eleven of them in 1990, two in 2026. A site can sit idle for years before it reaches Table 13, or restart and never reach it at all. The register captures the end of the story, not the middle. The middle shows up elsewhere, in the utilization rate, which is what the crack spread read alongside refinery utilization sets against the margin.
The gaps, named
The EIA does not publish annual capacity figures for 1996 or 1998. Both years are empty in the CSV and drawn as breaks in the chart. They are not interpolated, which would hide two missing observations behind a straight line.
Four further limits belong on the page rather than in a footnote:
- Dates are month and year only. The register cannot separate two shutdowns in the same month, and it dates a site by when crude last ran, which can precede the formal shutdown by years.
- Fifteen of the ninety-six entries carry no formal shutdown date, either because the site never operated or because it is still running as something else.
- One entry, in Santa Maria, California, has no downstream charge capacity in the source. The cell is left empty in the CSV rather than set to zero.
- The footnote for a converted site says it operates as other than a refinery. It does not say as what. Terminal, petrochemical plant and storage are not distinguished in the source, so they are not distinguished here.
Puerto Rico and the US Virgin Islands are the last boundary. The EIA reports them as a sixth district and holds them outside its US total, so this page does the same: six entries and 380,700 b/cd, flagged in the table and carried in the CSV, sit outside every national figure quoted above. The largest of them, at Kingshill, was bigger than all but five of the mainland shutdowns.
Questions
How many US refineries have closed since 1990?
Ninety in the 50 states, on the EIA’s register of permanently shutdown refineries covering January 1990 to January 2026, plus six in Puerto Rico and the US Virgin Islands, which the agency reports outside its US total. They represent 3,550,327 and 380,700 barrels a day of crude distillation capacity respectively.
Has the United States lost refining capacity since 1990?
Not on the EIA’s operable capacity series: 15,571,966 b/cd on 1 January 1990 against 18,160,493 b/cd on 1 January 2026, a rise of 16.6 per cent across seventy-five fewer refineries. The decline is confined to the period since the January 2020 peak, which is down 4.3 per cent.
What is the difference between a refinery closure and a conversion?
A closure ends crude processing at the site. A conversion ends crude processing and keeps the site running for something else, usually a terminal, a petrochemical unit or a renewable diesel plant. The EIA marks the difference with a footnote in Table 13. Eleven of the ninety entries are conversions, and they carry 33 per cent of the capacity involved.
Which was the largest US refinery to shut since 1990?
Philadelphia Energy Solutions, in Philadelphia, PA, at 335,000 barrels a day of atmospheric crude distillation capacity. Crude last ran there in August 2019 and the site was struck off the register in May 2020.
Last updated — 19 September 2026
Disclaimer – Financial Information: The analyses, commentary, and content published on eco3min.fr are provided for informational and educational purposes only. They do not constitute investment advice or a solicitation to buy or sell financial instruments. Past performance is not indicative of future results. All investment decisions involve risk and are the sole responsibility of the reader.