Reading the refinery utilisation rate: the threshold, the season, the turnarounds

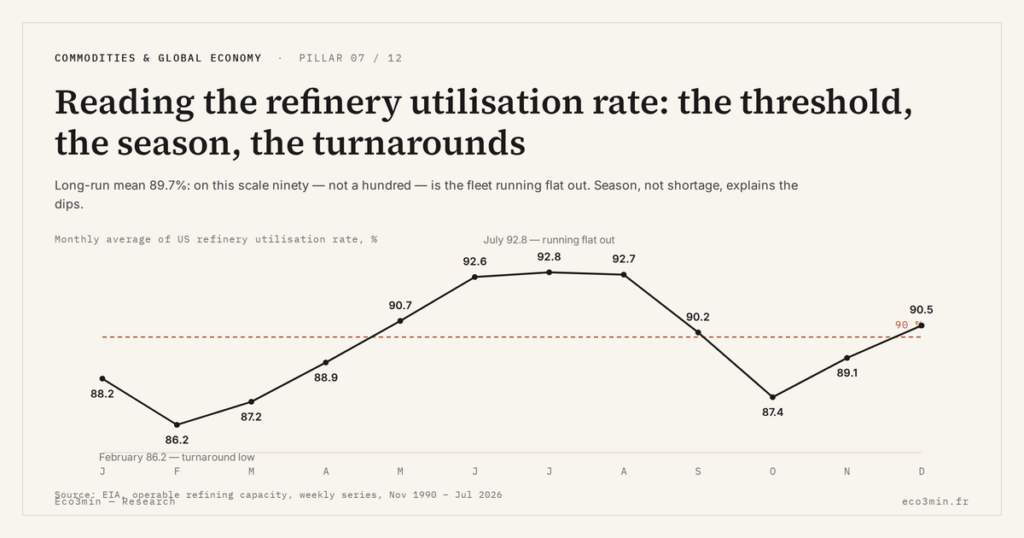
A refinery runs full near ninety percent, not a hundred: the last slice of nameplate capacity is a maintenance margin that cannot be squeezed out. Confuse that ceiling with empty space and a routine turnaround reads as a phantom shortage.
The EIA utilisation series looks like a plain percentage. Read without its threshold, its seasonality and its maintenance calendar, it raises the wrong alarm at the wrong moment.
The US refinery utilisation rate has averaged 89.7% since 1990: on that scale ninety, not a hundred, is the fleet running flat out.
- Long-run mean of 89.7% and median of 90.2% (weekly EIA series, 1990–2026): the rate sits below 90% almost one week in two (46.6%).
- Two maintenance windows carve the year: a summer peak (June to August near 92.7%) framed by shoulder-season lows (February 86.2%, October 87.4%).
- The extremes are context, not signal: 56.0% during Winter Storm Uri (26 February 2021), 67.6% at the April 2020 demand collapse, above 100% only twice in 36 years.
The number feels intuitive. It is a percentage of capacity in use, so a reading of 88% invites the thought that 12% sits idle, ready to answer a shortage. That intuition is the trap. Since November 1990 the weekly US utilisation rate published by the EIA (percent utilisation of operable refining capacity) has averaged 89.7%, and it has spent nearly half its history, 46.6% of weeks, below 90%. If 90% meant half-empty, the American refining fleet would have been half-empty for most of the past three decades. It has not.
The series only reads correctly once three references are fixed: the threshold that counts as full, the season that moves the number on schedule, and the maintenance calendar that explains the dips. Get those right and the alarms stop being false. The mechanics help: the EIA reports the figure weekly, as barrels of crude processed divided by operable capacity across all refining districts, so it is a snapshot of how hard existing plants are working, not of how much capacity exists.
The threshold: why ninety already means full
A refinery cannot hold 100% of its nameplate for long. Operable capacity is a rated reference, not a physical ceiling, and a plant needs slack for the units cycling through inspection, cleaning and repair. Across thirty-six years the US fleet has printed 100% or more exactly twice, both in the summer of 1998, with a high of 100.5% on 28 August 1998. That is 0.11% of all weeks. The rest of the time the practical ceiling sits a notch below the round number, which is why a reading in the high nineties already describes a system with almost nothing in reserve. The thirty-six-year record of US refinery shutdowns bears on the base that leaves that reserve so thin: ninety sites struck off since 1990, seventy-five fewer plants, and yet more operable capacity than the country held then.
So the working threshold is roughly 90%. The median week reads 90.2% on the weekly EIA series, slightly above the mean, because the distribution is lopsided: a hard top near capacity, a long tail running down into crises. That shape matters for reading a single print. The upside is capped by physics, the downside is open to shocks, so the same distance below the mean and above it does not carry the same meaning. When the rate climbs into the mid-nineties the fleet is already working hard. Readings at or above 95% have occurred only about one week in eight (12.2%) since 1990. For a refinery, full reads at ninety, not a hundred.
The season: a summer peak framed by two turnarounds
The rate moves on a calendar more than on the news. Averaged month by month across the whole series, utilisation peaks in summer (June 92.6%, July 92.7%, August 92.7%) and sags in the shoulder seasons (February 86.2%, October 87.4%). The swing between the October low and the July high is close to six points, wider than most of the weekly moves that reach the headlines.
Behind that shape sit the turnarounds. Refiners schedule their heavy maintenance in spring and autumn, on purpose, so that units are back at full tilt for the two demand peaks, summer driving and winter heating. A dip in March or October is usually the calendar at work, not a plant in distress. The practical consequence is a discipline of comparison: read April against April, not April against the previous July, or the season will masquerade as a trend. The same logic applies in reverse to the summer number, flattered by the demand peak, which compares meaningfully only against prior summers, not against a quiet spring.
The extremes: reading the anomalies
The lowest prints are the ones most often misread. The 56.0% recorded on 26 February 2021 was Winter Storm Uri freezing Gulf Coast refineries offline; the 67.6% of 17 April 2020 was the demand side collapsing as driving stopped, in a year that averaged 78.6%, the worst in the series. Neither figure describes the ordinary supply-and-demand balance. Both are shocks that the number logged faithfully and briefly, then unwound. The lesson is to date the outlier before interpreting it: almost every reading far from 90% has a named cause in the weather, a hurricane season, or a demand event, and reads as noise once that cause is attached.
The national figure also hides where the barrels sit. The EIA rate is an average across five refining districts, and the Gulf Coast (PADD 3) alone runs close to half of US capacity. That concentration is why weather on the Gulf swings the national number so hard: Uri in February 2021 and the Atlantic hurricane season act on the single region that dominates the average. A reading that looks like a national shortage is often a regional outage weighted up by geography.
A fall in the utilisation rate gets read as a supply squeeze. But most declines are scheduled: spring and autumn turnarounds pull the number down by design, and the deepest troughs on record (Uri in 2021, the 2020 demand shock) are weather and demand events rather than a tightening market. What actually points to a tight physical market is a high rate holding on a shrinking capacity base, not a shoulder-season dip.
Reading today’s number
The denominator matters as much as the throughput. The rate is barrels processed divided by operable capacity, and the US capacity base contracted after the post-2020 wave of US refinery closures. On a smaller denominator the same barrels read as a higher percentage. That is part of why recent prints sit high: the series reached 95.8% on 3 July 2026, in summer peak season and on a structurally tighter fleet, a level it has visited only about 12% of the time since 1990.
One more distinction sharpens the reading. The denominator is operable capacity, not total capacity, so a mothballed plant leaves the rate untouched while only running-but-throttled capacity pulls it down. And the rate never balances the market on its own. When domestic refineries run below their peak, product imports and inventory draws fill the gap; when they run flat out, as in the summer of 2026, exports and stock draws do the adjusting instead. The utilisation rate says how hard the fleet works, while the balance is settled at the border and in the tanks. Those tanks have their own weekly series, US crude oil stocks excluding the Strategic Petroleum Reserve, published in the same report and read as the mirror image of refinery runs.
A last caution keeps the metric honest: it measures a rate, not a volume. A high percentage on a shrunken capacity base can sit alongside lower absolute output than a middling percentage produced on a larger base a decade earlier. So a record-looking utilisation rate does not automatically mean record barrels of gasoline and diesel reaching the market; it means the standing fleet is running near the top of what it can do. When the question is how much fuel is actually being made, the throughput and production series carry the answer, and the utilisation percentage only frames how hard the existing plants are pushed to make it.
Used well, a single print is always read against three anchors: the long-run mean of 89.7%, the median week of 90.2% that splits the record almost in half, the same month a year earlier, and the capacity base of the moment. The full weekly series, with those references attached, sits in the underlying utilisation dataset. The same denominator links this metric to the margin story: the 2022–2023 refining boom coincided with utilisation running hard against post-closure capacity, which is why the anatomy of that golden age and the utilisation rate share a chapter. For the wider read on how tight throughput feeds refining profitability, the barometer of refining margins carries the rest.
The utilisation rate is not a fuel gauge sliding toward zero. It oscillates inside a narrow band, with a hard top near capacity and a floor that only shocks can breach, and its ordinary movements are written by the maintenance calendar rather than by the market. Read against its threshold and its season, a print near 96% in July says less about a crisis than about a fleet doing in summer exactly what it was built to do, on a capacity base that no longer has much room to grow.
Last updated — 19 September 2026
Disclaimer – Financial Information: The analyses, commentary, and content published on eco3min.fr are provided for informational and educational purposes only. They do not constitute investment advice or a solicitation to buy or sell financial instruments. Past performance is not indicative of future results. All investment decisions involve risk and are the sole responsibility of the reader.
Read next
Full pillar →The 2022–2023 refining golden age: anatomy of an episode
In 2022, refined fuel prices climbed faster than crude. That gap, measured by the 3-2-1 crack spread, reached…
Diesel versus gasoline: why the two crack spreads diverge
The 3-2-1 crack blends gasoline and distillate into a single number, and that convenience hides something the market…
The 3-2-1 crack spread explained: refining margin in one formula
A refinery is, in the crudest terms, a spread trade: it buys crude oil, transforms it, and sells…