
How Much You Need to Retire: the Income Gap, the Vehicles and the Math
The retirement question is not “how big a number” but “what income will be missing, and through which accounts can it be filled”.
- Social Security’s main trust fund (OASI) is projected to deplete in 2033, after which continuing income would cover about 77% of scheduled benefits absent congressional action (SSA, 2025 Trustees Report).
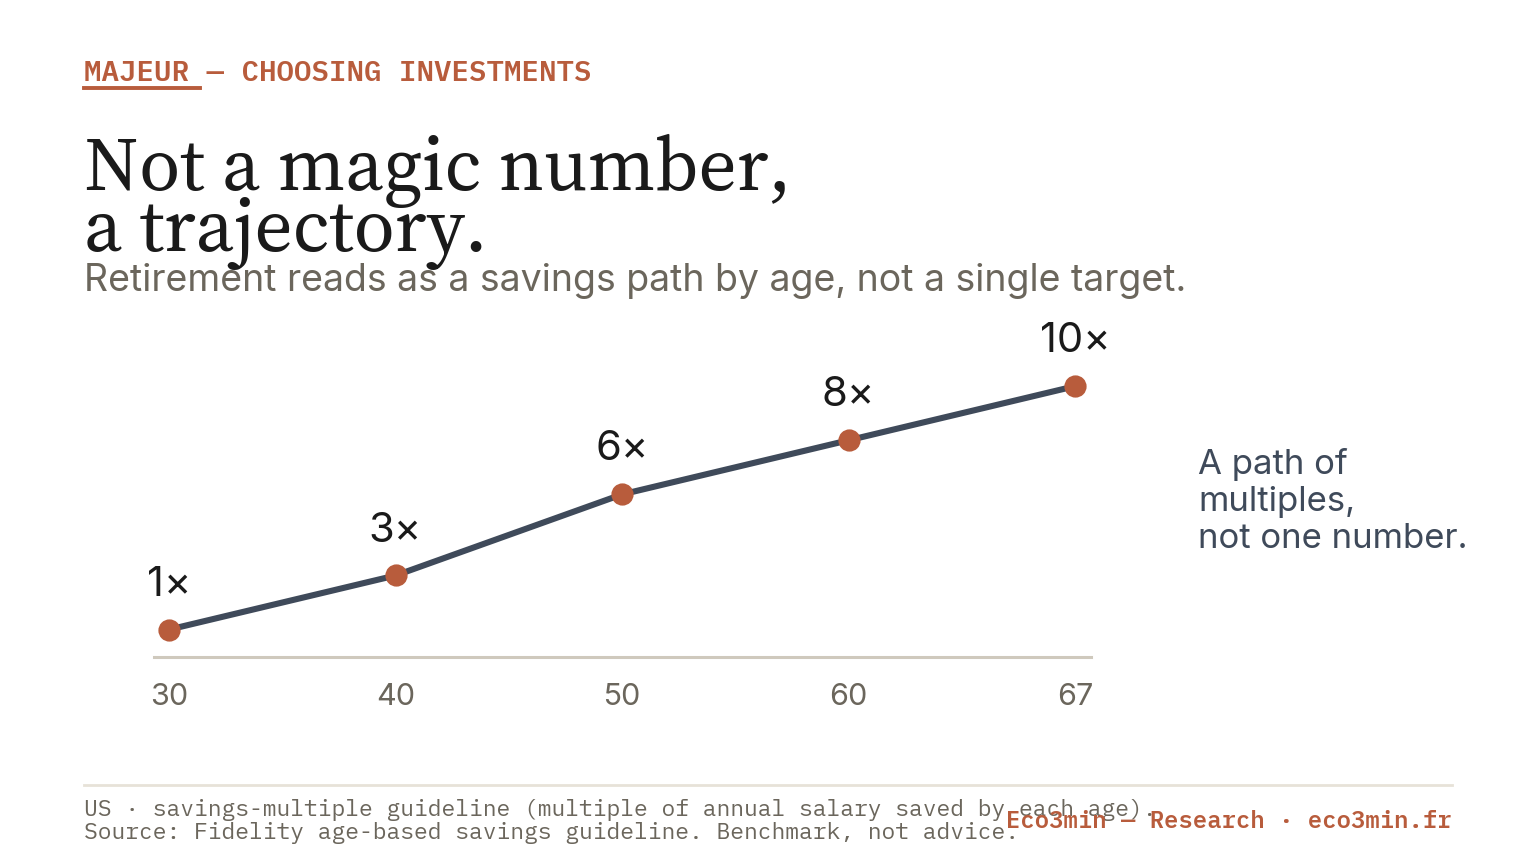
- The widely cited savings multiples (1x salary by 30, 3x by 40, 6x by 50, 8x by 60, 10x by 67) rest on specific assumptions: a 45% replacement rate from savings, retirement at 67, 15% saved a year, no pension (Fidelity).
- Two careers with the same average return can end with very different balances, because the order of returns near retirement, not the average, drives depletion.
A retirement plan built around a single target number tends to answer the wrong question. The useful figure is not a lump sum but the income that savings must generate once work stops, and the accounts through which that income is drawn.
Vendor calculators sell a “magic number”, a million dollars, a salary multiple. This page reframes the problem: size the gap between projected income and projected needs, then map the vehicles and their tax clocks that fill it.
Retirement is an income gap with a deadline
Retirement isn’t a number; it’s an income gap with a deadline. The starting point is not a balance to accumulate but a monthly income to replace, and the first input is what Social Security will and will not cover. On current projections, the Old-Age and Survivors Insurance trust fund reaches depletion in 2033, at which point incoming payroll taxes would fund roughly 77% of scheduled benefits unless Congress acts, an implied cut of about 23% (Social Security Administration, 2025 Trustees Report). Combining the retirement and disability funds, a step that would require legislation, pushes the date to 2034 with about 81% payable. In August 2025 the program’s chief actuary estimated that the tax law enacted that July would advance depletion by roughly a year. The takeaway for planning is narrow: Social Security is a foundation, not a full replacement, and the base it provides is itself under fiscal pressure. The framework for reading any long-horizon savings decision against the prevailing environment is the sub-pillar on choosing retirement vehicles by regime.
The deadline in the phrase matters as much as the gap. Unlike most financial goals, retirement has a fixed horizon set by when you stop earning, and the years just before and after that date carry outsized weight, as the sequence section below shows. Sizing the gap therefore means projecting two things: the income other sources will supply, and the income your own savings must add on top. The dedicated read on the retirement income gap works through that subtraction in detail; this page keeps it at the level of method.
Sizing the gap
The mechanics are a subtraction, not a rule of thumb. Start from the income you will want in retirement, expressed as a share of your final working income. Subtract what predictable sources will provide, principally Social Security, plus any pension. What remains is the gap your savings must fund. Estimating the Social Security piece is now straightforward: the annual statement projects a benefit at each claiming age, and claiming earlier permanently reduces it while claiming later raises it. The share of pre-retirement income that savings must replace is what most vendor frameworks anchor on, and Fidelity, for one, builds its guidance around replacing about 45% of pre-retirement income from savings after Social Security. That percentage is an assumption, not a law, and it moves with your other income and your spending. For the deeper question of what a realistic personal target looks like, the FAQ on how much to save for retirement is the reference.
Two adjustments make the subtraction less abstract. First, spending in retirement is not a single figure: analysis of national spending data suggests most households need somewhere between 55% and 80% of pre-retirement income, with the share falling for those who expect to downsize and rising for those who plan to travel. Where you sit in that band moves the gap directly. Second, health care is a line item large enough to change the answer: Fidelity’s 2025 estimate puts the after-tax cost of health care in retirement for a 65-year-old at about $172,500, a figure that sits outside most back-of-envelope calculations. Third, the claiming age is a lever on the Social Security piece itself: claiming at 65 rather than at the full retirement age of 67 permanently reduces the benefit by roughly 13%, which widens the gap savings must cover. None of these is a target to hit; each is an input to size honestly before any account is chosen.
The vehicles and their clocks
Every retirement account runs on a clock, a set of rules about when money goes in tax-advantaged and when it can come out without penalty. That clock, more than the headline return, shapes the outcome, and it is where the vehicles genuinely differ.
The 401(k): the workplace default
The 401(k) is where most Americans save, and its defining feature is the employer match, money added on top of your own contributions up to a limit. The match is the closest thing to a guaranteed return in the system, which is why the conventional funding order puts capturing it first, before other accounts, as set out in the read on the match-first funding order. The clock: contributions are pre-tax and reduce this year’s taxable income; withdrawals in retirement are taxed as ordinary income; and taking money before age 59 and a half generally triggers a penalty on top of tax, the subject of the read on early 401k and IRA withdrawal penalties. A structural shift sits underneath all this: the move from employer pensions, which promised a defined income, to 401(k) accounts, which promise only a balance and transfer the investment and longevity risk to the worker, is traced in the pension-to-401k risk shift. A pension promised a check; a 401(k) promises an account.
IRA and Roth: the two tax clocks
The IRA is the individual counterpart to the workplace 401(k), and the distinction between the two wrappers, contribution limits, access to employer money, investment menu, is drawn in 401k versus IRA wrappers. Cutting across both is the Roth-versus-traditional choice, which is really a choice about when you pay tax. Traditional accounts deduct now and tax the withdrawal; Roth accounts tax now and leave the withdrawal untaxed. The decision hinges on whether your tax rate is likely to be higher today or in retirement, and the two timelines are compared in Roth versus traditional tax clocks. Neither is uniformly better; they resolve differently for different situations.
Annuities: insurance, not investment
An income annuity is a different kind of instrument. In exchange for a lump sum, an insurer pays a guaranteed income for life, converting a pool of savings into a stream that cannot be outlived. That solves the longevity problem the 401(k) leaves open, but it is insurance against outliving your money, not a growth vehicle, and it comes with its own costs and trade-offs, weighed against keeping the money invested and drawing it down yourself in annuities versus self-managed income. The relevant comparison is not annuity against stock market, but a guaranteed floor against the flexibility and upside of a self-managed drawdown, two different answers to the same longevity question.
The income-multiple benchmarks, as commonly cited references
The salary multiples that dominate retirement coverage, save 1x your income by 30, 3x by 40, 6x by 50, 8x by 60, and 10x by 67, are useful precisely because they are concrete, and misleading precisely because their assumptions are usually dropped when they are quoted. Fidelity, the most cited source of these figures, derives them from a specific model: a 45% replacement rate from savings, retirement at 67, a 15% annual savings rate from age 25, real wage growth of 1.5%, a plan through age 93, and a 90% confidence level under adverse markets. Change any of those and the multiple changes. Retiring at 65 rather than 67 raises the target to roughly 12x, because fewer years of contributions and more years of drawdown pull in opposite directions; retiring later lowers it. The benchmarks also assume no pension and were calibrated across a middle income band, so they travel poorly outside it.
Treating a salary multiple as a personal target confuses a modelling shorthand with a plan. The 10x-by-67 figure is the output of fixed assumptions (45% replacement, retirement at 67, no pension); the median American sits well below it at every age. It is a yardstick for direction, not a finish line.
Read as references rather than goals, the multiples do useful work: they turn an abstract worry into a checkpoint. The honest use is to treat them as one measure among several, alongside the replacement-rate math above and the withdrawal-rate question below, which is roughly how the vendors themselves frame them when the footnotes are included.
Two facts keep the benchmarks in proportion. The first is distance: Federal Reserve survey data show the median American well behind the multiple at every age cohort, so the figure describes an aspiration, not a norm, and being below it is the common case rather than the exception. The second is that the multiples are not the only frame. A parallel rule of thumb targets 25 times annual spending, the inverse of a 4% withdrawal, and lands at a materially higher number than the salary-multiple method for the same person, a reminder that these are modelling conventions rather than facts. The contribution machinery underneath all of them changed at the margin for 2026, with the standard 401(k) employee limit at $23,500 and a larger catch-up of $31,000 available from age 50, which is where the fragile-decade saver can accelerate. The point is not which convention is right but that a single quoted number always hides a model. A single convention hides a state-level variable too, since a retiree’s tax bill depends on residence, the exception documented in the effect of high-tax states on migration.
What averages hide: sequence-of-returns risk
Here is the part that the “magic number” hides entirely. Two retirees can experience the exact same set of annual returns, with the exact same average, and end up in very different places, because the order in which those returns arrive is not neutral once you are drawing money out. A run of poor returns early in retirement forces you to sell more shares to fund the same withdrawal, permanently shrinking the base that later good years can grow. The same returns in the opposite order leave the portfolio far healthier. This is sequence-of-returns risk, and it is why the average return quoted in a projection can be honest and still misleading, the same caution that runs underneath the four-percent debate below.
The window that matters most is narrow: the few years on either side of the retirement date, sometimes called the fragile decade. Before it, a downturn is an opportunity, since you are still buying and time repairs the damage. After it, once withdrawals begin, a downturn is realised as sold shares that never come back. That asymmetry is why two people who retire five years apart into different market weather can face very different outcomes on identical lifetime average returns, and why a plan that looks robust on an average-return spreadsheet can still fail in practice. It is also why the order effect, not the average, is the risk a decumulation plan has to manage first.
See the order effect
The tool below takes a starting balance and a withdrawal rate, then runs the same set of annual returns in two different orders, an unfavourable early sequence and a favourable one, and shows the remaining balance over time. The two paths share an identical average by construction, so any divergence you see is the order effect alone. The sequences are illustrative and share a fixed mean; they are not a forecast, and no path is presented as what will happen.
[eco3min_retirement_seq_sim lang=”en”]The 4% rule and its assumptions
The best-known drawdown guideline holds that withdrawing about 4% of a starting balance, then adjusting that dollar amount for inflation each year, has historically sustained a portfolio across a multi-decade retirement. It is a useful anchor, and vendors today often cite a range of roughly 4% to 5% as potentially sustainable. But it rests on a particular history, a particular asset mix and a fixed horizon, and sequence risk is exactly the force that can break it: a bad early sequence can exhaust a portfolio that the average return alone would have preserved. The rule’s origins, its record and the challenges to it are set out in the 4 percent rule and its challenges. It is a reference point for framing withdrawals, not a rule that guarantees an outcome.
The vehicles, side by side
The grid summarises the clocks. Read it by column: the deciding question is which constraint, access, tax timing, or guarantee, matters most for your situation.
| Vehicle | Tax clock | Access before 59½ | What it does well | The catch |
|---|---|---|---|---|
| 401(k), traditional | Deduct now, taxed on withdrawal | Penalty plus tax, limited exceptions | Employer match; high contribution limit | Menu set by the plan; RMDs later |
| IRA / Roth IRA | Traditional deducts now; Roth taxes now, tax-free later | Roth contributions accessible; earnings restricted | Wide investment menu; Roth flexibility | Lower contribution limits; income caps on Roth |
| Income annuity | Depends on funding source | Generally illiquid once annuitised | Guaranteed income for life | Gives up liquidity and upside; insurer credit risk |
| Taxable brokerage | Taxed on realised gains, long-term rates | Fully liquid, no penalty | No access rules; flexibility | No upfront tax break; annual tax drag |
No column dominates. The account that suits an early retirement, where access before 59 and a half is the binding constraint, is not the one that suits a saver focused purely on the largest upfront tax break. Horizon, expected tax path and the need for a lifetime income floor decide the mix, which is why a plan combines vehicles rather than crowning one. Holding money across traditional, Roth and taxable buckets also buys a form of tax diversification: it leaves room to draw from whichever bucket is cheapest in a given year, and it softens the bite of required minimum distributions that eventually force taxable withdrawals from traditional accounts. The wider comparison of where retirement sits among competing goals is the sub-pillar on retirement among investment goals, read inside retirement within a long-term strategy.
Retirement read through the macro regime
The gap and the vehicles are personal arithmetic; the environment they play out in is not. Two macro forces bear on a multi-decade retirement plan more than any single year’s return. The first is the real return, the return after inflation, which is what actually funds spending: a nominal balance that grows while prices grow faster leaves you poorer, the distinction unpacked in the real return that matters for retirement. The second is the possibility of a prolonged low-growth, low-real-return environment, the secular-stagnation case, which would lower the returns a plan can rely on, mapped in the Atlas on retirement in secular stagnation. Where the current setting sits is shown on the dashboard for the macro regime weighing on retirement.
Because no asset behaves the same across every environment, the way to place equities, bonds and cash for a decumulation horizon is against the regime rather than in isolation, which the tool comparing asset classes compared across regimes makes visible. The demographic backdrop, an ageing population pressing on a pay-as-you-go base, is the same force behind Social Security’s funding gap and behind the declining coverage a plan must anticipate.
The scale of that backdrop is worth stating plainly. In 1960 there were more than five workers paying into Social Security for every beneficiary; that ratio has fallen to about three to one and is projected to slip below 2.5 to one by mid-century (Social Security Administration). The immediate pressure has a name, “Peak 65”, the 2024 to 2027 stretch in which more than four million Americans turn 65 each year, the largest wave of retirements in the country’s history. None of this predicts a market path, and this page makes no forecast. What it establishes is the planning premise: the public foundation is under measurable strain, the replacement it provides is set to shrink, and the share a plan must self-fund is therefore rising, which is exactly why sizing the gap first, rather than chasing a headline number, is the discipline this page argues for.
A retirement plan is built backward from the income gap and forward through the tax clocks, not around a single number a calculator prints.
Frequently asked questions
How is the retirement income gap estimated?
Start from the income you will want in retirement, usually expressed as a share of your final working income, then subtract predictable sources such as Social Security and any pension. What remains is the gap your own savings must fund. The Social Security piece comes from your annual statement, which projects a benefit at each claiming age; the replacement share to target is an assumption that varies with spending and other income.
How do the tax clocks of a 401(k), IRA and Roth differ?
A traditional 401(k) or IRA deducts contributions now and taxes withdrawals as ordinary income; a Roth taxes contributions now and leaves qualified withdrawals untaxed. The 401(k) adds an employer match and a higher contribution limit but a plan-set menu; the IRA offers a wider menu but lower limits, and the Roth adds income caps. Early withdrawals before 59 and a half generally face a penalty on top of tax, with limited exceptions.
Why can two careers with the same average return end with different balances?
Because once you are withdrawing money, the order of returns matters, not just the average. A run of poor returns early forces larger share sales to fund the same withdrawal, permanently shrinking the base that later good years can grow. The identical set of returns in the opposite order leaves the portfolio much healthier. This is sequence-of-returns risk, and it is why an honest average can still mislead.
What do the income-multiple benchmarks assume, and where do they break?
The common multiples (1x by 30 up to 10x by 67) assume a 45% replacement rate from savings, retirement at 67, a 15% annual savings rate, real wage growth of 1.5%, no pension, and a middle income band. Change the retirement age and the target moves: roughly 12x for retiring at 65, lower for later. They are commonly cited reference points, useful for direction, not personal targets, and the median saver sits well below them.
How has the 4% rule held up across regimes?
The guideline of withdrawing about 4%, then adjusting for inflation, has historically sustained a portfolio over a multi-decade retirement in the markets studied, and vendors today often cite a 4% to 5% range as potentially sustainable. It depends on a particular history, asset mix and horizon, and a poor early sequence is the main force that can break it, which is why it is a framing reference rather than a guarantee.
This content is published for information only. It is not investment or tax advice and does not recommend any account, product or allocation. Figures reflect rules and projections available in 2026 and can change; individual situations vary. Sources: Social Security Administration, 2025 Trustees Report; Fidelity retirement guidelines, 2025-2026.
Last updated — 29 August 2026
Disclaimer – Financial Information: The analyses, commentary, and content published on eco3min.fr are provided for informational and educational purposes only. They do not constitute investment advice or a solicitation to buy or sell financial instruments. Past performance is not indicative of future results. All investment decisions involve risk and are the sole responsibility of the reader.