
The 1970s vs 2022: Same Inflation, Opposite Winners

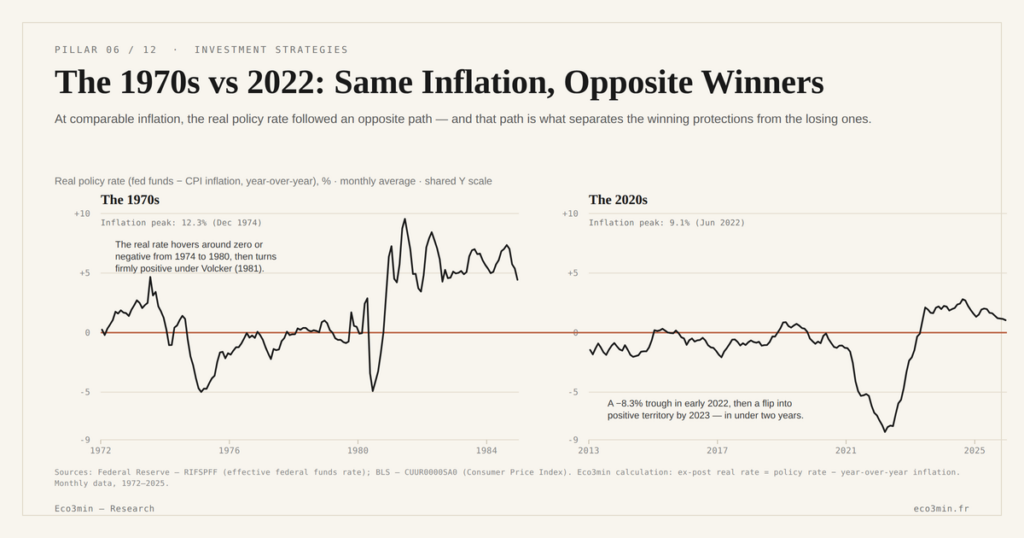
The 1970s and the 2021-2022 episode show high inflation almost twinned by level, but opposite winners: gold, cash and property switched sides, because the path of real rates was reversed.
TL;DR
Gold rose from $35 to near $850 across the 1970s but disappointed in 2022 at similar inflation, because the real-rate path flipped from negative to positive within a year.
- Cash made the reverse trip: a steady real loss through the 1970s, then a positive real return once short rates moved above inflation in 2023, the same vehicle with the opposite verdict.
- The cause sits in the monetary response. The real policy rate sat around zero or below from 1974 to 1980, in concentrated stretches rather than continuously, turning firmly positive only after Volcker pushed the policy rate to 19.1% in June 1981; in 2022 the Fed lifted it from a trough of minus 8.3% in under two years, having raised the target from 0-0.25% to 5.25-5.5%.
- Equities fell in real terms in both episodes, but persistence differed: a decade-long depression under entrenched negative real rates in the 1970s versus a sharp, brief drop in 2022, the broad US index's worst year since 2008, that rebounded in 2023.
- Long bonds and commodities behaved alike in both episodes; what reverses is the hedges whose value depends on real rates rather than on the price shock itself.
This page sets the two episodes side by side, series by series, to show what made the protections diverge. The cause is not nominal inflation, but the monetary response.
Two inflations twinned by level
Seen by the price level alone, the two episodes resemble each other. According to the Bureau of Labor Statistics, US inflation rose above 12 percent in 1974 after the first oil shock, then peaked near 15 percent in early 1980 after the second. Each successive peak is catalogued in the chronology of U.S. inflation waves and their successive peaks. In 2022, the same index reached 9.1 percent in June (BLS), a four-decade high. In both cases the instinctive diagnosis was identical: “high inflation.” It is this shared diagnosis that led many savers, in 2021, to replay the 1970s scenario, moving into gold and real assets.
The resemblance stops at the level. The nature of the two inflations already differed: a dominant oil supply shock in the 1970s, a blend of logistics breakdown and fiscal stimulus in 2021. But the decisive divergence is not there. It lies in the monetary response, and therefore in the real-rate path each episode drew. That divergence is what flipped the protections, as the two inflation logics sets out.
An opposite monetary response
In the 1970s, monetary policy stayed behind inflation for a long time. Nominal rates did not keep pace with prices, so the real policy rate sat around zero or below from 1974 to 1980. That negativity was concentrated rather than continuous: twenty-six straight months from September 1974 to October 1976, then ten months in 1977, while 1973 ran at plus 2.6 points. Across the full 1970-1979 decade the fed funds rate sat below inflation in only 45% of months, and the three-month Treasury bill in 67% (Eco3min calculation, FEDFUNDS and TB3MS against CPIAUCNS, FRED). Only at the 1979 to 1982 turn did the Federal Reserve, under Paul Volcker, push its policy rate to 19.1% in June 1981 (FEDFUNDS series, FRED), abruptly pulling real rates back into positive territory. The account of that turn and its effects belongs to how Volcker broke inflation. What matters here is that it came late, after a decade of negative real rates.
In 2022, the sequence was reversed. The Federal Reserve raised its policy rate from a 0 to 0.25 percent range in March to 5.25 to 5.5 percent by mid-2023, at the fastest pace since the Volcker era. Market real rates, measured by ten-year inflation-linked yields, moved from around minus 1 percent in 2021 into positive territory by late April 2022, closing the year at plus 1.6 percent. On the ex-post measure, the one that puts both episodes on the same footing, the real policy rate bottomed at minus 8.3 percent in March 2022, lower than anything the 1970s produced, then crossed back above zero during 2023. Where the 1970s left the real rate below zero in stretches across seven years, 2022 lifted it in under two years. Same inflation level, diametrically opposite real-rate path: it is from this gap that every reversal below follows.
The protections that switch sides
Four assets reputed to hedge inflation delivered opposite results from one episode to the other. They are what makes the case.
Gold: winner of the 1970s, disappointment in 2022
In the 1970s, gold had one of its strongest real decades: from 35 dollars an ounce, the official parity until the gold window closed in August 1971, to 675 dollars as a monthly average in January 1980, the month of the record fix near 850 dollars (World Bank Pink Sheet for monthly averages; LBMA for the fix). Across 1970-1979 alone the metal rose twelvefold in nominal terms and sixfold in real terms. The engine was not inflation as such, but the absence of opportunity cost: with real rates negative, holding a non-yielding asset cost nothing. In 2022, the same asset disappointed: despite 9.1 percent inflation in June, the ounce ended the year at 1,798 dollars against 1,790 twelve months earlier, up 0.4 percent in nominal terms but down 5.7 percent in real terms, because the rise in real rates restored the opportunity cost the previous decade had cancelled. The metal had not changed. The relative price of holding it had. The mechanism behind this dependence is detailed in the real rate behind gold.
Cash: loser of the 1970s, winner after 2022
The exact mirror of gold is interest-bearing cash. From 1974 to 1980, seven years running, credited rates stayed below inflation: holding cash meant losing purchasing power year after year, by as much as 3.4 points in 1975. The first four years of the decade had in fact paid a slightly positive real return. The sharpest point of the comparison lies elsewhere: cash lost more in real terms in 2021 and 2022, at 4.7 then 6.0 points, than in any single year of the 1970s. In 2023, once tightening was under way, short rates moved above inflation, and cash became a positive real-return holding again. The same vehicle was thus the big loser of one episode and a winner of the other, at comparable inflation, without any of its properties having changed. Only the sign of the gap between the short rate and inflation had flipped. Related coverage: which assets held up against inflation, and when.
Equities: a decade depressed, then a brief shock
Equities fell in real terms in both episodes, but the duration of the fall set them apart entirely. In the 1970s, the broad US indices ended the decade near their starting nominal level. With dividends reinvested, the US equity market gained 80 percent over 1970-1979 while prices rose 103 percent, a real loss of 11 percent spread across ten years (Kenneth French Data Library, total return). That depression lasted the whole regime: as long as real rates stayed low and inflation entrenched, multiple compression erased the growth in nominal earnings. In 2022, equities also fell, the broad US index posting its worst year since 2008, down 20.0 percent in total return against 4.4 percent for the next worst year of the period, under the rise in real rates that compressed multiples. Measured against inflation, that single year cost 25 percent in real terms, more than the entire 1970s decade. But the shock was brief: as soon as the regime stabilised in 2023, equities rebounded 27 percent. The divergence therefore is not about direction, but about persistence: a stagflationary regime of negative real rates keeps equities depressed for a decade, where a fast tightening produces a violent but short correction. It was the duration of the regime, not the inflation level, that set the duration of the pain.
Property: repriced higher in the 1970s, repriced down in 2022
Property completes the picture. In the 1970s, physical real estate repriced higher like most real assets, supported by negative real rates that kept the discount rate on its income low. In 2022, the rise in real rates worked the other way: the discount rate climbed, and the market value of real estate assets, listed property first, fell before rents even reacted. The same real asset protected in one regime and suffered in the other, because sensitivity to real rates dominates, on a market horizon, over the indexation of rents. The wider context: the cycle-aware view of investment selection.
What did not diverge
The case would be incomplete without the assets that behaved similarly in both episodes, because they pin down where the dividing line runs. Two cases deserve attention.
Long bonds suffered in both episodes, but for nested reasons. In the 1970s, rising nominal rates eroded the value of fixed coupons. In 2022, it was the rise in rates, nominal and real alike, that inflicted on long sovereign bonds one of their worst years in real terms since the series began, inflation-linked bonds included. The apparent similarity hides a nuance: it was not inflation that penalised bonds, but the rate rise accompanying it. When inflation rises without a rate rise, bonds suffer less. It is the monetary response, here again, that decides.
Commodities, for their part, rose in both cases, driven directly by the supply shock, energy in the 1970s, energy and food in 2022. Their behaviour depends on the shock itself more than on the real-rate path, which makes them one of the few assets whose response to cost-push inflation is relatively stable from one regime to the next. That stability confirms the rule by the exception: the protections that diverge are precisely those whose value depends on real rates, not on the price shock.
The lesson: the regime, not inflation
Set side by side, the two episodes establish a result the long-run average hides. At comparable nominal inflation, gold, cash and property delivered opposite verdicts, and equities diverged in the duration of their decline. The variable explaining each reversal is the same: the sign and path of real rates. The inflation level, identical to within a point, predicts none of the rankings. It is the direct empirical proof of the umbrella’s thesis, that there is no universal hedge.
The contrast reaches beyond the two dates. It invalidates reasoning by analogy, the most widespread among savers: “inflation is back, so let us replay what worked last time.” Last time was the 1970s, and their scoreboard held in 2022 only for the assets whose behaviour does not depend on real rates. For all the others, the analogy did not merely fail, it reversed. Two episodes are obviously not enough to state a law, but they are enough to refute a belief: that of a stable scoreboard of inflation protections, independent of the monetary regime.
The generalisable point is narrower and more durable than any single ranking. It is that the question savers ask, “what hedges inflation,” is missing a variable, and that the missing variable is observable: the path of real rates. An inflation met with tolerance and an inflation met with tightening are, for the purpose of protection, two different events that happen to share a name. The 1970s and 2022 are not a recipe for the next episode, because the next monetary response is not knowable in advance. They are something more useful than a recipe: a demonstration that the response, not the price level, is where the analytical effort belongs. Whoever internalises that will not be surprised the next time high inflation produces an unexpected scoreboard.
- Two episodes of high inflation almost twinned by level (above 12 percent in 1974, 9.1 percent in 2022) produced opposite winners.
- Gold, winner of the 1970s, disappointed in 2022; cash, loser of the 1970s, protected after 2022; property made the reverse journey.
- The single cause of these reversals is the real-rate path: negative for ten years in the 1970s, lifted in under a year in 2022.
- Bonds and commodities behaved similarly in both: what diverges is the protections whose value depends on real rates.
A comparison that extends
If two episodes with an identical nominal diagnosis rewarded opposite protections, then the useful question is no longer “which asset hedges inflation?” but “which real-rate regime accompanies this inflation?” The answer is read by crossing it with the macro cycle, which reading the cycle to adjust extends. And because a regime can shift mid-course, the same comparison leads to the risk of holding a protection beyond the regime that justified it, handled by when the backdrop changes. Two episodes do not make a law. They make a demonstration, and the demonstration holds as long as one reads the regime before the asset.
Last updated — 6 October 2026
Disclaimer – Financial and Legal Information: The analyses, commentary, and content published on eco3min.fr are provided for informational and educational purposes only. They do not constitute investment advice or a solicitation to buy or sell financial instruments. Past performance is not indicative of future results. All investment decisions involve risk and are the sole responsibility of the reader. Data, charts and calculated series are provided as is and may contain errors or lag behind their source: check any figure against the primary source cited before relying on it. Content describing laws, regulations or contracts reflects the law as of its publication date and does not constitute legal or tax advice; applying it to a specific situation requires a qualified legal or tax professional.
Read next
Full pillar →Protecting Savings From Inflation: What Has Worked, and in Which Regime
At nearly identical average inflation (~8%/yr), gold delivered a positive real return in the 1970s (negative real rates)…
Target-Date Funds vs Self-Directed Portfolios: The Mechanics of a Delegated Glide Path
A target-date fund is sold as a simple, set-and-forget win. It is first something narrower: a delegated glide…
What Guaranteed Savings Products Have Paid: Fixed Annuity and Stable Value Yields Through the Rate Cycle
US guaranteed savings products credit a rate that trails the bond market rather than tracking it. Through the…