
TIPS, OATi and Inflation-Linked Bonds: Understanding the Protection Mechanics
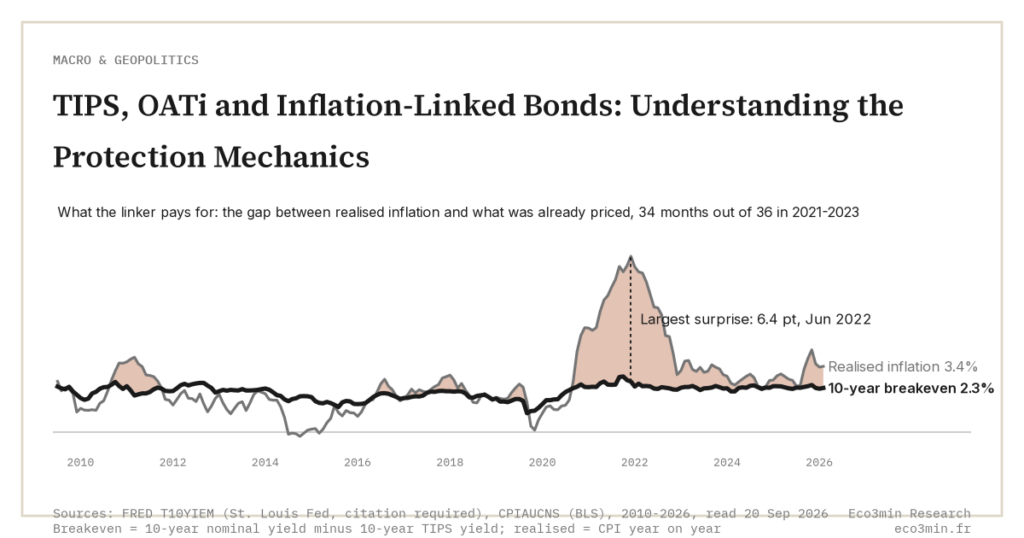
Inflation-linked bonds do not protect against inflation: they protect against the gap between realised inflation and what was already priced into nominal yields when you bought.
A linker pays a real coupon on a principal that adjusts to consumer prices. The nominal Treasury sitting next to it already embeds an inflation expectation called breakeven, and the contest between the two is decided by what inflation actually does after you trade.
Treating TIPS, OATi or Gilts indexed on RPI as a generic “inflation hedge” misses the entire point. The protection is conditional, the comparison is relative, and the mechanism rewards a very specific kind of surprise. This article isolates what these instruments do, what they do not, and how the academic literature has framed the trade-off since the launch of TIPS in January 1997. The point is put in perspective in our page on inflation-linked bonds and the limits of protection.
How a linker actually works
An inflation-linked bond (TIPS in the United States since 1997, OATi in France since 1998, OAT€i since 2001, Gilts indexed on RPI in the United Kingdom since 1981) pays a fixed real coupon on a principal that is reindexed periodically on a consumer price index. For TIPS, the index is non-seasonally-adjusted U.S. CPI-U, with a three-month lag. The coupon is fixed in real terms, but the cash payment grows with the indexed principal. At maturity, the holder receives the inflation-adjusted principal, with a deflation floor that guarantees the original face value is returned even if cumulative inflation is negative.
The structure has one analytical consequence that the marketing rarely states: the holder of a linker accepts a lower stated yield in exchange for transferring inflation risk to the issuer. That stated yield is a real yield. The nominal Treasury issued at the same maturity carries a higher yield because it embeds compensation for expected inflation plus a risk premium. The difference is not a bonus — it is the price of a service.
Breakeven inflation: the central concept
Pflueger and Viceira (2011, Journal of Finance) decomposed the nominal yield on a Treasury into three components: the real yield observable on the matched-maturity TIPS, expected inflation over the holding period, and an inflation risk premium that compensates investors for inflation uncertainty. Their estimates put the inflation risk premium between 14 and 70 basis points depending on the period, which means breakeven inflation is a biased estimate of expected inflation — slightly too high in normal times.
Breakeven inflation is the simple arithmetic difference between the nominal Treasury yield and the matched-maturity TIPS yield. It is the inflation rate that would make the two instruments deliver the same total return at maturity. If realised inflation lands above the breakeven, the linker wins; if below, the nominal wins. This is the core arbitrage and the only honest framing. A companion piece: Decomposing the 10-year nominal yield into real yield and inflation expectations.
In practice, the FRED 10-year breakeven series (T10YIE) has averaged around 2.1% since 2003, with notable excursions: it collapsed to roughly 0.04% during the late-2008 liquidity crisis, recovered to 2.5% by 2013, drifted below 1.5% during 2015-2016 oil-driven disinflation, and spiked to 3.0% in early 2022 before falling back below 2.5% by late 2024. Every time the curve has moved, the implicit message has been about expected inflation, not realised inflation. Breakeven inflation rates and how to read them formalises this signal in detail.
What the data say: TIPS vs nominal Treasuries since 2003
The empirical record over the full TIPS history is more nuanced than the marketing suggests. Roll (2004, Financial Analysts Journal) documented that ten-year TIPS underperformed nominal ten-year Treasuries between 1997 and 2003 because realised inflation came in below breakeven. This gets a fuller treatment in the framework on inflation regime mechanics. The relationship reversed during 2003-2008 and again during 2020-2022, when realised inflation overshot breakevens. Over rolling ten-year windows since 1997, the cumulative real return on TIPS has tracked the path of the ex-post real yield on a nominal investment with a comparable duration, sometimes ahead, sometimes behind, with no systematic outperformance for either side.
The 2022 episode is instructive. U.S. CPI peaked at 9.1% year-on-year in June 2022, well above any plausible breakeven that had prevailed in 2020-2021. TIPS holders captured the surprise: their indexed principal grew at the realised inflation rate while nominal Treasury holders were locked into the lower coupon set when expectations were still anchored. But TIPS prices themselves fell sharply that year, because real yields rose from negative territory to roughly 1.7% by year-end. The duration loss exceeded the indexation gain for many investors. The study Why bonds suffer first when inflation rises documents this duration mechanism across the bond complex.
Inflation surprise vs expected inflation: the asymmetry
The phrase “TIPS protect against inflation” is misleading because it implies absolute protection. The protection is differential: TIPS outperform nominal Treasuries only when realised inflation exceeds the breakeven priced when you bought. If inflation lands precisely on the breakeven, both instruments deliver the same real return. If inflation runs below the breakeven, the linker holder receives less than the nominal holder over the same horizon. Related discussion: our grid linking the logic of rising prices to a resilient holding.
This asymmetry has practical implications. A holder buying TIPS at a 2.5% breakeven in early 2022 captured the upside when inflation overshot. A holder buying TIPS at a 1.8% breakeven in mid-2020 also captured the upside, on a far larger margin. A holder buying at a 3.0% breakeven would have needed inflation to exceed 3.0%, which it did, but only briefly. The protection is therefore not against “inflation” but against the unanticipated component of inflation, exactly the framing the academic literature has used since Fisher (1930).
D’Amico, Kim and Wei (2018, Journal of Financial and Quantitative Analysis) estimated the TIPS liquidity premium — the additional yield TIPS investors demand because the market is thinner than the nominal Treasury market. Their term-structure decomposition put the average liquidity premium between 30 and 100 basis points over 1999-2013, with extreme spikes during the 2008-2009 crisis when TIPS yields decoupled violently from breakeven-implied levels. The practical consequence: published breakevens systematically overstate true expected inflation by the difference between the inflation risk premium (which raises breakevens) and the liquidity premium (which lowers them). The two roughly offset on average, but not in stress periods.
European linkers carry their own liquidity discount. OATi and OAT€i markets have averaged daily turnover an order of magnitude below their nominal OAT counterparts, and bid-ask spreads widen sharply in stress (March 2020, September-October 2022 UK gilt episode). The Bank of England’s analysis of the September 2022 LDI crisis showed RPI-linked Gilts taking the largest mark-to-market hits in the immediate sell-off, before the BoE’s intervention reversed the move. The mechanism is taken apart in our study of the 2022 UK gilt crisis.
What linkers do not do
A linker does not insulate the holder from real-yield moves. When real yields rise (as they did from roughly minus 1% to plus 1.7% during 2022, the largest real-yield shock since the TIPS market opened) the price of long-duration TIPS falls in proportion to duration. A 30-year TIPS with a duration of roughly 19 years lost more than 30% of price in 2022 even as inflation indexation worked in its favour. Real interest rates vs nominal and the real 2-year Treasury yield dataset trace the underlying real-rate moves that drove these losses.
A linker also does not protect against tax distortion. In the U.S., the inflation accrual on TIPS principal is taxable in the year it is credited even though the cash is paid only at maturity — the so-called phantom income problem. Holding TIPS in tax-advantaged accounts neutralises this; holding them in taxable accounts during high inflation years can produce a real after-tax return well below the stated real yield. The hidden tax on safety dataset documents how silently this erosion can run on supposedly “safe” instruments.
Finally, the choice of CPI matters. TIPS index on U.S. CPI-U, OATi on French CPI ex-tobacco, OAT€i on euro-area HICP ex-tobacco, RPI Gilts on UK RPI (which structurally diverges from CPI by 80-100 basis points). A linker only protects against the index it tracks. An investor whose consumption basket diverges from the reference index (non-resident, sector-specific, age-specific) receives partial protection at best.
Where this leaves the comparison
Linkers do one thing the nominal Treasury cannot: transfer inflation surprise risk from the holder to the issuer. They do this at a price set by the breakeven, modulated by inflation risk premium and liquidity premium. They do not eliminate duration risk, real-yield risk, tax inefficiency or basket-divergence risk. The literature since Fisher has framed this trade-off consistently; the marketing language has not. Inflation and savings situates linkers within the broader savings-vehicle complex, and inflation and the State explains why issuers price linkers to recover what their nominal debt loses to inflation surprise.
- The relevant comparison is always TIPS vs nominal Treasury at the same maturity, not TIPS vs inflation in absolute terms.
- Breakeven inflation is the price of the inflation-protection service; a linker outperforms the nominal only when realised inflation exceeds the breakeven priced at purchase. This mechanism fits within our anatomy of inflation cycles.
- Inflation risk premium (Pflueger-Viceira 2011) and liquidity premium (D’Amico-Kim-Wei 2018) push the published breakeven away from a clean expected-inflation reading.
- Duration risk on long linkers can dwarf indexation gains, as the 2022 cycle demonstrated empirically.
Linkers do not protect against inflation: they protect against the gap between realised inflation and the breakeven priced into nominal yields the day you traded.
For the broader analytical frame on inflation regimes and how inflation-linked instruments fit within them, see the complete inflation guide and the underlying inflation regimes pillar.
Last updated — 6 October 2026
Disclaimer – Financial and Legal Information: The analyses, commentary, and content published on eco3min.fr are provided for informational and educational purposes only. They do not constitute investment advice or a solicitation to buy or sell financial instruments. Past performance is not indicative of future results. All investment decisions involve risk and are the sole responsibility of the reader. Data, charts and calculated series are provided as is and may contain errors or lag behind their source: check any figure against the primary source cited before relying on it. Content describing laws, regulations or contracts reflects the law as of its publication date and does not constitute legal or tax advice; applying it to a specific situation requires a qualified legal or tax professional.
Read next
Full pillar →The Great Moderation (1990-2007): Why Inflation Disappeared
From the early 1990s to 2007, US output volatility fell by approximately 50%, inflation volatility by 70%, and…
Services vs Goods Inflation: The Great Post-2020 Divergence
The post-2020 services-versus-goods divergence: how a single inflation regime split into two sub-regimes operating on different timetables, and…
Shelter Inflation: Why Housing Dominates the CPI
Shelter inflation: why a single component representing roughly one-third of the U.S. CPI basket dominates the headline number,…