
Common mistakes about recessions
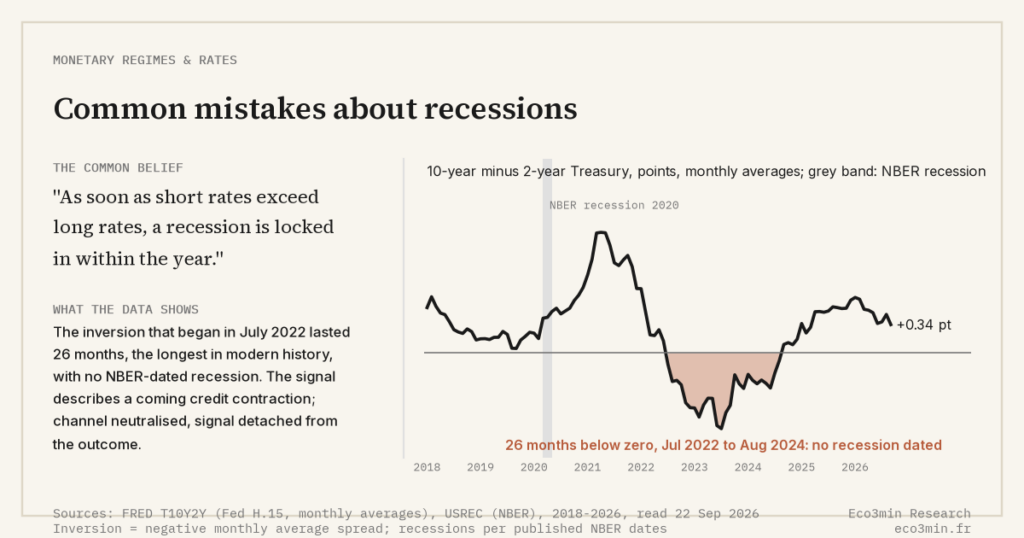
Most recession “rules” are conditional mechanisms, not prophecies. Across the 2022-2024 cycle, the most-watched signals — the longest yield-curve inversion in modern history, the Sahm rule, and a falling leading index — all pointed to a downturn the NBER never dated. This guide separates what recession indicators actually measure from what investors assume they predict, and links each correction to a full explanation.
In this guide
- Recession indicators reliably predict recessions
- If the Sahm rule triggers, a recession has started
- An inverted yield curve guarantees an imminent recession
- Credit spreads only confirm a recession after it begins
- Oil prices have nothing to do with recessions
- Bank lending standards are a backward-looking footnote
- A government agency declares a recession in real time
- You’ll know a recession has begun while it’s happening
- Aggressive rate hikes always end in recession
- Two negative GDP quarters means a recession
- Recessions are always triggered by an outside shock
- A weak recovery just means the next boom is delayed
- A leading index falling for months guarantees a recession
- The pattern behind these mistakes
- Practical observation
- Frequently asked questions
Why these mistakes persist
Recessions invite confident forecasting because the record looks clean in hindsight: nearly every US downturn since 1955 was preceded by an inverted yield curve, an oil shock, or tightening credit. The mistake is reading a backward-looking correlation as a forward-looking certainty: an indicator describes a mechanism that holds under specific conditions, and when those conditions change — as after 2021 — the same signals fire without the outcome. The errors below share one root: treating a probabilistic warning as a deterministic trigger. A related angle is set out in our reference on maturity positioning.
→ New to recessions? Macro-financial indicators
Recession indicators reliably predict recessions
The common belief: Leading indicators give a dependable, repeatable signal that a recession is coming.
What the data shows: Most indicators are calibrated on small samples — fewer than a dozen US recessions since 1960 — so a single miss materially changes their record. Across 2022-2024 the yield curve, the Sahm rule and the Conference Board’s leading index all warned, yet the NBER dated no recession through 2024. They measure pressure, not destiny.
→ Complete explanation: How accurate are recession indicators?
If the Sahm rule triggers, a recession has started
The common belief: When the unemployment rate’s three-month average rises 0.50 point above its twelve-month low, a recession is already underway.
What the data shows: The threshold held across every US recession since 1960, yet it also fired in November 1976 without a recession, and again in July 2024 — at 0.53 point — with no NBER-dated downturn following. Its creator, Claudia Sahm, calls it a historical pattern, not a rule of nature.
→ Detailed explanation: Is the Sahm rule a reliable recession indicator?
An inverted yield curve guarantees an imminent recession
The common belief: Once short rates exceed long rates, a recession is locked in within a year.
What the data shows: The curve inverted before all ten US recessions since 1955 (San Francisco Fed), with one false positive in the mid-1960s — a record strong enough to feel deterministic. The underlying series is published in our 2s10s spread data. But the 2s10s inversion that began in July 2022 became the longest in modern history and reversed in 2024 with no recession dated. Inversion signals a coming credit contraction; when that channel is neutralised, the signal detaches from the outcome. Contrary to the textbook framing, it is a conditional warning about credit, not a countdown.
→ In-depth explanation: Why does the yield curve invert before recessions?
Credit spreads only confirm a recession after it begins
The common belief: Corporate bond spreads are a coincident or lagging measure — useful for description, not prediction.
What the data shows: High-yield spreads tend to widen ahead of downturns as lenders reprice default risk, often before equities fully adjust. Noisier than the yield curve, they capture the funding-cost channel directly. In 2022 spreads widened, then tightened as the feared default wave did not arrive.
→ The full explanation: Do credit spreads predict recessions?
Oil prices have nothing to do with recessions
The common belief: Oil is one commodity among many and largely irrelevant to the business cycle.
What the data shows: James Hamilton’s NBER research documents that 10 of the 11 postwar US recessions before the pandemic were preceded by a sharp rise in oil prices, the sole exception being 1960, with a lag of about three quarters. The link is contributing, not mechanical — the 2003 increase brought no recession.
→ Full breakdown: Why do oil prices spike before recessions?
Bank lending standards are a backward-looking footnote
The common belief: Survey data on lending standards is too soft and slow to matter for forecasting.
What the data shows: The Fed’s Senior Loan Officer Opinion Survey captures the credit-supply channel before it reaches growth or employment. Tightening standards have preceded most postwar downturns, because restricted credit constrains investment and hiring with a lag — a directional signal, not a timing tool.
→ Fuller explanation: Do bank lending standards predict downturns?
A government agency declares a recession in real time
The common belief: An official body announces a recession as soon as GDP turns down.
What the data shows: In the US, recessions are dated by the NBER’s Business Cycle Dating Committee — a private academic group — which weighs production, employment and real income, not GDP alone, and works retrospectively. There is no real-time government declaration; it waits until the evidence is unambiguous.
→ Extended explanation: What is the NBER recession dating methodology?
You’ll know a recession has begun while it’s happening
The common belief: The start of a recession is obvious in real time.
What the data shows: Recessions are confirmed only after they begin, sometimes by a wide margin. The NBER dated the December 2007 peak in December 2008 — about a year later — and the February 2020 peak in June 2020, considered unusually fast. Much of a recession is often over before it is official.
→ The complete explanation: Why are recessions only confirmed after they start?
Aggressive rate hikes always end in recession
The common belief: Sustained monetary tightening inevitably produces a hard landing.
What the data shows: Most tightening cycles have ended in recession, but not all. The benchmark soft landing is 1994-1995, when the Fed roughly doubled the funds rate to 6% without a downturn; Powell has also cited 1965 and 1984. Entering 2023, about 85% of economists surveyed by the Financial Times expected a recession the NBER has not dated.
→ Full account: What is a soft landing and has it ever been achieved?
Two negative GDP quarters means a recession
The common belief: The definition of a recession is two consecutive quarters of falling real GDP.
What the data shows: That two-quarter rule is a journalistic shorthand, not the NBER’s definition. In the first half of 2022, US real GDP contracted for two straight quarters, yet no recession was dated because employment and real income kept rising. The technical rule and the official chronology can diverge.
→ Complete breakdown: How do technical recessions differ from NBER recessions?
Recessions are always triggered by an outside shock
The common belief: Downturns come from external events — an oil embargo, a pandemic, a war.
What the data shows: Hyman Minsky’s financial-instability hypothesis describes how stability itself breeds fragility: long calm periods encourage leverage, until a “Minsky moment” — coined for the 1998 Russia crisis — tips into forced selling. The 2008 crisis is the canonical example of an endogenous unwinding.
→ Complete explanation: What causes a Minsky moment?
A weak recovery just means the next boom is delayed
The common belief: Sluggish growth after a recession is temporary and self-correcting.
What the data shows: Secular stagnation — a concept from Alvin Hansen in 1938, revived by Larry Summers in 2013 — describes a persistent shortfall of demand and a low neutral rate that can keep growth and inflation subdued for years, not quarters. It reframes a weak recovery as structural, not a delay.
→ Detailed explanation: What is secular stagnation and why does it matter?
A leading index falling for months guarantees a recession
The common belief: When the Conference Board’s Leading Economic Index declines persistently, a recession must follow.
What the data shows: The LEI fell for more than fifteen consecutive months across 2022-2023 — historically abnormal — without a recession. It overweights goods and excludes services, over 70% of US output, so it can flag a goods slowdown while a services-led economy keeps growing. It signals direction, not magnitude.
→ In-depth explanation: Why does the Conference Board LEI give false signals?
The pattern behind these mistakes
The common thread is mistaking a conditional mechanism for an unconditional law: each reliable indicator encodes a transmission channel — credit, funding costs, labour, energy — that detaches once the channel goes quiet. In classic credit-driven cycles (1990, 2001, 2008), an inverted curve and tightening lending standards preceded recession because rising real rates choked credit. After 2021 that channel stayed open: real ten-year yields swung from roughly -1% in 2021 to around +2% by 2023, yet low fixed-rate debt was locked in, balance sheets were healthy, and residual fiscal support cushioned demand. The transition parameter was not the level of real rates but whether the credit channel transmitted them; when it does not, the most trusted signals fire without the outcome. Related analysis: Our overview of how central banks set policy and transmit it to markets.
A reliable recession indicator describes a mechanism, not a destiny — and mechanisms can be switched off.
→ Framework: Economic cycle: phases, signals and market implications
Practical observation
What the data suggests for framing your own analysis:
- Question to ask yourself: Is this indicator describing a transmission channel that is currently active, or am I treating a past correlation as a present law?
- Data to monitor: The breadth of agreement across signals — yield curve, credit spreads, lending standards, initial claims — rather than any single indicator in isolation.
- Historical parallel: In 1994-1995 the Fed roughly doubled the funds rate to 6% without triggering a recession — a reminder that tightening and recession are not synonymous.
- What the literature documents: Bauer and Mertens (San Francisco Fed, 2018) find the 10-year/3-month spread has the strongest historical recession-forecasting record among yield-curve measures, while noting the lead time is long and variable.
This is descriptive information to help you frame your own analysis. Eco3min does not provide investment advice.
Go deeper
📊 Full study: Yield-curve inversion, the credit channel and the recession mechanism
📁 Datasets: Sahm rule recession indicator · Yield-curve spread (10Y-3M)
Related guides
Frequently asked questions
Is the yield curve still a reliable recession indicator after 2022-2024?
The curve’s record remains strong — inversion preceded all ten US recessions since 1955 — but the 2022-2024 episode showed its limits: the longest inversion in modern history produced no dated recession. The signal works through the credit channel, so when that channel is muted by fixed-rate debt and healthy balance sheets, an inversion can persist without a downturn. It informs about elevated risk rather than precise timing, and is most useful alongside credit spreads and lending standards.
Why did so many trusted recession indicators fail in 2022-2024?
They did not so much fail as signal a credit contraction that was short-circuited. The yield curve, the Sahm rule and the leading index all proxy one mechanism — tightening financial conditions feeding into credit, hiring and spending. After 2021 that mechanism was blocked: low fixed-rate debt was locked in, balance sheets were strong, and fiscal support lingered, so higher real rates did not become a credit crunch. The pressure was real but did not transmit, which is why a rare soft landing emerged instead.
How does a technical recession differ from an official one?
A technical recession refers to the informal rule of two consecutive quarters of negative GDP. The official US chronology comes from the NBER, which weighs employment, real income and production — not GDP alone — and dates turning points retrospectively. The two can diverge: in the first half of 2022 GDP fell for two quarters while the labour market expanded, so no NBER recession was dated. The technical rule is a quick heuristic; the official definition is broader and slower.
Last updated — 22 September 2026
Disclaimer – Financial Information: The analyses, commentary, and content published on eco3min.fr are provided for informational and educational purposes only. They do not constitute investment advice or a solicitation to buy or sell financial instruments. Past performance is not indicative of future results. All investment decisions involve risk and are the sole responsibility of the reader.
Read next
Full pillar →Common mistakes about liquidity
Most liquidity mistakes share one root: treating liquidity as a single stock of "available money" rather than a…
Common mistakes about real estate
Most mistakes about real estate come from treating it as a price story when it is first an…
Common mistakes about commodities and gold
This guide corrects eight persistent misconceptions about commodities and gold. The common thread: commodities are treated as a…