
Every Oil Shock Since 1973: Size, Trigger, and What US Inflation Did Next
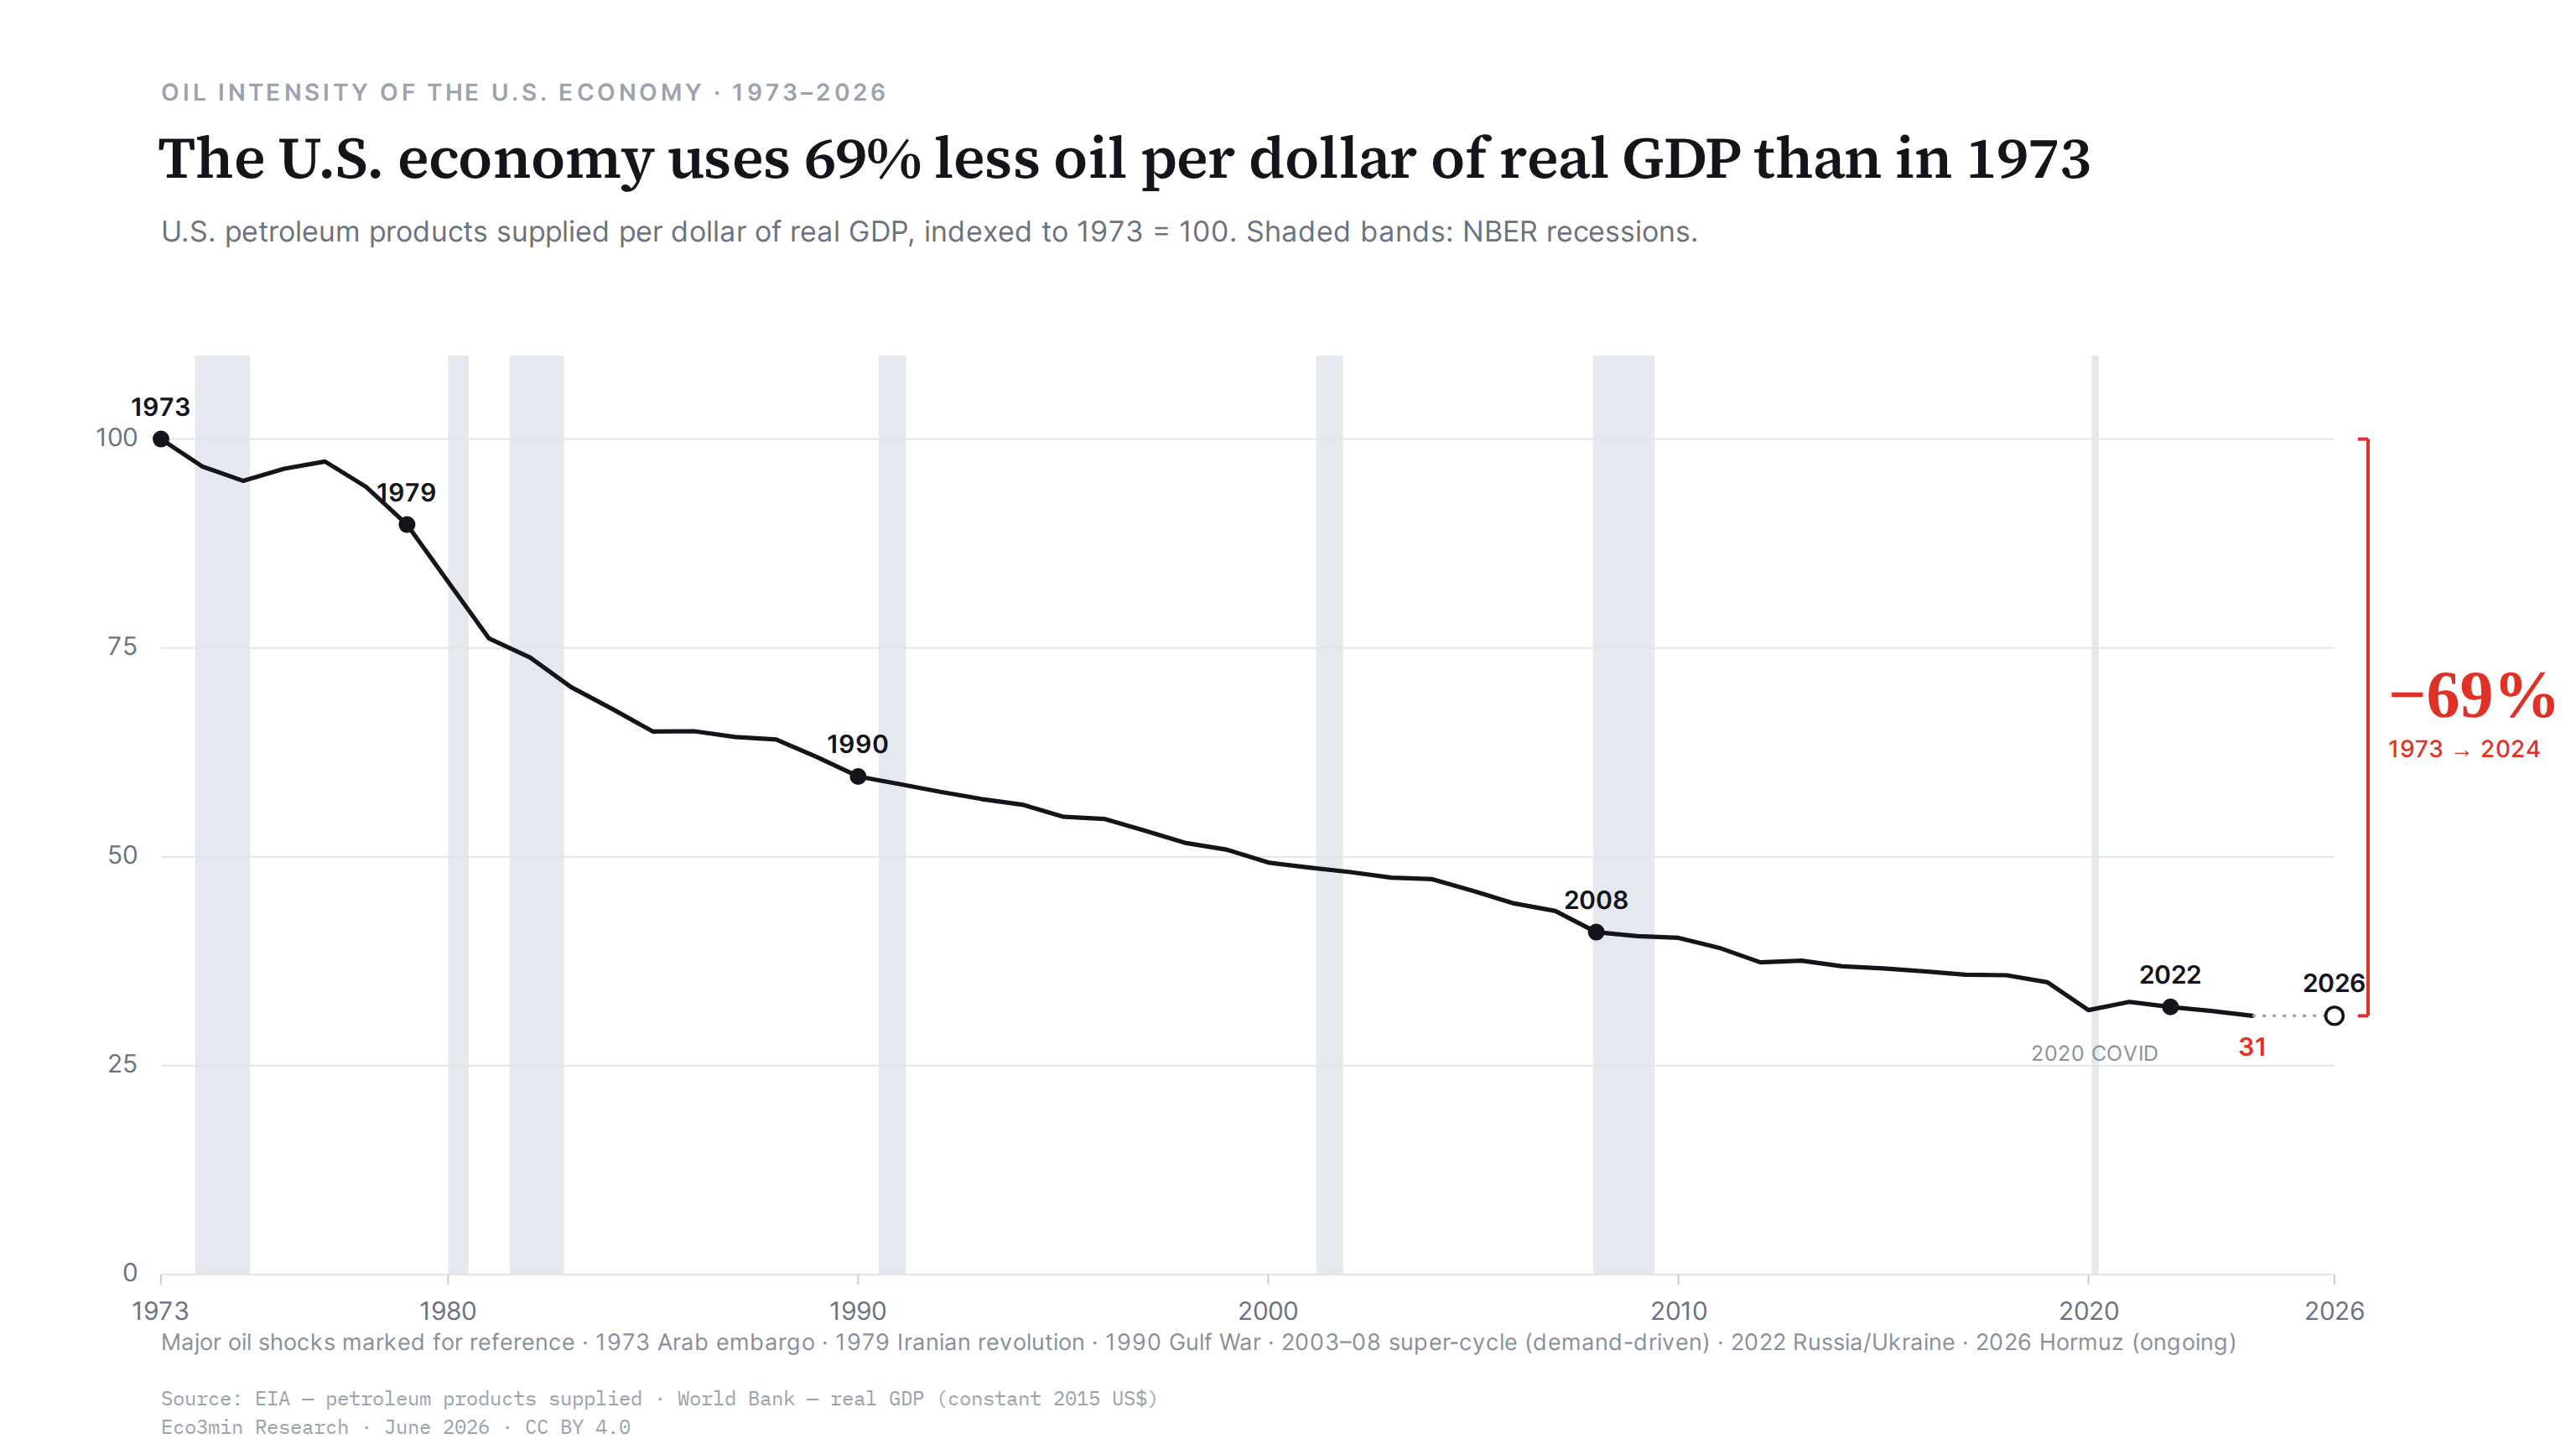
The US economy uses 69% less oil per dollar of real GDP than in 1973 — so each oil shock since has struck a less oil-dependent economy than the one before it.
- Oil intensity fell from about 1,068 to 331 barrels of petroleum per million dollars of real GDP between 1973 and 2024 (EIA; World Bank).
- All six major oil shocks since 1973 were followed by a rise in US CPI inflation — but the size of that rise tracked the whole macro regime, not oil dependence alone.
- The 2022 shock produced the largest inflation jump of the series (+7.7 points) on its least oil-intensive economy, which is why the simple story does not hold on its own.
Oil & inflation · 1973–2026
The 1970s left a durable lesson in both economics and public memory: an oil shock means inflation. The 1973 Arab embargo and the 1979 Iranian revolution each preceded double-digit US consumer-price inflation, and the association has shaped how every subsequent oil spike is read. With crude rising again in 2026 amid tension over the Strait of Hormuz, the reflex is to expect a rerun of that decade.
That reflex rests on a reasonable prior, but two facts complicate it. The US economy now burns far less oil per unit of output than it did then, and the historical record shows that the inflation that follows an oil shock has never depended on oil alone. This page sets out every major US oil shock since 1973, its size in real terms, the state of the economy it struck, and the inflation that followed — and is explicit about what that record does and does not establish.
| Oil shock | Real crude price rise (peak vs pre-shock trough) |
Oil intensity at onset (pre-shock baseline, 1973=100) |
US CPI inflation (onset → 24-month peak) |
Main concurrent inflation drivers | Associated US recession (NBER) |
|---|---|---|---|---|---|
| 1973–74 Arab embargo |
+108% | 100 | 7.4% → 12.3% (+5.0 pts) |
Bretton Woods collapse, broad wage indexation, food-price spike | Yes — 1973–75 |
| 1978–80 Iranian revolution |
+126% | 94 | 8.9% → 14.8% (+5.8 pts) |
Entrenched wage-price spiral, second supply cut (Iran–Iraq war) | Yes — 1980 & 1981–82 |
| 1990 Gulf War |
+113% | 62 | 4.7% → 6.3% (+1.6 pts) |
Brief, fully reversed within months; pre-existing slowdown | Yes — 1990–91 |
| 2003–08 super-cycle |
+527% (2001–08) |
44 | 1.6% → 3.0% (+1.5 pts) |
Demand-driven (China-led growth), not a supply cut; final 2007–08 leg +134% | Yes — 2007–09 |
| 2021–22 Russia/Ukraine |
+97% | 33 | 1.4% → 9.1% (+7.7 pts) |
Post-COVID supply chains, fiscal stimulus, reopening demand — oil one input among many | No |
| 2026 Hormuz (ongoing) |
+62% (prov.) |
31* | incomplete | Conflict-driven Strait of Hormuz closure; IEA: largest supply disruption on record; US inflation drivers not yet separable | — |
Real crude = EIA Refiner Acquisition Cost (composite), deflated by US CPI-U, measured peak-over-trough in event-bounded windows. Oil intensity = petroleum products supplied per dollar of real GDP, measured at the pre-shock baseline year. CPI = change in 12-month CPI-U inflation from onset to its highest point within the following 24 months — co-movement, not the share attributable to oil. * 2026 intensity uses the 2024 level (latest GDP data).
The reading the 1970s left behind
The standard view is not a caricature; it is grounded in real events. In 1973–74 the embargo by the Organization of Arab Petroleum Exporting Countries more than doubled the real price US refiners paid for crude, and headline CPI inflation rose from about 7% to above 12% within two years. The 1979 Iranian revolution, followed by the Iran–Iraq war, did it again: a further doubling in real terms, and inflation peaking near 15% in 1980 (BLS, CPI-U). Both shocks were followed by recessions dated by the National Bureau of Economic Research. For context: the commodity basket’s inflation signal.
From that experience came a simple causal chain that still anchors expectations: a supply disruption raises the oil price, the higher price passes through the economy, and inflation follows. When the Strait of Hormuz is disrupted and crude spikes — as in 2026, after conflict in the Middle East closed the strait to much of its traffic — that chain is the first thing most observers reach for.
What changed — and why it is not only the oil
The first complication is structural. Between 1973 and 2024, US petroleum products supplied per dollar of real GDP fell by 69% (EIA petroleum data; World Bank real GDP). Output roughly quadrupled in real terms while petroleum consumption rose less than a fifth, so the economy now extracts far more activity from each barrel. The decline is close to monotonic: the index never returns above its 1973 level, and each successive shock landed on a less oil-intensive economy — from an index of 100 in 1973 to roughly 31 by 2024. Falling intensity of that kind is one face of the economy’s long shift in energy use, a thread running through the commodity regimes framework on physical constraints and the energy transition.
The intuitive conclusion — less oil per dollar, so less inflation from an oil shock — is where the simple story overreaches. The decline in oil intensity is one channel, and it is the only one that can be cleanly charted, but it is not established as the main one. The reference study on this question, Blanchard and Galí (2007), attributes the smaller macroeconomic effect of oil shocks since the 1970s to a combination of forces: the falling share of oil, more flexible labor markets and the end of automatic wage indexation that once turned an oil spike into a wage-price spiral, better-anchored inflation expectations and greater monetary-policy credibility, and the absence of the other adverse shocks that compounded the 1970s. Related dataset: the US on-highway ULSD retail price dataset.
The weighting matters for how this record should be read. The literature generally treats the wage-setting and expectations channels as carrying at least as much of the change as the fall in oil intensity. In other words, the transmission from oil to inflation has weakened, but through several channels operating together — not chiefly because the economy burns less oil. This page reports that division of weight; it does not attempt to decompose the channels itself, which a registry of episodes cannot do.
The clean story is itself too clean
The strongest evidence against a mechanical “less oil, less inflation” rule comes from the most recent completed shock. In 2021–22 the real crude price rose about 97%, and CPI inflation jumped from 1.4% to 9.1% (BLS) — the largest inflation move of the entire series — on the least oil-intensive economy in it. Oil was one input; the surge was driven mainly by post-pandemic supply-chain disruption, large fiscal transfers, and reopening demand. Attributing that 7.7-point rise to the oil shock would conflate distinct forces, and it is the first objection a careful reader raises.
Two further qualifications follow. The 2003–08 episode was not a supply shock at all: the real crude price rose more than fivefold, but the driver was China-led global demand against tight supply, with the sharp final leg of about +134% in 2007–08. A price rise pulled by growth is a different event from a price rise forced by a supply cut, and the inflation that accompanies each need not behave the same way. And the sample is small. Six episodes, spread across price controls, the Volcker disinflation, the Great Moderation, and the post-pandemic period, cannot support a per-shock “pass-through multiplier”; the monetary regime alone differs so much across them that any single coefficient would be an artifact.
The clean story — less oil, so less inflation — is too clean: the largest inflation jump of the era struck the least oil-dependent economy in the series.
What the record supports is narrower and more durable than the headline. Directionally, every major oil shock since 1973 was followed by higher US inflation; structurally, each struck an economy less dependent on oil than the last. Neither statement implies that the next shock will be mild. They describe a changed economy and a consistent direction of travel, not a law of proportionality.
What counts as an oil shock — and what this does not prove
Whether a given price move should be called an “oil shock” is a classification choice, not a fact, and the choice changes the count. The criterion used here is explicit: a named supply or geopolitical disruption that produced a rise in the real crude price, with the size measured peak-over-trough in a window bounded by the event. If a reader applies a different definition and reaches a different set of episodes, that disagreement is about the definition, not the underlying data.
A purely mechanical rule makes the fragility visible. Defining a shock as a real crude rise of at least a fixed threshold within 24 months returns six episodes at a 40–50% threshold — but it misses the 1973 embargo (the monthly refiner-cost series begins in 1974), misses the 1979 shock (the price-controlled plateau of the late 1970s breaks the trough-to-peak logic), and misses 2022 (the April 2020 pandemic trough makes the run-up exceed 24 months). It also admits two episodes that are not supply shocks at all — the 1986–87 and 1998–2000 rebounds, which are recoveries from price collapses. Raising the threshold to 75% leaves four episodes; to 100%, three. No single mechanical rule reproduces the historically recognized set, which is why the episodes here are identified by event and only their magnitudes are measured from data. Worth reading alongside: our breakdown of how commodities signal inflation and shifting macro regimes.
The 2026 disruption, in this frame
The most recent entry is also the largest in physical terms. After conflict in the Middle East, the Strait of Hormuz — the chokepoint for roughly a fifth of world oil flows — was closed to much of its traffic from early March 2026. The World Bank’s April 2026 Commodity Markets Outlook recorded a rise in the Brent crude price of about 65% by the end of March, its largest monthly increase on record, as global oil supply fell by roughly 10 million barrels a day; the International Energy Agency described the episode as the largest supply disruption in the history of the oil market. By late June 2026 the strait was operating under a partial, quota-managed reopening and prices had eased from their March peak toward $80, with the situation unresolved. The registry above measures the real refiner-cost price rise (about +62% through April), a smaller figure than the Brent spike because it is a lagged monthly average; the description “largest in history” refers to the volume of supply withdrawn, not the percentage price move, which from a high starting base is smaller than several earlier shocks. A related compilation: the pattern of repeat inflation waves.
This is where the record becomes a frame rather than a forecast, and where it cuts both ways. The largest physical oil disruption on record is reaching the least oil-intensive US economy of the past half-century: the same nominal barrel now buys far less of the economy’s output than it did in 1973. A related compilation: US downturns since 1948 by severity. On the historical pattern, the inflation that follows will again depend on the whole regime — wage-setting, the anchoring of expectations, the monetary stance, and whether other shocks compound it — rather than on oil dependence alone. US CPI inflation had risen to about 4.2% by May 2026 (BLS), well below the double-digit readings of the 1970s, but the episode is incomplete and its drivers are not yet separable. The 1970s comparison is therefore incomplete in both directions: the economy is structurally far less exposed to oil, yet the disruption it faces is, by the IEA’s account, without modern precedent.
Oil intensity, 1973–2026 — explore the series
Methodology and sources
Oil consumption is US petroleum products supplied (EIA, Monthly Energy Review, Table 3.1), the standard measure of domestic petroleum use. As reported in the EIA petroleum supply data. Real GDP is from the World Bank (constant 2015 US dollars). The crude price is the EIA Refiner Acquisition Cost, composite — the average price US refiners actually paid, which is a better measure of what the economy bore under the two-tier price controls of the 1970s than spot West Texas Intermediate — deflated to real terms with US CPI-U (BLS, series CUUR0000SA0). Recession dates are from the NBER.
Oil intensity is petroleum products supplied divided by real GDP, indexed to 1973 = 100. For each episode it is measured at the pre-shock baseline year — the year before onset — because oil consumption itself falls when prices spike, so intensity measured during a shock would be mechanically depressed by the shock rather than by the structural trend. The chart marks each shock at its event year on the continuous series, so its position differs slightly from the baseline-year figure in the table; both are drawn from the same series.
Episodes are identified by event and their magnitudes measured peak-over-trough within event-bounded windows; the threshold rule and its sensitivity are set out above. The inflation column reports the change in 12-month CPI-U inflation from onset to its peak within the following 24 months. It is a measure of co-movement, not an estimate of the share of inflation caused by oil; the “concurrent drivers” column flags the episodes — 2022 above all — where other forces dominated. Intensity data run through 2024, the latest year with World Bank GDP; the 2026 marker uses the 2024 intensity level as a proxy and is labelled accordingly. All figures are reproducible from the CSV.
Frequently asked questions
Does an oil shock always cause inflation in the US?
Each of the six major oil shocks since 1973 was followed by a rise in US CPI inflation, but the size varied widely and reflected the whole macro regime rather than oil alone. The 1970s shocks preceded double-digit inflation; the 1990 and 2003–08 episodes added little more than a point to the inflation rate. The 2022 surge was large but driven mainly by non-oil forces.
How much less oil-dependent is the US economy than in the 1970s?
The US consumed about 69% less petroleum per dollar of real GDP in 2024 than in 1973 (EIA petroleum data; World Bank real GDP), falling from roughly 1,068 to 331 barrels per million dollars of output. Real GDP roughly quadrupled while petroleum use rose less than a fifth.
Why did 1970s oil shocks produce more inflation than recent ones?
The reference study, Blanchard and Galí (2007), points to a combination of forces rather than any single one: a falling share of oil, the end of automatic wage indexation and more flexible labor markets, better-anchored inflation expectations and monetary credibility, and the absence of concurrent shocks. The literature generally weights the wage and expectations channels at least as heavily as the decline in oil intensity.
Was the 2008 oil price spike a supply shock?
Largely not. The 2003–08 run-up was driven mainly by China-led global demand against tight supply, a different mechanism from the supply disruptions of 1973 and 1979. A price rise pulled by growth is not the same event as one forced by a supply cut, which is one reason its inflation aftermath was milder despite a far larger price increase. See also the tally of US refining capacity withdrawn since 2020.
What counts as an “oil shock” in this record?
A named supply or geopolitical disruption that produced a rise in the real crude price, with the magnitude measured peak-over-trough in a window bounded by the event. A purely mechanical threshold rule does not reproduce the historically recognized set — it misses 1973, 1979, and 2022 and admits price-collapse rebounds — so the episodes are identified by event and only their sizes are measured from data. The threshold sensitivity is reported in the methodology.
Related research
For other long-horizon records built the same way, see Eco3min’s history of yield-curve inversions and the recessions that followed and its dataset on the US dollar across global crises since 1973.
Sources: EIA (petroleum products supplied; refiner acquisition cost) · BLS (CPI-U) · World Bank (real GDP; Commodity Markets Outlook, April 2026, for the 2026 disruption) · IEA (2026 supply disruption) · NBER (recession dates) · Blanchard & Galí (2007). Data and method: see CSV (CC BY 4.0). Eco3min Research, June 2026.
Last updated — 15 September 2026
Disclaimer – Financial Information: The analyses, commentary, and content published on eco3min.fr are provided for informational and educational purposes only. They do not constitute investment advice or a solicitation to buy or sell financial instruments. Past performance is not indicative of future results. All investment decisions involve risk and are the sole responsibility of the reader.