
What Commodity Prices Actually Forecast: The Headline-Core Inflation Gap, Not Core Inflation (1992–2026)
Since 1992, commodity prices have tracked the gap between U.S. headline and core inflation with a 0.86 correlation — but barely moved with core inflation itself, at 0.15.
A 34-year decomposition of what commodity prices actually forecast in inflation — and what they are blind to.
Commodity prices are widely used as an inflation gauge. This page measures, across 400 monthly observations from 1993 to 2026, what the year-over-year change in a broad commodity basket actually co-moves with. It co-moves strongly with headline CPI inflation (correlation 0.66) and almost perfectly with the gap between headline and core inflation (0.86), but only weakly with core inflation itself (0.15). The dataset documents this decomposition and provides the headline-minus-core inflation gap as a downloadable series, with the IMF commodity basket and both CPI measures aligned monthly.
Since 1992, the year-over-year change in commodity prices has tracked the gap between U.S. headline and core inflation with a correlation of 0.86, while its correlation with core inflation — the persistent component the Federal Reserve targets — was just 0.15. Commodities signal the supply-driven wedge in inflation, not its underlying trend. Note: this dataset measures co-movement of inflation measures, not causation, and the relationship is partly mechanical because food and energy are components of headline CPI (see Methodology and Limitations).
Commodity basket, YoY
Headline CPI, YoY
Core CPI, YoY
Headline − core gap
- Since 1992, the year-over-year change in commodity prices has tracked the gap between U.S. headline and core inflation with a 0.86 correlation, but moved with core inflation at just 0.15.
- In variance terms, commodity moves co-vary with roughly three-quarters of the headline-core gap (R² 0.74) and about two percent of core inflation (R² 0.02). Commodities are a signal about the supply-driven wedge, not the trend.
- The relationship is monotonic: across 400 months, the median gap rises from −1.63 percentage points when commodities are falling more than 20% to +1.61 points when they are rising more than 40%. In the highest band the gap is positive in 100% of months; in the deepest contraction it is negative in 100% of months.
- The 2021–2023 cycle shows both the signal and its limit: the gap widened to +3.14 points in June 2022 with commodities up 44% year-over-year, then flipped to −1.86 points by June 2023 as commodities fell 33.5% — while core inflation barely moved, from 5.9% to 4.8%.
- As of May 2026, commodities are up 34.4% year-over-year and the gap stands at +1.4 points — back in supply-push territory. Core inflation, at 2.9%, sits where commodities say nothing about it.
- The dataset spans 400 monthly observations (1993–2026), aligning the IMF Primary Commodity Price Index with U.S. headline and core CPI, and publishes the headline-minus-core inflation gap as a derived series.
413 observations · Monthly · 1992–2026 · CC BY 4.0 · Methodology · Cite this dataset
Commodity YoY vs headline-core gap
Commodity YoY vs headline CPI
Commodity YoY vs core CPI
Gap range, pp (Jun 2022 / Jul 2009)
Commodity YoY range (Oct 2021 / Apr 2009)
Monthly observations (1993–2026)
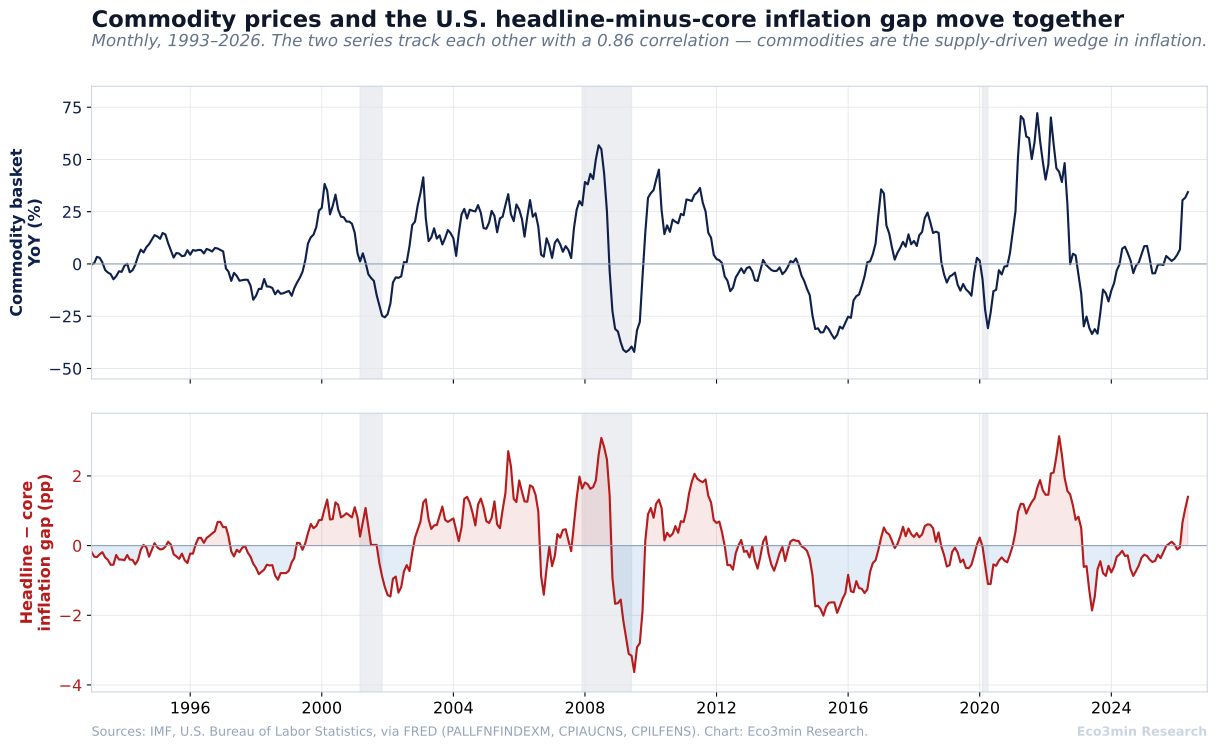
Chart: Commodity Prices and the U.S. Headline-Core Inflation Gap
Commodity prices and the headline-minus-core inflation gap move together
Monthly, 1993–2026. The two series track each other with a 0.86 correlation — commodities are the supply-driven wedge in inflation.
When commodity prices accelerate, headline inflation rises above core; when they fall, headline drops below core. The gap between the two inflation measures is, in effect, the commodity-price cycle translated into percentage points.
Sources: IMF, U.S. Bureau of Labor Statistics, via FRED (PALLFNFINDEXM, CPIAUCNS, CPILFENS). Chart: Eco3min Research.
How to Read This Chart
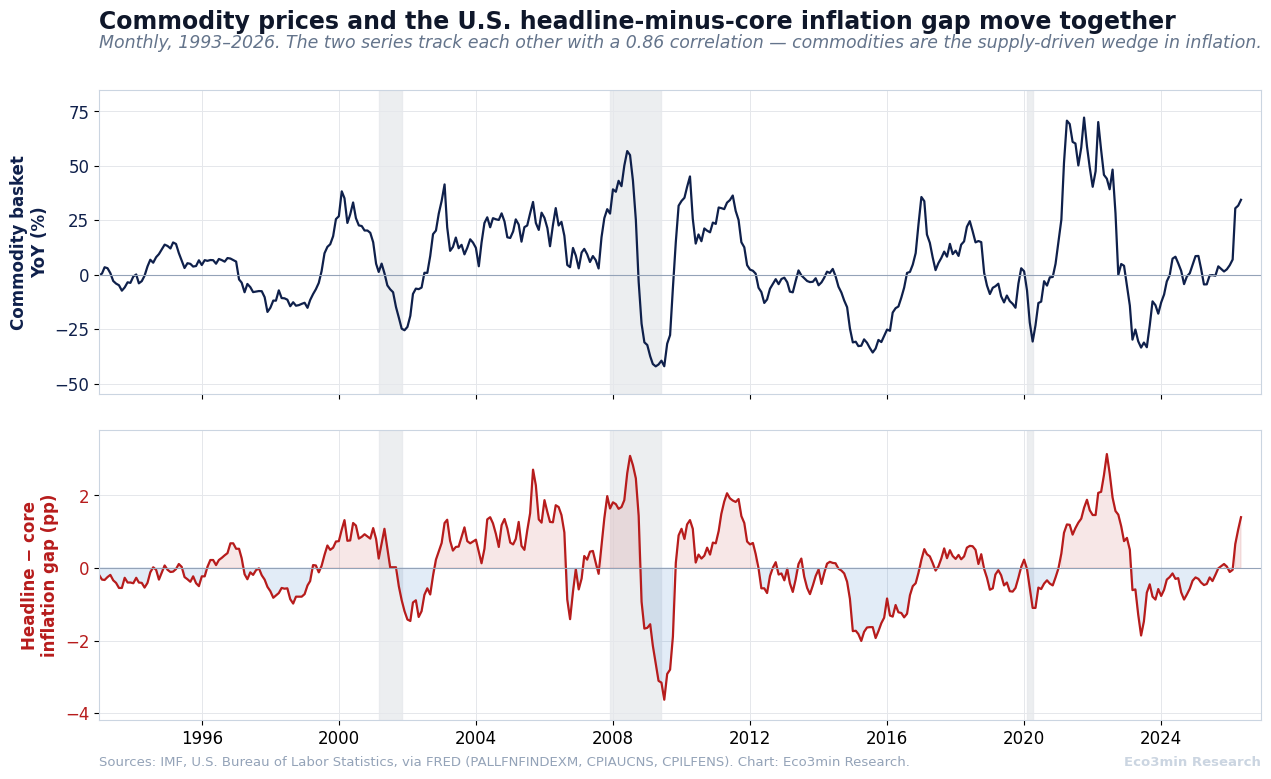
The top panel is the year-over-year change in the IMF Primary Commodity Price Index, a broad basket spanning energy, metals, and agricultural goods. It is volatile by construction, swinging between deep contractions and surges of more than 70%. The bottom panel is the headline-minus-core inflation gap: U.S. headline CPI inflation minus core CPI inflation, expressed in percentage points. A positive value means food and energy are pushing headline inflation above the underlying core rate; a negative value means they are dragging it below.
The point of the chart is the shared shape. Every major commodity peak — 2008, 2011, the 2021–2022 surge — lines up with a peak in the inflation gap, and every commodity collapse — 2009, 2015, 2023 — lines up with the gap turning negative. The two panels are deliberately kept on separate axes rather than overlaid, because the series have very different amplitudes; plotting them on a shared scale would either flatten the gap or exaggerate it. For the underlying inflation series, see our U.S. inflation history dataset and core CPI dataset.
What Commodities Actually Track
The dominant intuition is that commodity prices are an inflation signal in the general sense: when raw materials get more expensive, inflation is coming, and a basket of commodities serves as an early read on where the consumer price index is heading. On that view, commodities are a forecast of inflation itself.
The data refines that picture into something narrower and more specific. Over 400 months from 1993 to 2026, the year-over-year change in the commodity basket correlates with headline CPI inflation at 0.66. But its correlation with core CPI inflation — the measure that strips out food and energy — is only 0.15. And its correlation with the difference between the two, the headline-minus-core gap, is 0.86. Commodities are not tracking inflation in general. They are tracking the part of headline inflation that core inflation deliberately excludes.
This is visible in the simplest possible cut of the data. When commodities are rising year-over-year, the inflation gap is positive in 77% of months; when they are falling, it is negative in 90% of months. The relationship holds across the entire record, not just the recent surge.
Mechanical overlap, not pure prediction. Food and energy are themselves components of the headline CPI basket — together they account for roughly a fifth of it. Because commodities feed directly into the food and energy lines of headline CPI, part of the 0.86 correlation with the gap is accounting overlap rather than independent forecasting. The honest reading is that commodities are the fastest-moving prices inside headline CPI, so they turn first — not that they predict an inflation process they sit outside of.
What this dataset does not measure. It does not measure core inflation, which is what monetary policy primarily targets. Commodities co-move with only about two percent of the variance in core CPI (correlation 0.15). The persistent, services-and-shelter-driven inflation of 2022–2024 stayed largely outside commodities’ reach: core CPI was still running at 4.8% in mid-2023 even as commodities fell more than 30% year-over-year. Any reading of this dataset as a forecast of where inflation will settle is a misreading of what commodities capture. For the underlying core series, see our core CPI dataset.
Commodities do not forecast inflation. They forecast the supply-driven gap between headline and core inflation — co-moving with roughly three-quarters of its variance and only about two percent of core inflation’s.
Headline Versus Core: The Blind Spot
Core inflation exists precisely to remove the components that commodities drive. The concept dates to Robert Gordon’s 1975 work on supply shocks, which made the case for looking through volatile food and energy prices to the underlying trend. Decades of central-bank practice followed: the Federal Reserve’s preferred gauge is core, not headline, because food and energy are noisy and largely outside the reach of interest rates.
That institutional choice is exactly why commodities and core inflation diverge so sharply in the data. The three correlations stack in a clean order: commodities to the headline-core gap, 0.86; commodities to headline inflation, 0.66; commodities to core inflation, 0.15. In variance terms (the squared correlation), commodity moves co-vary with about three-quarters of the gap, just under half of headline, and roughly two percent of core. The closer a measure gets to the underlying inflation trend, the less commodities have to say about it. What commodities do speak to is the supply side — physical constraints, energy, geopolitics — the register of the commodity regimes overview.
Correlation of Commodity YoY With Each Inflation Measure (1993–2026)
| Inflation measure | Correlation | R² (variance share) | What it captures |
|---|---|---|---|
| Headline − core gap | 0.86 | 0.74 | The supply-driven wedge |
| Headline CPI | 0.66 | 0.44 | Trend plus food/energy |
| Core CPI | 0.15 | 0.02 | The underlying trend |
A legitimate analytical qualification runs in two directions. First, as noted above, part of the headline relationship is mechanical: food and energy are line items in headline CPI, so commodities partly correlate with headline by construction. The gap correlation isolates this — the gap is the food-and-energy contribution, more or less, which is why the relationship there is strongest. Second, and more important, commodities are blind to demand- and services-driven inflation. When the inflationary impulse comes from wages, rents, or shelter rather than raw materials, commodities carry no signal at all. Core inflation captured the persistence of 2022–2024; commodities did not. Both points narrow the claim rather than overturn it: commodities are a supply-shock instrument, useful for one component of inflation and silent on the rest. More context: Our deep dive into how commodities signal inflation and shifting macro regimes.
The ordering is the result: 0.86 on the gap, 0.66 on headline, 0.15 on core. Commodities are most informative about exactly the component that core inflation is designed to remove.
For how oil specifically passes through to consumer prices, see our study on WTI shocks and existing inflation; for the relationship between headline and core directly, see core CPI versus headline CPI.
The 2022 Rollover: When the Signal Goes Quiet
The 2021–2023 cycle is the clearest single demonstration of both what commodities signal and where the signal stops. It is worth following month by month, because the two halves tell opposite stories.
On the way up, commodities led. By February 2021 the basket was already rising 25% year-over-year while headline CPI was still running at 1.7% — the period when the prevailing view was that inflation would be transitory. The commodity basket’s year-over-year change peaked in October 2021 at 72.2%. The headline-core gap kept widening after that, reaching its all-time high of +3.14 percentage points in June 2022, when headline CPI hit 9.1% against core of 5.9%.
Then commodities rolled over, and the signal inverted. By June 2023 the basket was down 33.5% year-over-year. The gap flipped to −1.86 points — headline inflation of 3.0% had fallen below core inflation of 4.8%. Commodities had gone from adding roughly three percentage points to headline inflation to subtracting nearly two. But core inflation barely moved over that entire span, easing only from 5.9% to 4.8%. The persistent part of inflation — driven by shelter and services — was almost untouched by the commodity reversal that dominated the headline number.
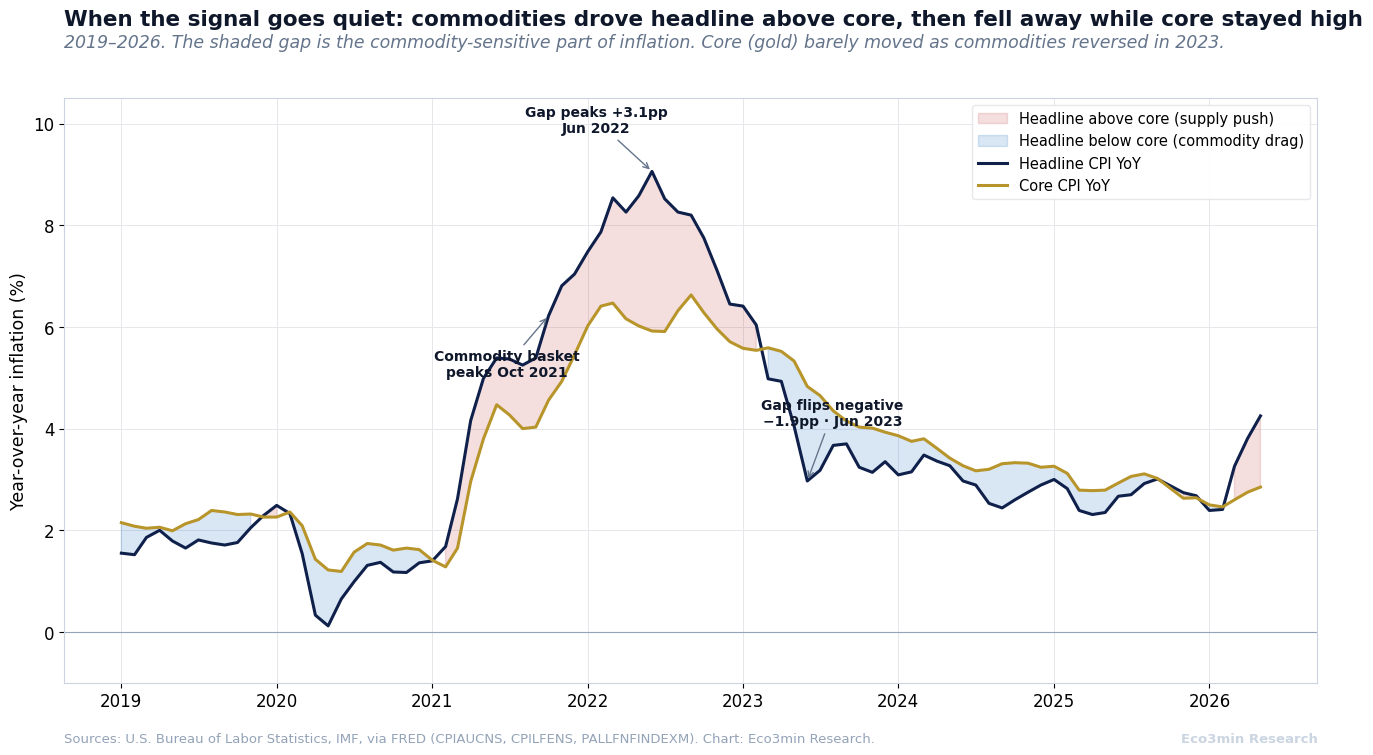
When the signal goes quiet: commodities drove headline above core, then fell away
2019–2026. The shaded gap is the commodity-sensitive part of inflation. Core (gold) barely moved as commodities reversed in 2023.
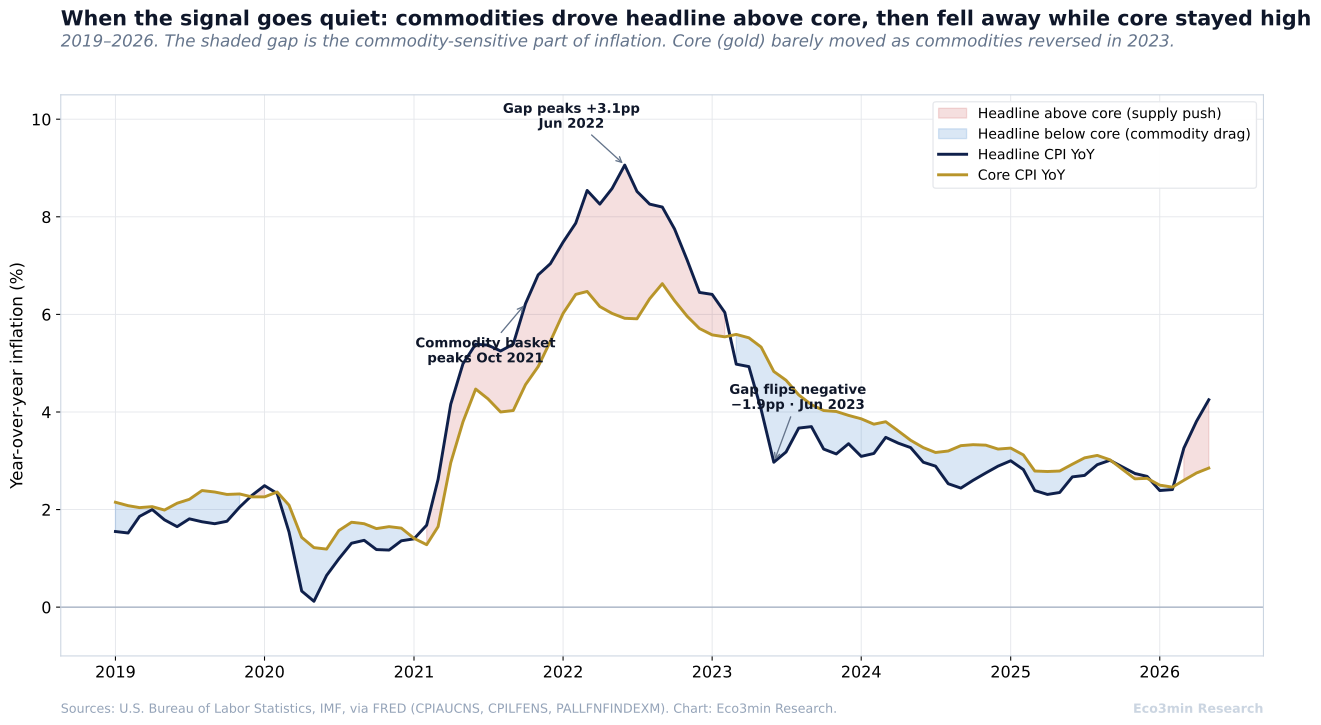
Between June 2022 and June 2023, headline inflation fell about six percentage points while core fell barely one. The commodity signal explained the volatility, not the level inflation ultimately settled at.
Sources: U.S. Bureau of Labor Statistics, IMF, via FRED (CPIAUCNS, CPILFENS, PALLFNFINDEXM). Chart: Eco3min Research.
The lesson generalizes. Commodities answer one question well — is a supply shock hitting the price level right now? — and a different question not at all: will inflation persist? For the monetary-policy side of that second question, see our federal funds rate dataset and M2 money supply dataset.
What the Gap Did Next: Forward Outcomes by Commodity Regime
Classifying each month by the commodity basket’s year-over-year change and looking at what the inflation gap did over the following year shows two things at once: the contemporaneous relationship is strong, and it mean-reverts. High-commodity regimes are associated with a wide positive gap that subsequently narrows; deep-contraction regimes with a negative gap that subsequently recovers toward zero.
| Commodity regime (YoY) | n | Median gap (current) | Median gap +6m | Median gap +12m | Median headline CPI +12m |
|---|---|---|---|---|---|
| Deep contraction (< −20%) | 39 | −1.63pp | −1.22pp | −0.13pp | 2.1% |
| Mild contraction (−20 to 0%) | 122 | −0.41pp | −0.40pp | −0.21pp | 2.0% |
| Mild expansion (0 to +20%) | 141 | +0.14pp | +0.23pp | +0.22pp | 2.7% |
| Strong expansion (+20 to +40%) | 72 | +1.17pp | +0.93pp | +0.45pp | 2.7% |
| Surge (> +40%) | 26 | +1.61pp | +1.46pp | +0.62pp | 5.0% |
When commodities were surging more than 40% year-over-year, the median inflation gap was +1.61 points and headline inflation a year later ran near 5%. When commodities were contracting more than 20%, the median gap was −1.63 points and headline inflation a year later ran near 2%. The current-gap column is monotonic across all five regimes.
Methodological note: Forward windows are calendar months and overlap, which inflates statistical significance; the figures are descriptive of historical co-movement, not estimates of future outcomes. The smallest regime bucket (surge) contains 26 months, above the threshold where single-episode dominance becomes a concern, though the surge observations cluster in a few historical episodes (2008, 2011, 2021–2022).
Past distributions are not predictive of future outcomes. Regime-conditional statistics describe historical patterns, not expected values.
- ▸ Commodity basket at +34.4% YoY (May 2026): a move back below 0% YoY has historically been associated with the inflation gap turning negative — in 90% of contracting months since 1993, headline ran below core.
- ▸ Headline − core gap at +1.4 points: a sustained widening toward the +3-point area would place the current episode alongside 2008 and 2022, the only two periods the gap reached that level. See the underlying headline CPI dataset.
- ▸ Next CPI release: the BLS publishes June 2026 CPI in mid-July 2026. Because commodities feed the food and energy lines, the gap component reacts fastest to commodity moves already visible in real time.
Regime Classification: The One-Axis View
Each dot is one month: commodity moves and the inflation gap line up on a single axis
When commodities run hot, headline inflation runs above core; when they fall, headline drops below it. 1993–2026, r = 0.86.
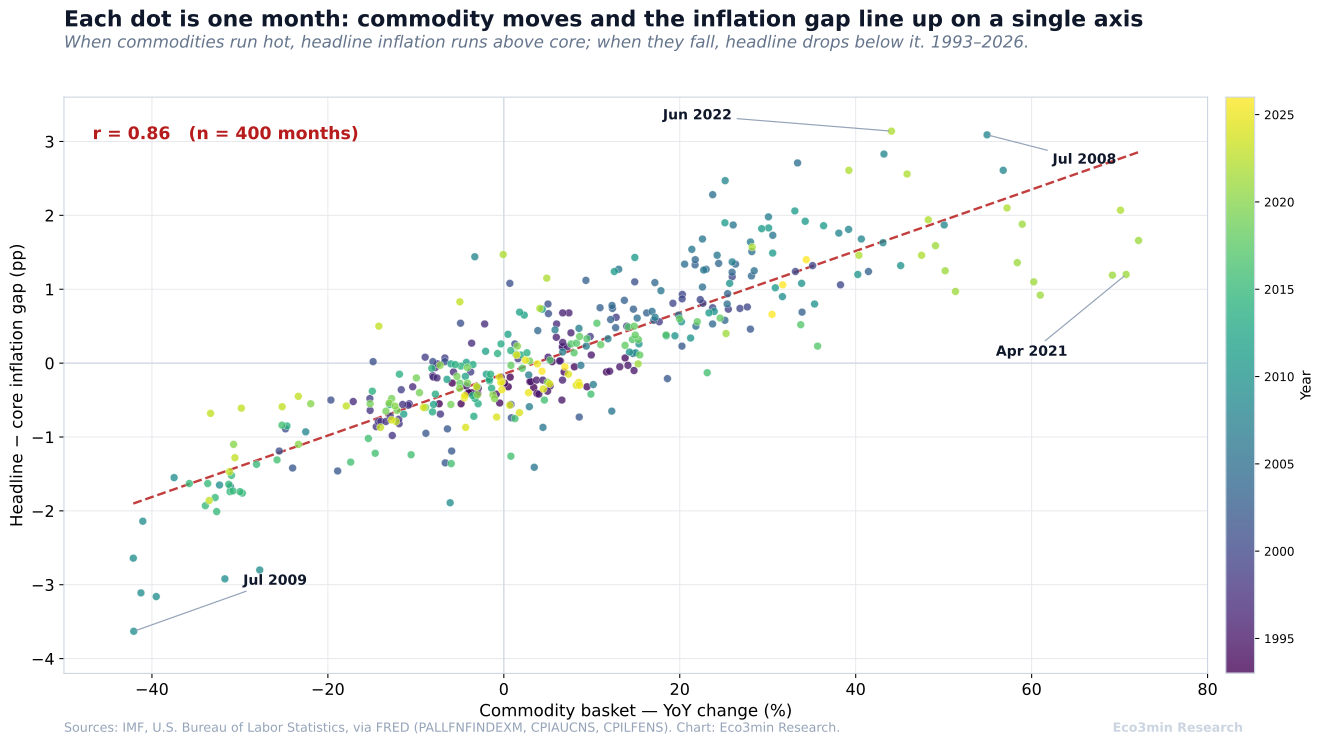
Sources: IMF, U.S. Bureau of Labor Statistics, via FRED. Chart: Eco3min Research.
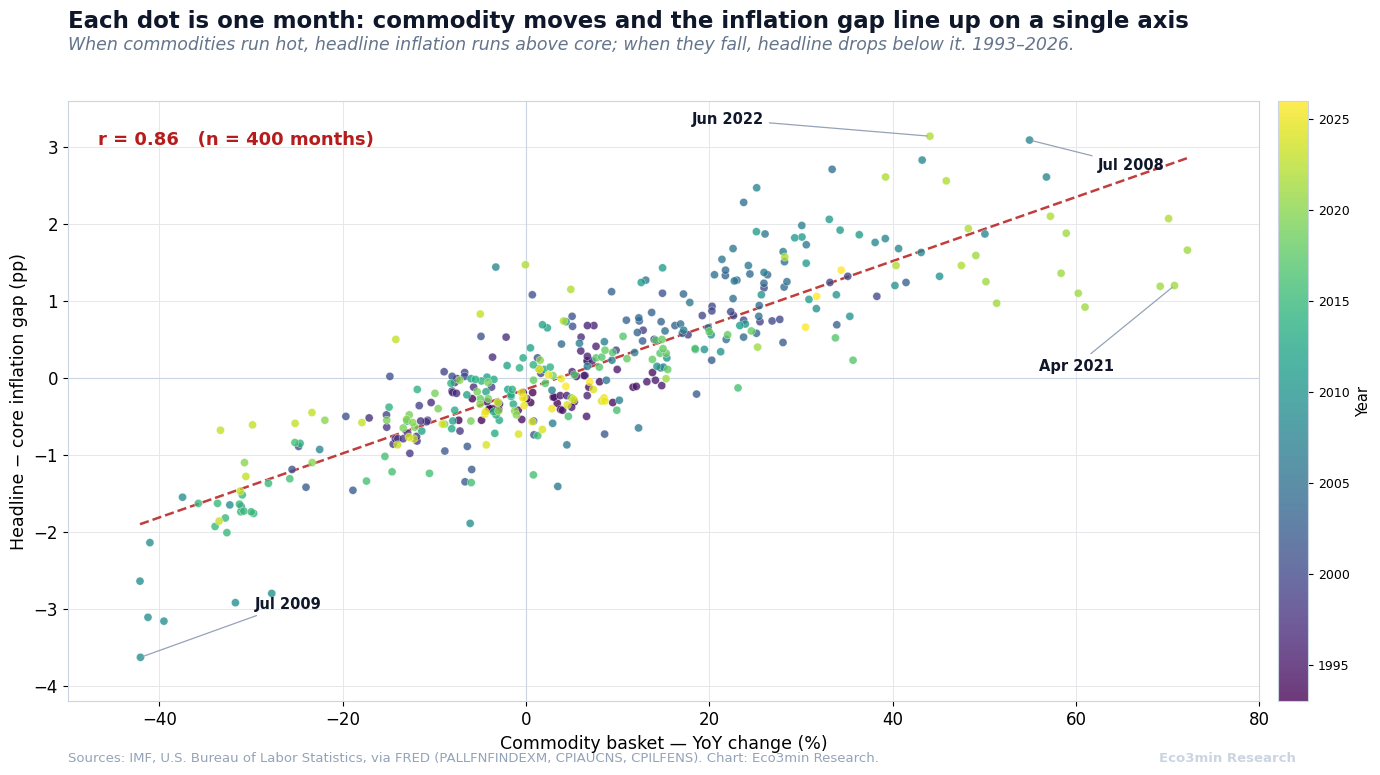
Median gap +1.61pp; positive in 100% of 26 months. Commodities pushing headline well above core — the supply-shock peak. Historical instances: 2008, 2011, 2021–2022.
Median gap +1.17pp; positive in 99% of 72 months. Headline running distinctly above core; the supply contribution material but not extreme.
Median gap −0.15pp across 263 months. Commodities roughly neutral; headline and core converge and the gap carries little signal in either direction.
Median gap −1.63pp; negative in 100% of 39 months. Commodities dragging headline below core — disinflation or outright deflation in the headline number, as in 2009 and 2015.
Turning Points: The Gap at Each Commodity Extreme
July 2008 — The Pre-Crisis Commodity Peak
Commodities were up 54.9% year-over-year as oil approached its record. Headline CPI hit 5.6% while core sat at 2.5%, opening a gap of +3.09 percentage points — at the time the widest in the record. The episode is a clean supply-shock signature: a large wedge between headline and core, almost entirely commodity-driven. Within a year the relationship reversed completely. For the oil-price detail, see our WTI crude oil dataset.
July 2009 — The Deflation Mirror
One year later, commodities had collapsed 42.1% year-over-year — the largest contraction in the entire record. Headline CPI turned negative at −2.1% while core remained positive at 1.5%, producing the widest negative gap on record at −3.63 points. The symmetry with July 2008 is the point: the same mechanism that pushed headline far above core in 2008 pushed it far below core in 2009, while core itself moved comparatively little (2.5% to 1.5%).
April 2021 — The “Transitory” Window
Commodities were already up 70.7% year-over-year, but the gap was a modest +1.20 points: headline 4.2%, core 3.0%. The commodity surge was well underway and visible in real time, even as the prevailing view held that the inflation pickup would be temporary. The gap had not yet reached its extreme because the surge was still feeding through.
June 2022 — The Gap Peak
Headline CPI reached 9.1%, its highest in four decades, against core of 5.9% — a gap of +3.14 points, the widest in the record. Commodities were still up 44.1% year-over-year, though the basket’s own year-over-year rate had already peaked eight months earlier, in October 2021. The gap, not the commodity rate, marked the true headline-inflation top.
June 2023 — The Flip
Commodities were down 33.5% year-over-year. Headline CPI had fallen to 3.0% — below core inflation of 4.8% — flipping the gap to −1.86 points. This is the rollover in a single observation: commodities had swung from adding three points to headline to subtracting nearly two, while core, the persistent component, stayed above 4.8%. The commodity signal had gone quiet precisely when the question shifted from “is a supply shock hitting?” to “will inflation persist?”
May 2026 — Current Observation
Commodities are up 34.4% year-over-year, placing the month in the strong-expansion regime. Headline CPI is 4.3%, core 2.9%, and the gap stands at +1.4 points — back in supply-push territory, consistent with the historical pattern that an expanding commodity basket runs alongside a positive gap. Core inflation, at 2.9%, sits where this dataset carries no signal about its direction.
Methodology
This dataset aligns three monthly series — the IMF Primary Commodity Price Index, U.S. headline CPI, and U.S. core CPI — and derives the headline-minus-core inflation gap, the proprietary object of the page. All inflation rates are 12-month (year-over-year) percentage changes. The analytical sample runs from January 1993 to May 2026; the commodity index begins in January 1992, and the first 12 months are consumed by the year-over-year calculation.
headline_cpi_yoy = ( CPIAUCNS[t] / CPIAUCNS[t−12] − 1 ) × 100
core_cpi_yoy = ( CPILFENS[t] / CPILFENS[t−12] − 1 ) × 100
headline_core_gap = headline_cpi_yoy − core_cpi_yoy
Filter Definitions
“October 2025 excluded” = BLS published no headline or core CPI value for that month (release disruption)
“Current month excluded” = June 2026 omitted as an incomplete observation
“Deep contraction” = commodity_yoy < −20%
“Mild contraction” = −20% ≤ commodity_yoy < 0%
“Mild expansion” = 0% ≤ commodity_yoy < +20%
“Strong expansion” = +20% ≤ commodity_yoy < +40%
“Surge” = commodity_yoy ≥ +40%
Regime Selection and Sensitivity
Commodity regimes are fixed thresholds on the year-over-year commodity change, not data-mined boundaries. The conceptual anchor for separating headline from core is Robert Gordon’s 1975 analysis of supply shocks, which established the case for looking through food and energy to the underlying inflation trend. Shifting every band edge by ±5 percentage points leaves the monotonic pattern intact — the median gap still rises strictly from the deep-contraction band to the surge band — and changes the headline correlation by less than 0.02. The core correlation (0.15) is insensitive to band definitions because the bands are not used to compute it.
On the lead structure: the commodity-to-gap correlation is 0.86 contemporaneously and 0.885 at a one-month lead, indicating the gap reacts to commodities with a lag measured in weeks, not quarters. This is consistent with the mechanical channel — food and energy prices enter CPI quickly — rather than a long predictive lead. The figures are descriptive; year-over-year series are serially correlated, which inflates correlation and R² relative to what independent monthly observations would produce.
Dataset Design
| Variable | Type | Unit | Source | Calculation |
|---|---|---|---|---|
| commodity_index | float | index, 2016=100 | IMF (PALLFNFINDEXM) | direct |
| commodity_yoy | float | % | derived | 12-month % change |
| headline_cpi | float | index, 1982–84=100 | BLS (CPIAUCNS) | direct |
| headline_cpi_yoy | float | % | derived | 12-month % change |
| core_cpi | float | index, 1982–84=100 | BLS (CPILFENS) | direct |
| core_cpi_yoy | float | % | derived | 12-month % change |
| headline_core_gap | float | pp | derived | headline_cpi_yoy − core_cpi_yoy |
| fed_funds | float | % | FRED (FEDFUNDS) | direct |
| commodity_regime | str | label | derived | band of commodity_yoy |
| gap_fwd_6m / 12m | float | pp | derived | gap shifted −6 / −12 months |
Python Reproduction Code
# Reproduce the commodity / inflation-gap dataset from primary sources
import pandas as pd

def fred(series):
    url = f"https://fred.stlouisfed.org/graph/fredgraph.csv?id={series}"
    s = pd.read_csv(url, parse_dates=["observation_date"])
    s.columns = ["date", series.lower()]
    return s

comm = fred("PALLFNFINDEXM")
cpi  = fred("CPIAUCNS")
core = fred("CPILFENS")

df = comm.merge(cpi, on="date").merge(core, on="date")
df = df[df["date"] >= "1992-01-01"]

# 12-month (year-over-year) inflation rates
df["commodity_yoy"]    = df["pallfnfindexm"].pct_change(12) * 100
df["headline_cpi_yoy"] = df["cpiaucns"].pct_change(12) * 100
df["core_cpi_yoy"]     = df["cpilfens"].pct_change(12) * 100

# the proprietary object: the headline-minus-core inflation gap
df["headline_core_gap"] = df["headline_cpi_yoy"] - df["core_cpi_yoy"]

d = df.dropna(subset=["commodity_yoy", "headline_core_gap"])
print(d["commodity_yoy"].corr(d["headline_core_gap"]))  # 0.86
print(d["commodity_yoy"].corr(d["core_cpi_yoy"]))      # 0.15
Dataset Download & Reproducibility
413 observations · Monthly · 1992–2026 · Licensed under CC BY 4.0.
Data Sources & References
- Primary International Monetary Fund, Primary Commodity Price Index, all-commodity basket (FRED series PALLFNFINDEXM), retrieved June 2026.
- Primary U.S. Bureau of Labor Statistics, CPI for All Urban Consumers: All Items, not seasonally adjusted (FRED series CPIAUCNS).
- Primary U.S. Bureau of Labor Statistics, CPI for All Urban Consumers: All Items Less Food and Energy, not seasonally adjusted (FRED series CPILFENS).
- Research Gordon, R. J. (1975). “Alternative Responses of Policy to External Supply Shocks.” Brookings Papers on Economic Activity, 1975(1).
- Research Stock, J. H. & Watson, M. W. (2007). “Why Has U.S. Inflation Become Harder to Forecast?” Journal of Money, Credit and Banking, 39(s1).
- Reference Federal Reserve Bank of Cleveland, core inflation measures and methodology.
- Reference U.S. Bureau of Labor Statistics, CPI relative importance tables.
Methodological Limitations
- Mechanical overlap. Food and energy are components of headline CPI, so part of the commodity-to-headline and commodity-to-gap correlation is accounting overlap rather than independent prediction. The gap correlation in effect measures the food-and-energy contribution to inflation.
- Ex-post identification. Regime classifications and turning points are identified after the fact. The relationships are descriptive of historical co-movement and are not a real-time trading or forecasting rule.
- Serial correlation. Year-over-year inflation series are autocorrelated, which inflates correlation and R² relative to what statistically independent observations would yield.
- Overlapping windows. The forward-distribution figures use overlapping monthly windows, overstating statistical significance; the surge regime’s 26 months cluster in a few historical episodes.
- Data availability. The October 2025 CPI was not published (release disruption) and is excluded; the current month is excluded as incomplete. The most recent commodity observations are subject to IMF revision.
- Composition drift. The IMF basket weights and CPI weights have both changed over the 34-year span; comparisons across the full period assume approximate stability of composition.
Frequently Asked Questions
Do commodity prices predict inflation?
They predict part of it. Since 1992, the year-over-year change in a broad commodity basket has correlated with U.S. headline CPI inflation at 0.66, but with core inflation — the measure that excludes food and energy — at only 0.15. Commodities are most strongly related to the gap between headline and core inflation (0.86), which is the supply-driven component of the price level. They are a real-time signal about supply shocks, not a forecast of where inflation will ultimately settle.
Why is core inflation different from headline inflation?
Headline CPI includes all goods and services; core CPI removes food and energy, which are volatile and largely driven by global commodity prices. The concept traces to Robert Gordon’s 1975 work on supply shocks. Because food and energy are exactly the commodity-sensitive items, headline and core diverge most when commodity prices are moving sharply — which is why the headline-minus-core gap tracks the commodity cycle so closely.
What is the headline-core inflation gap?
It is headline CPI inflation minus core CPI inflation, in percentage points. A positive gap means food and energy are pushing headline inflation above the underlying core rate; a negative gap means they are dragging it below. Over 1993–2026 the gap ranged from +3.14 points (June 2022) to −3.63 points (July 2009). In this dataset it is the variable most tightly linked to commodity prices.
Isn’t the link between commodities and inflation just mechanical, since food and energy are in CPI?
Partly, yes — and that is the point rather than a flaw. Because food and energy are components of headline CPI, commodities correlate with headline partly by construction, and the gap correlation (0.86) effectively isolates that food-and-energy contribution. What the data adds is the contrast: commodities co-move with only about two percent of the variance in core inflation (0.15). So the honest statement is not “commodities predict inflation” but “commodities are the fastest-moving prices inside headline CPI, and they say almost nothing about the underlying trend.” The mechanical channel is precisely why commodities are informative about the gap and uninformative about core. A broader view: our guide to commodity access routes.
Can commodity prices tell you whether inflation will persist?
No. Commodities carry essentially no information about the persistent, services- and shelter-driven component of inflation, which core CPI captures. The 2022–2024 period is the clearest example: commodities fell more than 30% year-over-year between mid-2022 and mid-2023, flipping the headline-core gap negative, yet core inflation stayed above 4.8%. The commodity signal answers whether a supply shock is hitting the price level now; it does not answer whether inflation will stick.
Did commodity prices predict the 2021–2022 inflation surge?
They led the headline number in early 2021: by February 2021 the basket was up 25% year-over-year while headline CPI was still 1.7%. But the basket’s own year-over-year rate peaked in October 2021, eight months before headline inflation topped out at 9.1% in June 2022. The later, more persistent phase of that inflation — the part that kept core elevated through 2023 and 2024 — was a services and shelter story that commodities did not capture. Commodities flagged the supply-driven onset, not the persistence.
Source
Related Eco3min Research
Last updated — 15 September 2026
Disclaimer – Financial Information: The analyses, commentary, and content published on eco3min.fr are provided for informational and educational purposes only. They do not constitute investment advice or a solicitation to buy or sell financial instruments. Past performance is not indicative of future results. All investment decisions involve risk and are the sole responsibility of the reader.