
How to Invest in Commodities in 2026: Access Routes and Their Structural Costs
Commodities are the one asset class an individual investor cannot actually hold. There is no spot barrel to buy and keep, so every route into the class is an approximation, and each approximation carries a structural cost the headline question hides.
Most guides answer “how to invest in commodities” by listing vehicles. The harder, more useful point comes first: none of those vehicles holds the commodity itself.
There is no spot commodity to own, so the real question is which priced approximation you are buying and what it costs to carry.
- The main futures-based oil fund returned roughly minus 14.6% a year over the decade to January 2022 (Money for the Rest of Us) even as oil rallied, because rolling contracts in contango bleeds value.
- That fund’s 0.6% expense ratio is the small cost; the roll is the large one, and it is invisible in the headline price.
- Contango is not permanent: in backwardation the same roll adds return, so the drag has a documented mirror image.
- Precious metals are the exception, since bullion can be held, and are covered separately in our guide to how gold is accessed.
What the question quietly assumes
The phrase “invest in commodities” borrows the intuition of owning a thing: a barrel, a tonne of copper, a bushel of wheat. That intuition does not survive contact with the mechanics. A retail investor cannot take delivery of crude, store it to grade, and resell it, so no route actually conveys the spot. You cannot hold the spot; every route to it is a priced approximation. The class is, for this reason, the hardest one for an individual to reach cleanly, and the honest starting point is to name the approximations rather than to rank them.
Naming them is more than pedantry, because the choice of approximation, not the view on the commodity, is often what determines the outcome. Two investors can be equally right that oil will rise and still see opposite results, one through a front-month fund that the roll erodes, the other through a producer whose hedges cap the gain. The commodity view is the easy part; the access decision is where the return is quietly made or lost, and that is the decision this page is about.
One route is a genuine exception and sits outside this page. Precious metals can be held physically, which changes the cost structure entirely, so gold and silver are treated on their own in our guide to accessing gold. Everything that follows concerns the commodities you cannot keep in a drawer: energy, industrial metals, and agricultural goods, where access runs through futures, funds built on futures, or the equity of the companies that produce them.
Why there is no spot to hold
Three frictions make direct ownership impractical. Storage: crude, gas, and grains need tanks, pipelines, or silos, with costs and losses that scale with time held. Grade and delivery: a futures contract specifies a quality, a location, and a delivery window, and physical settlement means actually receiving the commodity there and then. Logistics: moving and financing physical inventory is a business, not a portfolio line. These are the frictions the class is built around, and they are the subject of our pillar on commodity regimes and physical constraints and its analysis of how physical markets set structural signals. That pillar studies the markets; this page documents the access. The distinction matters, because the cost of access is a separate question from how prices form.
These frictions have a name in the price itself: the cost of carry. Storing a physical commodity ties up cash and incurs storage and insurance, and that carrying cost is one of the forces that pushes later-dated futures above nearer ones, the very contango the fund route then pays. In other words, the reason there is no free spot to hold and the reason the roll costs money are the same reason seen from two angles. Access and price structure are linked, which is why a route’s cost cannot be read without understanding the curve it sits on.
Route one: futures
The direct route is the futures market itself, and it is professional infrastructure. Buying a crude contract means posting margin, meeting margin calls if the position moves against you, and managing an expiry: hold a contract to its delivery date and you are, in principle, on the hook to receive the physical commodity. To stay exposed without taking delivery, a holder rolls, selling the expiring contract and buying a later-dated one, month after month.
Two things make this route professional rather than retail. First, the leverage: a futures position is controlled with a margin deposit that is a fraction of the contract’s notional value, so gains and losses are amplified, and an adverse move triggers a margin call to be met in cash or the position is closed out. Second, the calendar: staying exposed means rolling on a schedule, and the largest index-tracking flows roll on well-known dates that other participants can anticipate and trade around. For an individual, the practical consequence is that the direct futures route is rarely the one actually taken; it is the machinery that the fund route, below, packages and hides.
Contango and backwardation, briefly
The roll has a price, set by the shape of the futures curve. When later contracts cost more than nearer ones, the curve is in contango, and each roll sells low and buys high, subtracting value. When later contracts cost less, the curve is in backwardation, and each roll sells high and buys low, adding value. This is the single most important mechanic in commodity access, and it is set out in full in our explainer on how contango erodes commodity funds. This page does not reproduce that mechanism; it follows the mechanism into its dated, numerical consequences.
Route two: commodity funds, and roll erosion
Most individuals reach the class through a fund built on futures: a commodity ETF, or an exchange-traded note (an ETN, which adds the issuer’s own credit risk as a documented feature, since an ETN is an unsecured debt promise rather than a pool of assets). These wrappers spare the investor the margin account and the roll mechanics, but they do not spare the roll cost. They roll on the holder’s behalf, and in contango that roll compounds against the position.
The scale is the point the headline price hides. The largest futures-based oil fund returned approximately minus 14.6% a year over the ten years ending January 2022, according to Money for the Rest of Us, a decade in which spot crude was volatile but ended far above where a straight-line reading of the price would have suggested such a loss. The fund carries a 0.6% annual expense ratio, which looks like the cost until you see the roll: 0.6% is the visible fee, and the roll drag is the large, quiet one. The same fund, structured as a limited partnership, also hands US holders a Schedule K-1 at tax time rather than the simpler form most funds issue, an access cost of a different kind. The underlying prices are tracked on our Brent crude price dataset and copper price history.
Not all commodity funds roll the same way, and the difference matters. Front-month funds hold the nearest contract and roll it every month, which tracks near-term price moves closely but also maximises exposure to contango. Broad-index and optimised-roll funds instead spread across later-dated contracts or choose roll dates to soften the drag, trading some short-term tracking for a smaller structural bleed. The 2020 oil collapse showed how far the mechanics can travel: when the nearest contract briefly traded below zero, the largest oil fund restructured its holdings across further-out contracts and later ran a reverse share split, a reminder that the wrapper’s design, not only the oil price, drives what the holder ends up with.
These properties make futures-based funds better suited to expressing a short-dated view than to holding the class for years. Over a tactical window the roll cost is a small tax on a directional bet; over a long hold in a contango-prone market it becomes the dominant term, quietly reversing an otherwise correct call. The partnership tax treatment compounds the mismatch for long-term US holders, since a Schedule K-1 arrives every year the position is open, whether or not it was sold. None of this rules the route out; it locates where it works and where its costs concentrate.
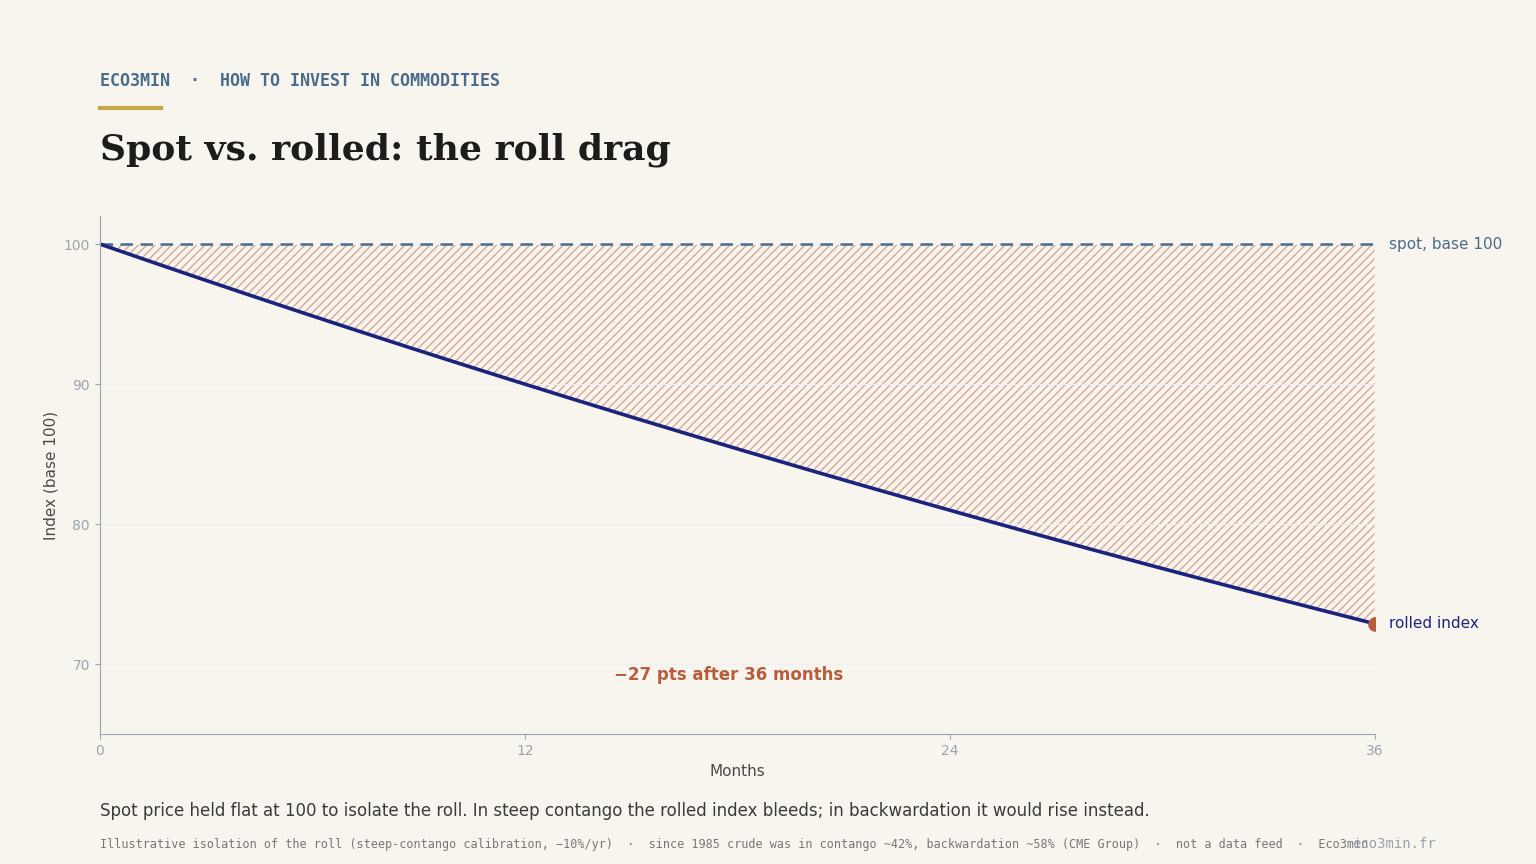
The tool below replays the divergence directly. Pick a dated episode and it plots the spot index against a rolled index from the same base, and reads out the cumulative gap the roll opened. The point is not that funds are a mistake; it is that the gap between the price you read and the return you earn is a structural feature of the route, worth seeing before committing rather than after.
Spot vs. rolled: the roll drag
With the spot price held flat (base 100), what the roll alone adds or subtracts
Rolled index (base 100)
Cumulative gap vs spot
Route three: sector equities, an imperfect proxy
The third route buys the producers rather than the commodity: energy majors, miners, agricultural firms. It sidesteps the roll entirely, which is its appeal, but it swaps one approximation for another. A producer’s share price carries equity-market beta, so it moves with the stock market as much as with the commodity, and it embeds the company’s operating costs, debt, governance, and often its hedging book, which can deliberately mute the very price exposure the investor wanted. A miner is a business with a commodity input, not a claim on the commodity. The gap between the two is analysed across our work on physical commodity markets and, for the metals case, in our study of the copper-gold ratio as a macro signal. Sector equity is a route to the theme, not a route to the price.
The trade-off is worth stating precisely. A producer’s earnings are geared to the commodity price minus its costs, so a modest move in the commodity can produce a large move in profit, an operating leverage that cuts both ways: in a rising market it can outpace the commodity, in a falling one it can drop faster. Layered on top is the equity market itself, since in a broad sell-off producer shares often fall with everything else regardless of the commodity’s own path, which is precisely the correlation an investor reaching for commodities was trying to escape. Producer hedging adds a final wedge, because a company that has locked in forward prices will not pass through a spot rally its shareholders were counting on. On this point: our analysis “Choosing investments in the light of the macro cycle”.
What the class actually delivers by regime
Set access aside and ask what commodity exposure does inside a portfolio, because the answer is conditional, not fixed. The class is often described as an inflation hedge, and there is truth in it: when inflation is driven by a supply shock in energy or food, commodities are the shock, so they rise with the very prices that erode other assets. But the relationship is regime-dependent, not automatic, and it can run the other way, a case set out in our study of whether commodities still diversify and in the wider work on commodities as macro-regime signals.
Diversification is equally conditional. Commodities earned their portfolio reputation in periods when they moved independently of equities, but correlations rise in some regimes and fall in others, so the diversification a straight-line pitch promises is a property of the regime, not a permanent feature of the class. What the macro backdrop changes is exactly this: which of the class’s behaviours, hedge or amplifier, diversifier or co-mover, is the one currently in force.
The inflation nuance is worth drawing out, because it is where the class most often disappoints. Commodities hedge inflation reliably when the inflation originates in commodities, an oil shock, a harvest failure, a metals squeeze, because then the hedge and the disease are the same thing. They hedge far less reliably against a demand-driven or monetary inflation, where prices across the economy rise without a commodity shock leading them, and they can lag badly when inflation cools while a supply glut persists. The record that built the diversification case came largely from a specific window, and the periods since have been mixed, which is the substance of the study linked above on when the class stopped diversifying.
Read by the macro regime
As of mid-2026 the reading is a transition with mixed signals, and commodities are near the centre of it. An energy shock tied to the 2026 Middle East conflict pushed oil sharply higher, with WTI running from near $57 at the start of the year to a peak around $113 in April before easing back toward the high $70s by June, and Brent a few dollars above that. That shock is why headline inflation has run well above the underlying trend, and it is the clearest live example of commodities being the source of an inflation impulse rather than a passive hedge against one. The current reading and its drivers are tracked on the macro regime dashboard, with the commodity-heavy case set out in the atlas of the inflationary regime.
The route an investor picks does not change the regime; the regime changes what each route delivers. In an energy-led inflation, a rolled fund that would bleed in a calm contango can instead ride a backwardated curve, while a producer equity may lag the commodity if its hedges cap the upside. The regime sets the payoff; the route sets the cost and the fidelity of the exposure.
This is why the same headline call can succeed or fail on the access decision alone in the current backdrop. An investor who read the 2026 energy shock correctly still had to choose a vehicle: a front-month fund would have tracked the spike closely while a supply disruption kept the near curve firm, whereas a producer with forward sales hedged would have banked less of the move than its shareholders expected. The macro read and the access read are two separate correct answers a commodity investor has to get right, and this page is about the second one because the first is covered across the pillar and the regime pages linked here.
The observable criteria grid
The routes sort cleanly once the cost is read as a property of the route rather than of the commodity behind it. The table sets each against the exposure it actually delivers, the cost it carries, the horizon it suits, and the risk that is specific to it.
Horizon is the variable the headline question omits most often. A cost that is trivial over a week can dominate over a decade: the roll drag that barely registers on a tactical position compounds relentlessly on a buy-and-hold one, which is why the same fund can be a reasonable short-term instrument and a poor long-term holding at once. Sector equity inverts the logic, since it sits comfortably over long horizons but does so as a stock-market position that happens to have a commodity input, not as commodity exposure held patiently. Matching the route to the intended holding period is therefore part of the cost calculation, not separate from it. Holding period is also the first variable of asset allocation across market regimes, of which commodity exposure is one line.
| Route | Exposure obtained | Structural cost | Compatible horizon | Specific risk |
|---|---|---|---|---|
| Futures, direct | Near-spot, with roll | Roll in contango; margin calls | Short and active; long holds are costly to maintain | Delivery and margin management; professional infrastructure |
| Commodity ETF | Rolled futures, packaged | Roll drag plus expense ratio (0.6% on the main oil fund) | Tactical; long holds accumulate roll drag in contango | Tracking gap versus spot; K-1 tax filing for partnership funds |
| Commodity ETN | Rolled index, as a note | Roll drag plus fee | Tactical; the same drag over time | Issuer credit risk, since an ETN is unsecured debt |
| Sector equity | The producer, not the price | Equity beta; company costs | Long, but as an equity holding rather than commodity exposure | Hedging book can mute the exposure; stock-market risk |
Frequently asked questions
Can an individual investor buy physical commodities?
For most commodities, not practically. Crude oil, natural gas, and grains require storage, grading, and delivery logistics that make direct holding a business rather than an investment. Precious metals are the exception, since bullion can be held or held on an investor’s behalf, which is why gold is treated separately. For everything else, access runs through futures, funds built on futures, or producer equities.
Why does an oil fund lag the price of oil?
Because it holds futures rather than oil, and rolling those futures repeatedly is where the cost enters. When the futures curve is in contango, each roll sells a cheaper expiring contract and buys a costlier later one, subtracting value over time. Over the decade to January 2022 the largest oil fund returned roughly minus 14.6% a year (Money for the Rest of Us) despite oil’s rallies, a gap driven mainly by that roll rather than by its 0.6% fee.
What is contango?
Contango describes a futures curve where later-dated contracts cost more than nearer ones. A holder who rolls to stay exposed then repeatedly sells low and buys high, so contango subtracts return. Its opposite, backwardation, has later contracts cheaper, so rolling adds return. Whether a market sits in one or the other varies over time and is a central input to any futures-based route.
Which route to commodities is cheapest?
There is no single answer, because the routes carry different kinds of cost. A fund’s fee is small and visible; its roll cost is larger and varies with the curve. Sector equity avoids the roll but adds equity risk and company costs. The cost that dominates depends on the commodity, the curve, and the holding period, which is what the grid and the tool on this page make visible rather than resolve.
Are commodities a good diversifier right now?
It depends on the regime. Commodities diversify a portfolio when they move independently of equities, and they hedge inflation when the inflation is commodity-driven, as in the 2026 energy shock. But both properties are conditional, and correlations shift across regimes, so the diversification benefit is a feature of the current backdrop rather than a permanent trait of the class.
- No route conveys the spot commodity; each is an approximation with its own structural cost, which is what the headline price hides.
- For futures-based funds, the roll, not the expense ratio, is the dominant cost in contango, and it has a documented mirror image in backwardation.
- Sector equity trades the roll for equity beta and company risk, delivering the theme rather than the price.
- What commodity exposure does for a portfolio, hedge or amplifier, diversifier or co-mover, is set by the regime, not fixed by the class.
What “investing in commodities” actually buys
The useful reframing is to stop picturing the barrel and start pricing the claim on its path. Whichever route an investor takes, they are buying a cost-laden proxy: a rolled future that bleeds or gains with the curve, a note that adds issuer risk, or a company that dilutes the exposure with its own business. None of that argues the class away; it argues for reading the cost of access before the price of the commodity. Named that way, the difficulty of the class is not a reason to look elsewhere, but the first thing worth understanding about it. For where the class sits among the alternatives, our overview of what different asset classes deliver maps the wider terrain.
This article is general information, not investment, tax, or financial advice, and does not account for any individual situation. Figures are sourced and dated in the text and may change. Consider your own circumstances, and where relevant a regulated professional, before acting.
Last updated — 15 September 2026
Disclaimer – Financial Information: The analyses, commentary, and content published on eco3min.fr are provided for informational and educational purposes only. They do not constitute investment advice or a solicitation to buy or sell financial instruments. Past performance is not indicative of future results. All investment decisions involve risk and are the sole responsibility of the reader.