Debt-Funded Share Buybacks: The Market’s Quiet Leverage
Debt-funded share buybacks support EPS and equity indices, but in a regime of higher real rates they raise balance sheet leverage. This analysis details the mechanism and the indicators to track.

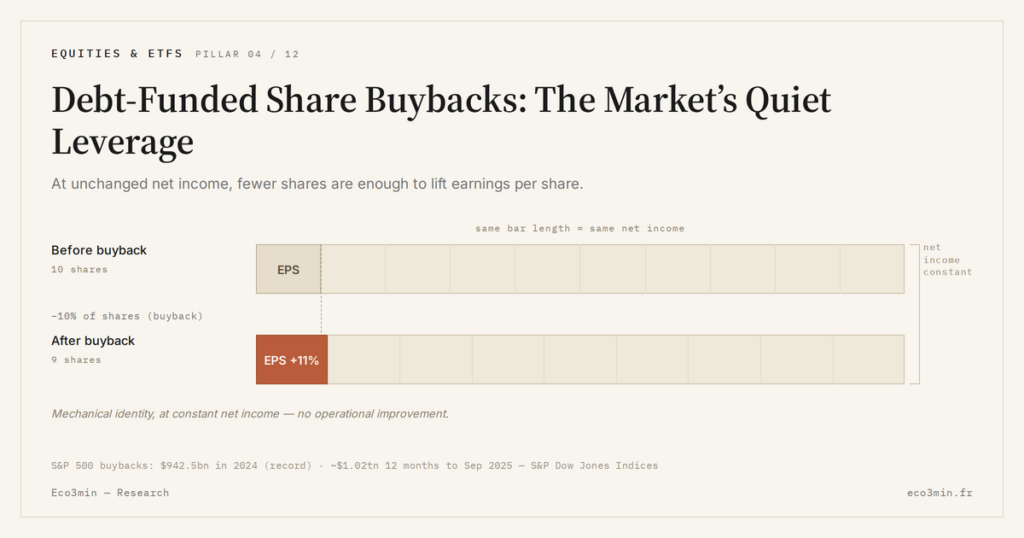
Debt-funded share buybacks: how this leverage supports earnings per share, alters balance sheet risk and can amplify market vulnerability.
TL;DR
US share buybacks topped $800bn a year in 2024–2025; where they are debt-funded, a falling share count lifts earnings per share while quietly raising balance-sheet leverage in a higher-real-rate regime.
- The mechanism is arithmetic: cutting the share count 10% on unchanged net income lifts EPS about 11% (€2 to ≈€2.22 in the article's example), with no operational gain.
- Over 2022–2024, several large US groups posted EPS growth of 5–8% a year while net income rose only ≈2%, a gap partly attributable to buybacks.
- Investment-grade debt that sometimes priced at or below 2% over 2010–2020 now carries 4–5% as policy rates settle higher, so the main risk is refinancing capacity rather than immediate default.
- Buybacks have absorbed more than 70% of net income at some groups in 2023–2024; a ratio durably above 100% points to debt funding or asset sales rather than surplus cash.
Since the gradual decline of inflation between 2023 and 2025 and the stabilisation of real policy rates around ≈1–1.5% in major advanced economies, many large-cap companies have relaunched substantial shareholder return programmes. Part of these programmes draws on a long-standing reflex: using debt to finance share buybacks.
The market only partially absorbs this combination of immediate price support and potential balance sheet fragility. Announced buyback volumes in the United States over 2024–2025 (more than $800bn per year on broad-index aggregates) indicate that the topic is no longer marginal: it shapes the equity cycle, particularly when earnings growth slows. A broader view: the assumptions that mislead investors on the stock market.
An Often-Overlooked Angle
What is shifting quietly is not the existence of buybacks — well known — but the way they are funded. When rates rise faster than revenue growth, every euro of new debt issued to support a buyback shifts the balance between apparent value creation and future financial risk. The question is not whether buybacks are “good” or “bad”, but the conditions under which they signal fragility rather than confidence.
Search Intent: Understanding the Mechanism, Not Judging the Strategy
The central intent here is informational: unpacking how debt-funded share buybacks work, which indicators to track, and how they can artificially support certain equity indices. The objective is to provide an analytical framework, not to rule on the merits of these operations.
To place this signal within a broader monetary and financial cycle context, the general framework on real policy rates and the cost of capital remains the structuring reference. Buyback behaviour cannot be understood without this context.
The technical setup is straightforward:
- the company issues debt (bonds, sometimes a syndicated bank loan);
- it uses the proceeds to repurchase its own shares on the market;
- the share count falls, mechanically increasing earnings per share (EPS) at constant net income.
Concretely, if a company earns €1 billion with 500 million shares outstanding, EPS is €2. If it repurchases 50 million shares (−10%), still on €1 billion of net income, EPS rises to ≈€2.22, a +11% increase with no operational improvement. This is precisely the effect that markets may price into valuation multiples.
When these buybacks are debt-funded, the company exchanges part of its equity for a future commitment: paying interest and repaying principal. The effective cost depends on the interest rate, maturity, and real rate regime. With US policy rates back around 4–5% nominal between 2023 and 2025, the leverage profile is markedly different from that of 2010–2020, when investment grade corporate issuances sometimes priced at 2% or below.
Historical Perspective: From Cheap Debt Buybacks to a Tighter Cost of Capital
Between 2010 and 2019, the combination of short rates near 0%, modest inflation and abundant liquidity allowed many companies to fund themselves at very low cost. A significant share of buybacks in that period rested on this cheap debt, supporting indices such as the S&P 500 even as organic growth stayed moderate.
Since 2022, monetary normalisation has changed the backdrop:
- US policy rates rose from 0–0.25% in early 2022 to ≈5% in 2024 before easing slightly in 2025;
- in the euro area, the deposit rate moved from −0.5% to ≈3–3.5% over the same period before stabilising;
- corporate credit spreads were volatile, with stress phases in 2022–2023 followed by relative calm in 2024.
This higher cost of capital makes debt-funded share buybacks mechanically less neutral. The immediate EPS effect remains, but the long-run interest burden rises. With global real growth oscillating around 2.5–3% according to major international institutions, the ability to grow earnings faster than financial expense is less straightforward than in artificially low-rate periods.
What the Consensus Captures — and What It Leaves Out
Part of the market consensus views buybacks as a simple capital-return tool, often perceived as “neutral” or “efficient” so long as leverage ratios stay contained. Dominant central scenarios typically assume that companies will adjust their programmes if leverage rises too far, limiting systemic risk.
The analysis here places greater emphasis on collective dynamics. Even if each company adjusts individually, synchronised waves of debt-funded buybacks can:
- amplify equity demand in already-rising market phases, lifting valuations;
- increase balance sheet sensitivity to a more durable rise in real rates or to a recession shock;
- create a gap between earnings-quality indicators (EPS, net margin) and structural soundness (capex, R&D, financial flexibility).
The mechanism may remain sustainable company by company while adding an aggregate layer of vulnerability to equity markets. The risk lies less in immediate default than in a gradual erosion of flexibility once the cycle turns.
What Readers Really Want to Clarify
What many are looking for here is whether the index gains supported by these buybacks rest on a durable improvement in fundamentals or on accounting and financial support that could reverse. Behind that question lies a simple concern: valuations sustained by balance sheet leverage that amplifies losses in a shock rather than cushioning them. Because that leverage sits on a corporate balance sheet, it is at least visible; the inverse case is how a family office built bank-sized exposure without appearing in any position report.
Micro Mechanics: EPS, Leverage and Earnings Quality
At the company level, three dimensions are particularly sensitive:
EPS rises when the share count falls, even if net income stagnates. This is what can make earnings series look “resilient” despite operating margins under pressure. Over 2022–2024, several large US groups posted EPS growth of +5% to +8% per year while overall net income grew only ≈+2% on average. Part of this gap is attributable to buybacks.
2. Indebtedness and Interest Expense
The net debt / EBITDA ratio (or net debt / operating cash flow) is a first indicator: moving from 1.5x to 2.5x over a few years to fund buybacks materially shifts the risk profile. With investment grade corporate credit yields back around 4–5% in Europe and 5–6% in the US during 2024–2025, each additional turn of leverage absorbs more future cash flow.
3. Capital Allocation and Productive Investment
When a growing share of cash flow — or debt — is channelled into buybacks, less remains mechanically for growth capex, innovation or resilience-building (strategic inventory, geographic diversification, cybersecurity, climate adaptation). Over a 3 to 5-year horizon, this under-allocation can weigh on productivity and therefore on the ability to generate the future earnings that justify current valuations.
Counter-Reading: Why This Leverage Could Stay Contained
An alternative scenario, advanced in some current estimates, assumes that companies naturally adjust buyback programmes to higher rates: lower volumes when debt costs rise, stricter trade-offs between buybacks, dividends and investment. Under this view, debt-funded share buybacks would remain an opportunistic tool rather than a structural pillar of per-share performance.
This scenario rests on several assumptions: continued bond market access, no major macro shock, and management’s ability to resist short-term EPS pressure. Should a deeper recession or prolonged monetary tightening materialise, balance sheet flexibility could prove more constrained than consensus expects.
Points to Watch in Upcoming Earnings Reports
To place these signals within the broader equity cycle, the page on corporates and sectors in the global economic dynamic provides the general reference framework. Debt-funded buybacks are one specific case of capital allocation within that framework.
At the micro level, several indicators are useful:
- Buyback-to-net-income ratio: share of net income devoted to buybacks (sometimes >70% for certain groups in 2023–2024). A ratio durably above 100% points to debt funding or asset sales.
- Net debt trajectory: parallel rise in buyback volumes and net debt over 3 years signals that the programme is partly debt-funded.
- Average debt maturity: the shorter it is, the more the company is exposed to refinancing at potentially higher rates.
- EPS vs aggregate earnings: if EPS grows much faster than total net income, the buyback effect is likely material.
At a more macro level, cumulative buyback announcements in major indices (annual totals on the main US or European equity benchmarks) can be tracked as an aggregate technical-support indicator. A rapid rise in this cumulative figure during sluggish growth signals that index performance depends more on corporate finance than on the real economy. This divergence between financial support and fundamentals also surfaces in our analysis on performance dispersion before indices react.
Common Reading Errors
- Confusing EPS growth with operational improvement: attributing all EPS progress to better profitability obscures the mechanical impact of buybacks. Comparing the trajectory of total net income corrects for this bias.
- Looking only at gross leverage: a “reasonable” overall leverage ratio can hide a heavy concentration of short-term maturities. The maturity structure matters as much as the level.
- Ignoring the real rate context: a debt-funded buyback does not have the same impact when real rates are negative as when they settle durably in positive territory. The reading framework must integrate this regime shift.
Weak Signals to Watch in the Coming Quarters
Several quiet signals can shift the reading of this phenomenon:
- Possible tightening of credit conditions: if bond volatility picks up again, some issuers will see funding costs rise rapidly, which could lead them to scale back buyback programmes earlier than expected.
- Regulatory developments: recurring debates emerge on the role of buybacks in financial architecture, particularly in connection with systemic stability or value distribution between wages, investment and shareholders. A change in framework could alter CFO trade-offs.
- Macro cycle signal: the macroeconomic cycle barometer helps anticipate whether the environment remains compatible with comfortable use of debt or whether room for manoeuvre is narrowing.
Two Plausible Trajectories for Markets
Scenario 1: Smooth Normalisation of Buybacks
In this scenario, global growth remains moderate but positive, inflation continues to ease around 2–3%, and central banks keep real policy rates slightly positive. Companies gradually adjust their programmes, reduce the debt-funded share, and reprioritise productive investment. The role of debt-funded share buybacks in index performance fades without a sharp shock.
Scenario 2: Refinancing Stress and Valuation Correction
An alternative: a sharper economic slowdown in 2026 combined with persistently high real rates. Operating margins compress, internal cash generation falls, and companies that relied most heavily on debt-funded buybacks must urgently arbitrate between maintaining the dividend, cutting buybacks and compressing capex. Under this path, the contribution of buybacks to equity indices could reverse and amplify the decline if markets quickly reprice EPS expectations.
In both cases, the central issue is the consistency between buyback policy, funding structure and the macro environment. The broader macroeconomic reading largely determines how sustainable these strategies are.
Practical Implications for Different Actors
For investors, the key is not to pass moral judgement on buybacks, but to identify how much of reported EPS growth depends on this financial leverage, and how it would react to a longer rate cycle or a profit shock. Allocation decisions remain specific to each strategy, but understanding the mechanism reduces the risk of over-interpreting earnings trajectories.
For companies, the central question is future flexibility: how far should the balance sheet be committed to buybacks before eroding the capacity to absorb a shock or seize an external growth opportunity? The choice is not binary, but it implies an intertemporal trade-off between immediate share price support and long-term robustness.
For households, the issue is to read buyback announcements with a more structured eye: distinguishing cases where the buyback reflects a clear surplus of operating liquidity from those where it relies on heavier debt, in a rate environment that is no longer that of the past decade.
Underlying all this, the phenomenon is a reminder that equity markets are not only a mirror of the macro cycle: they also reflect financial engineering choices. So long as these choices remain compatible with the monetary framework and real growth, the support stays quiet. Should the balance break, the role of debt-funded share buybacks could appear as an amplifier of volatility rather than a simple capital distribution tool. A distribution financed by debt rather than earnings tilts a company toward its financial side, a textbook symptom of financialization among non-financial firms.
Questions Readers Often Ask
Do share buybacks always increase a company’s value?
No. They reshape the capital structure and the share count, but economic value depends on the future ability to generate cash flow. If buybacks displace profitable investments, long-term value can in fact be eroded.
How can one tell if a buyback is mostly debt-funded?
A simple approach is to compare, over several years, the sum of free cash flow, dividends paid and share buybacks to the change in net debt. If distributions materially exceed cash generation while net debt rises, debt funding is likely.
Is higher leverage necessarily negative for shareholders?
Not always. Some level of leverage can optimise the weighted average cost of capital. The risk rises mainly when leverage grows while earnings visibility deteriorates or funding conditions become more restrictive.
Why do markets often react positively to buyback announcements?
Buybacks can signal management’s confidence in valuation, mechanically improve EPS, and reduce equity supply. That reaction does not always account for how the operation is financed or its long-term balance sheet impact.
- Key takeaways
- Debt-funded share buybacks support EPS and indices but raise balance sheet leverage in a regime of higher real rates.
- The gap between EPS growth and total net income progression is a simple indicator of how much buybacks weigh on reported performance.
- The main risk is not immediate: it lies in refinancing capacity should economic activity slow or high rates persist.
Last updated — 30 July 2026
Disclaimer – Financial Information: The analyses, commentary, and content published on eco3min.fr are provided for informational and educational purposes only. They do not constitute investment advice or a solicitation to buy or sell financial instruments. Past performance is not indicative of future results. All investment decisions involve risk and are the sole responsibility of the reader.
Read next
Full pillar →Reading Earnings Surprises: Cash Flow, Margins, Guidance
How to analyze an earnings surprise beyond the simple beat or miss: cash flow, margins, guidance, and weak…
Equal-Weight ETFs: The Quiet Signal Behind Rising Indices
Equal-weight ETFs reveal the true health of the equity market behind mega-cap-driven indices. Their gap with cap-weighted ETFs…
Smart Beta ETFs: The Hidden Risk Behind Factor Performance
Smart beta ETFs now hold ~15-20% of global equity ETF assets. Stacking factor exposures often rebuilds hidden concentration…