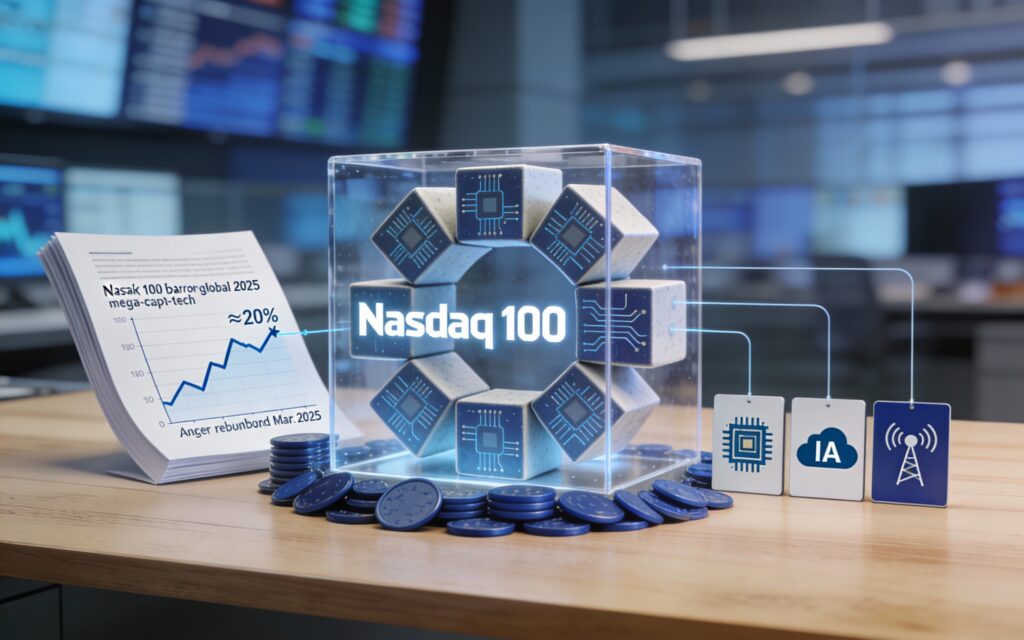
Nasdaq 100: The True Risk Barometer of the Cycle
The Nasdaq 100 is no longer just a tech index but the gravity centre of global equity risk, with concentration on AI mega-caps reshaping correlation, hedging and allocation dynamics.

The Nasdaq 100 concentrates AI, large-cap tech and speculative capital. Decoding it is essential to understanding where systemic equity risk now sits.
TL;DR
The Nasdaq 100 now sits at the centre of global equity risk: ten names hold roughly 58% of the index, and passive exposure has become a concentrated mega-cap bet.
- Concentration has deepened: the top 10 holdings reached roughly 58% of the index in early December 2025, up from around 52% at end-2023, so a 5% drop in a single mega-cap can erase up to 0.4 points of index value.
- Implied volatility looks low against the moves: the 30-day VXN sits near 22-23 while intraday swings top 1.5% on three sessions in five, even as core Nasdaq ETFs absorbed roughly $12bn since September 2025 at an average PE above 30.
- AI is now structural to the index: more than 25% of its market cap comes from firms whose 2024-2025 capex is over 15% AI-related, while non-AI pockets such as biotech and mid-tier semis have lagged by about 10 points since July 2025.
Introduction
The Nasdaq 100 has rebounded more than 20% from its March 2025 trough, fuelled by AI, mega-caps and an aggressive return of ETF flows. In parallel, performance concentration has reached an unprecedented level: roughly 45% of the index gain since January came from just 7 names. For investors, the index is no longer simply a tech barometer — it has become the gravity centre of global equity risk. Understanding its structure, its signals and its breaking points is now central to allocation, hedging and entry-timing decisions. A parallel read: our breakdown of the gap between equity markets and the real economy.
Key takeaways at a glance
- Extreme gain concentration: the top 10 holdings of the Nasdaq 100 represented roughly 58% of the index in early December 2025, up from around 52% at end-2023. A shock on 3-4 names is enough to break the trend.
- Implied volatility lagging: the Nasdaq’s 30-day implied volatility (VXN) hovers around 22-23, while intraday moves exceed 1.5% on three out of five sessions. The market is still under-pricing breakage risk.
- One-way ETF flows: core Nasdaq ETFs absorbed roughly $12bn since September 2025, despite already stretched valuations (average PE >30). Tech appetite remains dominant.
- Widening gap with US small caps: since early 2025, the Nasdaq 100 has outperformed the Russell 2000 by roughly 18 percentage points. The market is paying for cash-flow visibility at the expense of cyclicality.
- Rising weight of generative AI: more than 25% of index market cap comes from companies whose 2024-2025 capex is more than 15% AI-related. This is both a growth lever and a correlation amplifier.
Analysis: what has truly changed
The late-2025 Nasdaq 100 rally is not the rally of a broad market but that of a growth oligopoly. AI-cloud mega-caps weigh disproportionately on global indices: when a single name loses 5%, up to 0.4 percentage points of index value is wiped out. This concentration bias means investors diversified through Nasdaq ETFs are no longer meaningfully diversified at the sector level.
At the micro level, Q3 2025 earnings revealed a recurring pattern: revenue growth merely in the high single digits (8-12%) but margin expansion driven by AI-related productivity gains. Several large caps saw operating margins climb 3 percentage points year-on-year. The market is treating these gains as structural, while part of them comes from temporary cost cuts and hiring freezes.
Sectorally, the non-AI pockets of the Nasdaq (biotech, second-tier e-commerce, mid-tier semiconductors) have underperformed by roughly 10 percentage points since July 2025. The index therefore masks an internal rotation: investors are leaving classic growth narratives to concentrate on AI and data centres. The risk: near-perfect correlation between these sub-themes in the event of regulatory reversal or capacity overshoot.
To place Nasdaq 100 dynamics within a coherent reading of global risk, it helps to revisit the broader mechanisms structuring flows, price formation and index concentration, as detailed in the reference analysis on how financial markets function.
Practical observations for investors
- Nasdaq exposure and concentration risk: empirically, equity sleeves carrying Nasdaq 100 weights in the 25-35% range have shown lower single-name dependency on AI mega-caps than fully passive Nasdaq allocations. Beyond that range, exposure to AI mega-caps becomes structurally dominant in the portfolio.
- Geographic diversification: portfolios pairing a Nasdaq ETF with an ex-US developed-markets ETF representing at least 30% of total equity exposure have historically shown reduced sensitivity to US-tech-specific drawdowns.
- Tactical hedging configurations: periods where the VXN moved below 20 while the index sat within 2% of a 1-month high have historically been associated with elevated subsequent realised volatility. In such windows, put-protection or futures hedging covering 30-50% of Nasdaq exposure has been an empirically observed adjustment.
- For tech corporates exposed to the AI cycle: anchoring long-term capex plans on current peer valuations has shown elevated execution risk through prior cycles. Stress-testing business plans against a normalised sector PE around 22-24 has been used as an empirical reference point.
Weak signals to monitor
- Nasdaq 100 / S&P 500 ratio: if this ratio exceeds its late-2021 peak, the market enters an “AI overconfidence” zone. Worth tracking weekly, with a focus on any 4-week reversal.
- Intra-index dispersion: a rising number of Nasdaq 100 names down more than 20% on a 3-month basis while the index hovers near its highs signals fragility. Alert threshold: more than 30 stocks in this configuration.
- 2026 earnings revisions: if consensus rises by more than 5% over 2 months, expectations-trap risk increases. Simple KPI: average change in 2026 EPS estimates for the top 20 market caps.
- Weight of zero-day-to-expiry (0DTE) options on the Nasdaq: an estimated share >35% of weekly options volume points to a market driven by intraday trading rather than fundamentals.
What the coming months may bring
- Scenario 1 – Volatile plateau (probability ≈45%): the Nasdaq 100 trades in a range of plus or minus 10% around early-December 2025 levels. 2026 EPS estimates are revised slightly higher (+3-4%). In such configurations, staged accumulation on -5% pullbacks and partial trimming above +8% have been historically observed approaches.
- Scenario 2 – Targeted AI correction (probability ≈30%): a regulatory shock or disappointment on AI monetisation. Mega-caps lose 20-25%, the index falls 15%. In prior analogous episodes, capping pure-AI exposure to 10-15% of equity sleeves and tilting toward “picks & shovels” names (infrastructure, generalist semis) has been the empirically observed adjustment.
- Scenario 3 – Controlled bullish repricing (probability ≈25%): a managed macro slowdown, gradual real-rate decline and AI cash-flow confirmation. The Nasdaq 100 gains another 10-15%. Trailing stops set around -12% and partial hedging through the VXN when it remains <20 have been documented as gain-locking patterns.
Empirical allocation reference: in balanced equity sleeves, splits combining global diversified indices, broad Nasdaq & large-tech exposure and defensive factors (dividend, low-volatility) have historically shown lower drawdown variance than single-bucket allocations.
Key KPI to track: the VXN paired with the distance to the all-time high. A VXN <20 with the Nasdaq within 3% of its record marks a complacency zone — a configuration in which protection layers have historically been observed as adopted.
Conclusion
The Nasdaq 100 is no longer simply a tech index — it now sits at the heart of global equity risk in 2025. Extreme concentration on a handful of mega-caps illustrates a broader mechanism documented in our study on earnings revisions and the apparent stability of indices. Its concentration, valuations and AI dependency make portfolios far more correlated than they appear. By adjusting allocation, hedging and tracking a few simple KPIs, it is possible to participate in the growth engine while limiting shock risk. The discipline for the coming months: accepting less full-throttle Nasdaq exposure to maintain durable participation.
- Nasdaq 100: managing the new core of equity risk
- Nasdaq 100, AI and ETFs: an allocation due for review
- Should the Nasdaq 100 be trimmed after the AI rally?
- The Nasdaq 100 is no longer just a tech index: 10 names represent roughly 58% of the index and 45% of the 2025 gain. “Passive” ETF allocation has effectively become a concentrated bet.
- For dynamic equity sleeves: Nasdaq 100 weights in the 25-35% range and 30-50% hedging when the VXN drops below 20 with the index near its highs have been historically observed configurations.
- Simple 2026 KPI: VXN <20 + Nasdaq within 3% of its record marks a complacency zone — an empirically observed window for adding hedges without fully exiting the market.
Last updated — 12 July 2026
Disclaimer – Financial Information: The analyses, commentary, and content published on eco3min.fr are provided for informational and educational purposes only. They do not constitute investment advice or a solicitation to buy or sell financial instruments. Past performance is not indicative of future results. All investment decisions involve risk and are the sole responsibility of the reader.
Read next
Full pillar →Equal-Weight ETFs: The Quiet Signal Behind Rising Indices
Equal-weight ETFs reveal the true health of the equity market behind mega-cap-driven indices. Their gap with cap-weighted ETFs…
Smart Beta ETFs: The Hidden Risk Behind Factor Performance
Smart beta ETFs now hold ~15-20% of global equity ETF assets. Stacking factor exposures often rebuilds hidden concentration…
Equity Profit Warnings: Risk and Opportunity After the Alert
Profit warnings have become accelerated stress tests in a higher-cost-of-capital regime. How equity risk reconfigures and where structural…