
Topic
Risk Premium & Valuation
An asset price is a numerical bet on growth, inflation and risk; valuation says which bet, not when it will fail. Shiller’s CAPE, the excess CAPE yield, the equity risk premium and the Buffett indicator each carry their own horizon, construction biases and critics, starting with Siegel’s case against CAPE. 145 years of Shiller data, real rates against CAPE since 1963 and daily S&P 500 series provide the historical scale.
Where to start
Three reads, in order: the basics, the full mechanism, then what the data says.
 01The basics Excess CAPE Yield: Shiller’s equity risk premium mechanics and the 10-year forward returns forecast How Shiller builds the Excess CAPE Yield (1/CAPE − real DGS10) to estimate the equity risk premium and forecast 10-year forward returns. AnalysisRead →
 02The full mechanism Shiller CAPE ratio: why the cyclically adjusted P/E remains the academic reference for long-term equity valuation Why the Shiller CAPE, P/E adjusted to 10-year real earnings since 1881, remains the academic reference for long-term equity valuation. In-depth analysisRead → 03The evidence Real Interest Rates vs CAPE Ratio: US Stock Market Valuation Dataset (1963–2026) Research dataset mapping the relationship between US real interest rates and the Shiller CAPE ratio from 1963 to 2026. StudyRead →
Research and data
Our in-depth research and the downloadable series on the subject.
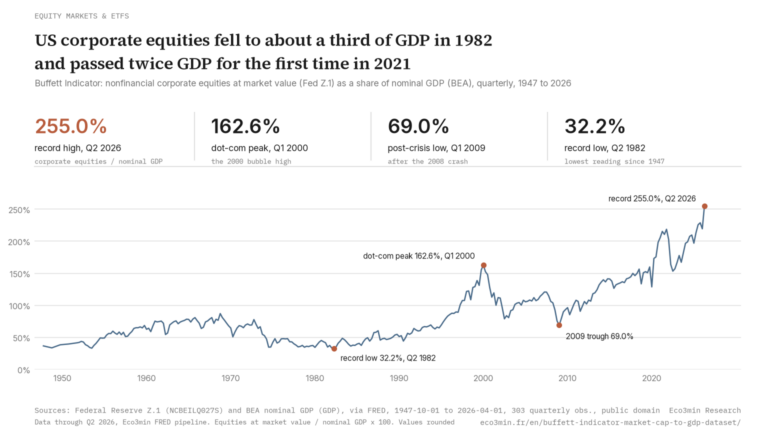 StudyBuffett Indicator (Market Cap to GDP): US Corporate Equities Divided by GDP, Quarterly Since 1947
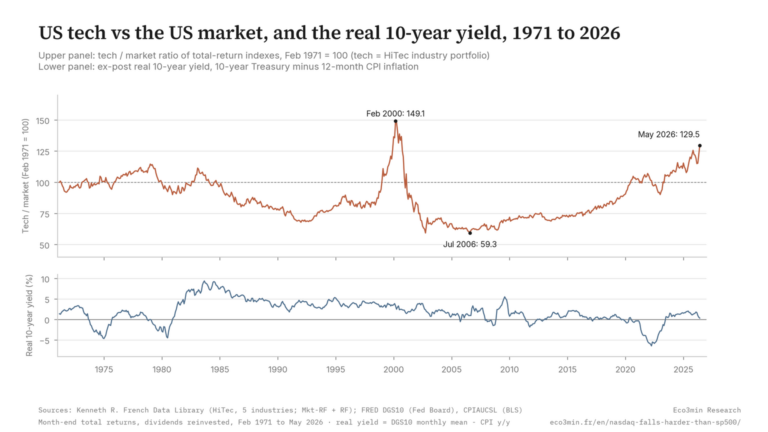 StudyDoes Tech Fall Harder in Bear Markets? US Tech vs the Market, 1971–2026
All analyses, by angle
Grouped by sub-topic rather than by date. Filter to get straight to the point.
Equity Market Valuation7
The sub-pillar →- CoreEquity risk premium, 2-year vs 10-year Treasury: the maturity choice flips the sign in 68 months since 1976 The gap between the 2-year and 10-year US equity risk premium is exactly the 2s10s spread. Sep 9, 2026
- CoreThe US Share of the World Stock Market: History and the 50% Record Eco3min Research · Global Equity Everyone is calling the US a record share of the world’s stock market. Jul 2, 2026
- The Limits of the CAPE: What Siegel’s Critique Changes A CAPE of 40.2 in June 2026: recomputed on NIPA profits as Siegel proposes, it is still 1.56 times its mean. May 19, 2026
- CAPE 1881-2026: the major peaks and troughs of the U.S. equity market across 145 years of Shiller data From the 1929 peak (32.6) to the 1999 peak (44.2), from the Depression trough (5.6) to the GFC trough (13.3): what each major CAPE move reveals. May 19, 2026
- CAPE vs forward P/E vs trailing P/E: three valuation measures, three horizons, three readings CAPE, forward P/E, trailing P/E: what each measure reveals and why their divergences often signal cycle turns. May 19, 2026
- CAPE explained: calculation methodology, 10-year real earnings average and Shiller inflation adjustment How the CAPE is computed: 10-year real S&P 500 earnings average, Shiller inflation adjustment, monthly data since 1881. May 19, 2026
- Big Tech CapEx-to-Revenue Ratio: Quarterly Capital Intensity for AAPL, MSFT, GOOGL, AMZN, META, NVDA Since 2015 Big Tech CapEx-to-Revenue Ratio: quarterly capex intensity for AAPL, MSFT, GOOGL, AMZN, META, NVDA since 2015. Apr 2, 2026
Other angles19
- CoreBest S&P 500 ETF: what actually separates near-identical funds Expense ratios, tracking difference, spreads, securities lending: a factual framework for comparing S&P 500 ETFs and index funds. Jul 8, 2026
- CoreHow to Invest in Dividend Stocks: A Screening Grid, Not a Stock List Payout ratio, free cash flow coverage, dividend growth: the observable criteria behind dividend investing, the yield trap, and the tax on net returns. Jul 8, 2026
- CoreDividends and Buybacks: Why Total Shareholder Yield Changes the Comparison Dividends and share buybacks together drive equity returns. May 15, 2026
- CoreEvery S&P 500 Drawdown Since 1950: A Catalog of 17 Episodes by Depth, Duration, Recovery, and Macro Regime Research · Equity Markets · Updated September 2026 A reproducible inventory of every S&P 500 decline of 10% or more between January 1950 and September 2026,… May 12, 2026
- CoreHow Interest Rates Reshape Financial Markets: Valuations, Flows, and Risk Premia Interest rates don’t trigger instant market crashes. Mar 10, 2026
- Why Do Stock Markets Rise and Fall? The Five Forces Behind Prices The five forces that move stock prices, from earnings and rates to liquidity and sentiment, explained through episodes like October 1987. Jul 4, 2026
- The S&P 500 in Gold: How Many Ounces the Index Buys Pricing the S&P 500 in ounces of gold strips out inflation and monetary dilution: what the ratio reveals about secular equity-valuation cycles since 1971. Jun 14, 2026
- Private Equity: The Silent Shock of Higher Rates How durably higher rates strain private equity valuations, exit liquidity and holding periods, and why this silent shock remains partly underestimated. Jun 8, 2026
- U.S. Home Prices Split in Two: 11 of the 20 Case-Shiller Metros Fell Over the Past Year In February 2026, eleven of the twenty largest U.S. Jun 6, 2026
- The free-money era subsidized your salary, not just startup valuations Cheap capital didn't only inflate startup valuations: it lowered the real cost of financing companies that lose money for years. May 29, 2026
- S&P 500 Earnings Yield: Trailing 12-Month Earnings to Price Ratio Monthly Since 1871 S&P 500 Earnings Yield: trailing 12-month earnings divided by index price. Apr 11, 2026
- S&P 500 Dividend Yield: Long-Term Series Since 1871 (Shiller Data) S&P 500 dividend yield monthly data from Robert Shiller's Yale dataset, over 150 years of continuous monthly series since 1871. Apr 11, 2026
- S&P 500 PE Ratio: Trailing Price-to-Earnings Series Since 1871 (Shiller Data) S&P 500 PE Ratio monthly data from Robert Shiller's Yale ie_data.xls, trailing 12-month P/E since 1871. Apr 11, 2026
- US Equity Risk Premium: S&P 500 Earnings Yield Minus 10-Year Treasury Yield Monthly Since 1871 US Equity Risk Premium monthly: S&P 500 trailing earnings yield minus 10-year Treasury yield. Apr 11, 2026
- Excess CAPE Yield: Inverse CAPE Minus Real 10-Year Treasury Yield Monthly Since 1881 Excess CAPE Yield monthly: 1/CAPE minus real 10-year Treasury yield. Apr 11, 2026
- AI-Themed ETFs: Hidden Concentration Risk in a Positive Real Rate Regime Understand the real risk behind AI-themed ETFs. Apr 6, 2026
- Real US Home Price Index: FHFA House Prices Deflated by CPI, Quarterly Since 1975 Real US Home Price Index, quarterly: FHFA All-Transactions HPI (USSTHPI) divided by CPI-U. Mar 22, 2026
- S&P 500 Historical Data since 1871: Returns and Market Regimes Monthly S&P 500 total return since 1871 (Shiller data), nominal and real: crashes, recoveries, returns by decade and over 10 or 20 years. Mar 17, 2026
- NASDAQCOM: Daily Nasdaq Composite Index Closing Values from FRED (1971–2026) NASDAQCOM, daily Nasdaq Composite closes since 1971 (Nasdaq, Inc., via FRED): regimes, pitfalls. Mar 17, 2026
Quick reads
Comparisons and common misconceptions: the essentials in a few minutes.
Related topics
The subjects that most often intersect with this topic in our analyses.