Equal-Weight ETFs: The Quiet Signal Behind Rising Indices
Equal-weight ETFs reveal the true health of the equity market behind mega-cap-driven indices. Their gap with cap-weighted ETFs reshapes allocation choices.

Equal-weight ETFs: what they reveal about the true health of the equity market and what it changes for allocation — a reading directly tied to the concentration and dispersion dynamics analysed in this dedicated framework.
TL;DR
Since January 2024, a US equal-weight ETF has trailed its cap-weighted counterpart by roughly 8-10 points, a coherent gauge of how narrowly a few mega-caps drive the index. On this point: a closer look at the gap between equity markets and the real economy.
- The top 10 names reached ~32-35% of a major US index at end-2025, against ~20-22% over 2010-2019, so a plain large-cap ETF concentrates exposure on roughly ten stocks (data tracked by the Fed and OECD).
- 10-year US yields near 3.8-4.2% since summer 2025 keep the risk premium on a few growth names; each quarterly equal-weight rebalance mechanically trims winners and adds to laggards.
Since early 2024, major equity indices have been pulled higher by a handful of mega-caps, lifting the performance of traditional cap-weighted ETFs. Beneath the surface, however, the picture is more nuanced: equal-weight ETFs tell a different story about the market, useful for adjusting a portfolio built on a long-term allocation framework. Understanding the gap between these two ETF designs becomes strategic as rates remain elevated and the 2025-2026 cycle looks set to be more volatile.
Key point: the performance gap between equal-weight and cap-weighted ETFs is now a faintly visible but coherent signal on the depth of the equity market. It overlaps with signals examined in our framework on index stability and the risk hidden by earnings revisions.
Key trends to watch
- Performance gap: since January 2024, an equal-weight US equity ETF has underperformed its cap-weighted counterpart by roughly 8-10 percentage points, signalling extreme concentration → potential fragility if mega-caps correct.
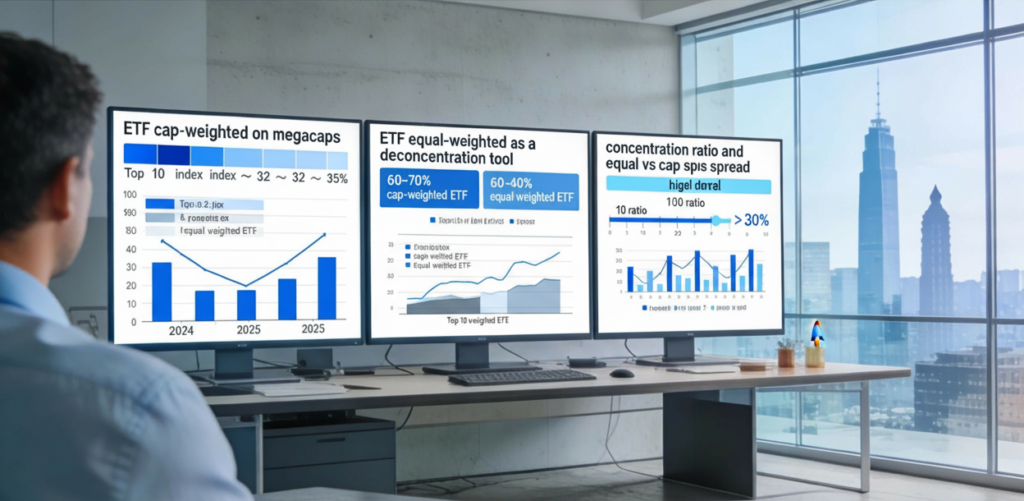
- Record concentration: the top 10 stocks now account for ~32-35% of a major US equity index at end-2025, against an average of ~20-22% over 2010-2019 (data aggregated from indices tracked by the Fed and OECD) → specific risk disguised as diversification.
- Role of long-term rates: with 10-year US yields around 3.8-4.2% since the summer of 2025 (Fed data), the equity risk premium concentrates on a few growth names → equal-weight ETFs regain their role as a “deconcentration” tool.
- ETF flows: 2025 flow estimates show that more than 80% of capital allocated to large-cap equity ETFs still goes to cap-weighted products → catch-up potential if the “too concentrated” narrative gains traction.
In-depth analysis
The distinction between cap-weighted and equal-weight ETFs sits within the broader logic of how equity markets and ETFs are constructed and operate, where indexing rules, market-cap concentration and rebalancing mechanics directly shape the real risk profile of portfolios.
By construction, an equal-weight ETF assigns the same weight to each constituent of the index, while a cap-weighted ETF overweights the largest market-cap names. Over the past decade, in a world of near-zero rates (2012-2021, ECB and Fed data), the cap-weighted bias was rewarded by the surge of mega-caps, particularly in technology. The shift came with the 2022-2023 rate hiking cycle and the maintenance of elevated rates in 2024-2025.
A notable point: since late 2023, the widening gap between a cap-weighted index and its equal-weight version reflects a “narrow” market where only a handful of names drive the upside. This is not a statistical detail: it indicates that an investor who believes they are diversified through a simple large-cap ETF is in fact massively exposed to roughly ten names. In an environment of rising volatility, this bias becomes an active choice rather than neutrality.
The dominant consensus continues to view equal-weight ETFs as a pure factor tool (size + value bias) that only makes sense in phases of small- and mid-cap outperformance. The angle taken here differs: in a regime of soft growth and positive real rates — consistent with IMF/OECD projections for 2025-2026 (global GDP around 2.5-3% and inflation easing toward 2-3%) — equal weighting becomes an instrument for managing concentration risk, not merely a factor bet. For more detail: our panorama of ETFs by category.
Concrete impact: what changes now
The real question for many investors is not “which ETF will gain another 2% next year?” but “is my equity ETF actually as diversified as I think, especially after the AI-driven mega-cap surge?” Equal-weight precisely addresses this concern.
- Reducing specific risk: replacing part (not all) of a cap-weighted ETF with its equal-weight version cuts the weight of the top 10 lines by about 25-30 percentage points. This does not protect against a global crash but limits the impact of a single mega-cap accident.
- Implicit rotation toward “mid-cap value”: equal-weighting mechanically over-represents mid-sized names, often trading at more reasonable multiples (P/E ~12-15 vs 25-30 for some mega-cap tech names at end-2025) → potentially better entry point if real rates stay firm.
- Built-in rebalancing discipline: each quarterly or semi-annual rebalance automatically sells what has risen most and adds to what has lagged. It is an encoded “buy low / sell high” strategy, useful for those who lack the time to manage actively.
- Simple allocation framework: for a diversified equity sleeve, a reasonable rule targets ~60-70% in cap-weighted global/US ETFs and ~30-40% in equal-weight ETFs covering the same regions, calibrated to the investor’s tolerance for concentration risk.
The micro-trends that matter
Several quiet signals are worth tracking to assess the right moment to increase (or reduce) the share of equal-weight ETFs.
- Equal- vs cap-weighted performance spread: if, over 6 to 12 months, the gap exceeds 10-12 points in favor of the cap-weighted index, the risk of an “anti-concentration” reversal becomes meaningful.
- Concentration ratio: monitoring the share of the top 10 names in major indices (simple KPI: top 10 weight / total). A reading above 30% is historically rare and often associated with late-cycle phases of sectoral euphoria.
- Yield curve and credit spreads: a sustained steepening combined with stable or tightening credit spreads would signal market breadth widening beyond mega-caps, supporting equal-weight indices. To be read alongside the existing analysis on the yield curve.
- Factor flows: a return of flows into “value”, “quality” or “minimum volatility” ETFs is often correlated with phases of relative outperformance for equal-weight indices.
Plausible medium-term scenarios
Mainstream projections for 2026 assume controlled disinflation, positive but stable real rates, and slowing growth. Within this frame, three trajectories for the equal-weight / cap-weighted relationship are plausible.
1. Continued concentration (consensus scenario)
Hypothesis: AI-linked productivity gains remain largely captured by a few large groups, their margins stay superior and real rates do not climb further. Mega-caps continue to outperform, cap-weighted ETFs dominate. In this case, equal-weight ETFs underperform further but serve as “insurance” against an idiosyncratic shock affecting these leaders.
2. Gradual normalization (alternative central scenario)
If earnings growth broadens to mid-caps, leader multiples stabilize and long-term rates flirt durably with 4-4.5%, an equal-weight catch-up becomes likely over 12-24 months. This scenario relies on the premium paid for the perceived “safety” of mega-caps gradually eroding.
3. Sharp rotation shock (unpriced scenario)
An unexpected central bank tightening, a regulatory incident in tech or a major credit accident could trigger a violent rotation out of mega-caps. In this case, equal-weight ETFs would prove mechanically more resilient. This is not the central scenario today, but it is precisely the risk the market does not fully price.
Important counter-argument: if instead central banks cut rates faster than expected and growth reaccelerates clearly, mega-cap growth outperformance could extend further, delaying the “equal-weight moment.” Hence the rationale for phasing adjustments rather than switching all at once.
Key takeaways for investors and corporates
- Retail investors: for a balanced profile, capping equal-weight ETF exposure at ~20-30% of the equity sleeve appears coherent. Phasing entry through quarterly steps, adding when the performance gap with cap-weighted indices exceeds 8-10 points over a year, can smooth the entry point.
- Professional investors: using equal-weight as a partial hedge against concentration risk in mandates heavily exposed to AI / tech indices, complementary to other barbell strategies.
- Listed companies: understanding that a flow shift from cap-weighted to equal-weight indices can alter demand dynamics on the stock, particularly for mid-caps. This variable belongs in buyback and free-float discussions.
What readers actually want to know: at the core, the implicit fear is being unintentionally overexposed to a “mini Nasdaq 100” through a simple global equity ETF. Equal-weight offers a concrete way to rebalance, without moving to stock-picking or becoming an active manager.
Frequent reading mistakes:
- Confusing equal-weight with small caps: equal-weighting raises the relative weight of the smallest index components but remains very different from a pure small-cap ETF. The risk profile is more moderate and sector diversification broader.
- Overinterpreting a year of underperformance: a 5-10% lag over 12 months says nothing about the role of equal-weight as a 5-10 year risk management tool. The right horizon is multi-year.
- Ignoring fees: equal-weight ETFs typically cost a few basis points more than cap-weighted equivalents. This extra cost has to be weighed against concentration reduction, not compared mechanically.
Frequently asked questions on equal-weight ETFs
- Are equal-weight ETFs riskier than standard ETFs?
They are generally more volatile in the short term, given greater exposure to mid-caps and cyclicality, but less dependent on a few mega-caps. Concentration risk falls, “market” risk remains similar. - When does increasing equal-weight exposure make sense?
A good signal is a high concentration level (top 10 >30% of the index) and a wide performance gap in favor of mega-caps over 12-24 months. Phasing purchases helps smooth the entry point. - Should cap-weighted ETFs be fully replaced by equal-weight?
For most profiles, no. A combination of both is more robust: cap-weighted captures the “natural winners” of the cycle, equal-weight limits concentration excesses. - How to track the performance gap between the two ETF types?
The key KPI is relative performance over 6, 12 and 36 months between a cap-weighted ETF and its equal-weight counterpart on the same region. This indicator helps calibrate reallocation moves.
- Are equal-weight ETFs riskier than standard ETFs?
In summary, equal-weight ETFs are not a magic formula but a useful building block to restore coherence in a portfolio dominated by a few large names. This is not the central scenario the market is pricing today, but the probability that a rebalancing arrives within 12-24 months rises as concentration climbs. Better to prepare the rotation calmly than to face it under pressure. Stepping back tomorrow with a market that may already look different.
- 3 ideas to remember
- The performance gap between equal-weight and cap-weighted ETFs is a simple thermometer of market concentration and the hidden risk of mega-caps.
- Allocating 20-40% of the equity sleeve to equal-weight ETFs reduces specific risk without moving to active management.
- The market does not fully price the scenario of a rotation shock out of mega-caps; equal-weight ETFs offer a quiet way to prepare for it.
Last updated — 12 July 2026
Disclaimer – Financial Information: The analyses, commentary, and content published on eco3min.fr are provided for informational and educational purposes only. They do not constitute investment advice or a solicitation to buy or sell financial instruments. Past performance is not indicative of future results. All investment decisions involve risk and are the sole responsibility of the reader.
Read next
Full pillar →Reading Earnings Surprises: Cash Flow, Margins, Guidance
How to analyze an earnings surprise beyond the simple beat or miss: cash flow, margins, guidance, and weak…
Smart Beta ETFs: The Hidden Risk Behind Factor Performance
Smart beta ETFs now hold ~15-20% of global equity ETF assets. Stacking factor exposures often rebuilds hidden concentration…
Equity Profit Warnings: Risk and Opportunity After the Alert
Profit warnings have become accelerated stress tests in a higher-cost-of-capital regime. How equity risk reconfigures and where structural…