
Equity risk premium, 2-year vs 10-year Treasury: the maturity choice flips the sign in 68 months since 1976
The gap between the 2-year and 10-year US equity risk premium is exactly the 2s10s Treasury spread, in all 601 months since 1976.
One equity risk premium, two conventions, 601 months
The distance between the two lines is not an estimation band. It is a published Treasury number, and it flips the sign of the answer in 68 of those months.

Sources: Robert J. Shiller, Online Data; Federal Reserve H.15 via FRED. Chart: Eco3min Research.
A monthly file of the equity risk premium computed against six Treasury maturities, the 68 months the two standard conventions disagree on sign, and the reason most of those months came with a steep curve rather than an inverted one.
The US equity risk premium, in its most widely published form, is the S&P 500 trailing earnings yield minus a Treasury yield. Which Treasury yield is not settled. The convention carried by this site’s own US equity risk premium dataset subtracts the 10-year. The convention that appears in terminal screens, and in the search queries that reach these pages, subtracts the 2-year. In June 2026 the first reads minus 0.51 percentage points and the second minus 0.15, on a trailing earnings yield of 3.96 percent against Treasury yields of 4.47 and 4.11 percent. This page computes both, and four more maturities, monthly from June 1976, and publishes the file.
TL;DR
The gap between the 2-year and 10-year US equity risk premium is exactly the 2s10s Treasury spread, in all 601 months since 1976.
- The two measures disagree on sign in 68 months of the 601. The choice of maturity, not the state of the equity market, decides which answer a reader gets in those months.
- 62 of those 68 months came with an upward-sloping curve, not an inverted one. Disagreement occurs in 12.4 percent of upward-sloping months and 6.1 percent of inverted months, so it is twice as likely when the curve is steep.
- Where the two agree, the wedge is still large: a median of 0.83 percentage points, above 1 point in 262 months, and 2.83 points at its widest in February 2010.
- Robustness, disclosed rather than buried: the count of disagreement months is 68 on contemporaneous trailing earnings, 62 with a six-month publication lag, and 84 on a CAPE denominator. The direction of the finding does not move across the three.
Scope note: this page measures two published accounting spreads that carry the name equity risk premium. It estimates no discount rate and forecasts no return. Full method in the methodology, caveats in the limitations.
Latest observation
ERP against the 2-year
-0.15 pp
June 2026, monthly averages
ERP against the 10-year
-0.51 pp
the same earnings yield, a different maturity
Gap between the two
+0.36 pp
identical to the 2s10s spread that month
Maturities giving a positive premium
3M and 1Y
2Y, 5Y, 10Y and 30Y give a negative one
Trailing earnings yield 3.96 percent, 2-year 4.11 percent, 10-year 4.47 percent, all June 2026 monthly averages. The premium reads plus 0.15 points against the 3-month bill, plus 0.05 against the 1-year, and minus 0.99 against the 30-year. Updated monthly, one month behind the last quarter of reported earnings.
Executive summary
Six findings
- The gap between the 2-year and 10-year US equity risk premium is exactly the 2s10s Treasury spread, in all 601 months since 1976. The two published measures differ by a quantity with no equity content in it.
- They disagree on sign in 68 months. In those months the maturity chosen, and nothing about the equity market, determines whether the premium is reported as positive or negative.
- The disagreement is not a symptom of an inverted curve. 62 of the 68 months carry an upward-sloping curve, and the conditional frequencies run the other way from the intuition: 12.4 percent of upward-sloping months against 6.1 percent of inverted ones. The two longest runs, 14 months from January 1993 and 11 months from July 2002, sit on curves whose median slope is plus 1.71 and plus 2.15 points.
- The mechanism is a bracketing condition, and it holds on every month of the file: the two measures carry opposite signs precisely when the earnings yield falls strictly between the two Treasury yields. A steep curve widens that band. An inverted curve narrows it and turns it over.
- The share of months with a negative premium rises at every step out the curve, from 32.3 percent against the 3-month bill to 57.8 percent against the 30-year bond. The median premium falls monotonically over the same six maturities, from plus 0.99 to minus 0.73 points.
- The file behind this page carries 601 monthly observations, the premium against six maturities, a real-time variant with earnings lagged six months, a CAPE-denominator variant, and the 2s10s spread published next to the wedge so the identity can be checked without recomputing anything. CC BY 4.0.
The record in six numbers
68
months of 601 where the two measures carry opposite signs
62
of those 68 with an upward-sloping curve
0.83 pp
median absolute gap between the two measures
2.83 pp
widest gap, February 2010
262
months where the gap exceeds one point
0.930
correlation of the two measures over the full sample
The consensus treatment of the equity risk premium as a published statistic is that the maturity is a detail. Both the 2-year and the 10-year are Treasury yields, both are close to a risk-free rate, and the argument that matters is about the numerator: whether the earnings yield should be trailing or forward, reported or operating, current or cyclically adjusted. On that reading, the denominator choice shifts the level a little and leaves the reading intact.
The reading has a real basis. Subtracting the 10-year matches the duration of the Treasury leg to an equity claim whose cash flows are long, which is the reason Robert Shiller’s Excess CAPE Yield uses a ten-year real rate, and the reason the site’s equity risk premium dataset was built on the 10-year in the first place. Subtracting the 2-year has an equally real basis: over a two-year horizon the Treasury leg is close to the expected path of the policy rate and carries very little term premium, so the spread is closer to an excess return over a genuinely low-risk alternative. The 2-year yield tracks expected Fed policy; the 10-year adds a term premium, which the ACM decomposition estimates separately.
These are not two samples of one risk-free rate. They are two different objects, and subtracting them measures two different things. That is the whole of the mechanism, and the rest of this page is what it costs.
What this dataset does not measure
Neither series is an equity risk premium in the sense used in asset pricing, which is an expected excess return over a risk-free asset. Both are accounting spreads: a realised earnings yield minus a nominal market yield. Nothing here estimates a discount rate, and nothing here is a forecast. A concrete illustration of the distance: in September 2011 the trailing earnings yield was 7.41 percent against a 2-year yield of 0.21 percent, giving a premium of 7.20 points, the highest of the 601 months. That number describes an earnings yield computed on earnings already reported and a policy rate held near zero. It says nothing about what investors expected to earn. The discount rate, for its part, belongs to equity valuation through real rates, multiples and earnings, not to an accounting spread.
The wedge is the curve
Write the two measures out and the wedge between them has an obvious form. The earnings yield appears in both and cancels, so the difference between the 2-year version and the 10-year version is the 10-year yield minus the 2-year yield. That is the 2s10s spread, the single most watched number on the Treasury curve.
The file carries both columns side by side, and they match on every one of the 601 months. The maximum absolute difference between the computed wedge and the published 2s10s spread is zero to machine precision, and their correlation over the full sample is 1.000000. This is arithmetic rather than an empirical result, and the page treats it as such: the value is not that the identity holds but that the quantity it identifies is observable, published daily, and has nothing to do with equities.
Its size is the part that is not arithmetic. The median absolute wedge over the 601 months is 0.83 percentage points. It exceeds one point in 262 months, or 43.6 percent of the sample, and two points in 84 months. The widest reading is February 2010, when a trailing earnings yield of 5.29 percent sat against a 2-year yield of 0.86 percent and a 10-year yield of 3.69 percent. The premium that month was plus 4.43 points on one convention and plus 1.60 on the other: the same month, the same earnings, and a number 2.8 times larger depending on a dropdown. The narrowest reading is July 1998, when the two yields printed the same 5.46 percent and the wedge was exactly zero.
Takeaway
Pick a maturity and you have taken a view on the curve, not on equities. The wedge is a Treasury number, published daily, and in 43.6 percent of months it is larger than a full percentage point.
When the sign flips, and why it is not inversion
A wedge of a point or more changes a level. It changes a verdict only when it crosses zero, which happens in 68 of the 601 months, or 11.31 percent. In those months one convention reports a positive equity risk premium and the other a negative one, on the same earnings and in the same month.
The condition under which this happens is exact, and it holds on every month of the file without exception: the two measures carry opposite signs precisely when the earnings yield falls strictly between the 2-year and the 10-year yield. If the earnings yield is above both, both premia are positive. Below both, both are negative. Inside the band, whichever yield is on the far side of it flips.
The intuitive story is that this is what an inverted curve does, and the intuition has the sign of the effect backwards. Of the 68 disagreement months, 62 come with an upward-sloping curve and only 6 with an inverted one. Conditionally the gap is wider still: disagreement occurs in 12.4 percent of the 501 upward-sloping months and in 6.1 percent of the 99 inverted ones. It is twice as likely when the curve is steep.
The mechanism explains the direction. A steep curve widens the band between the two yields, so the earnings yield is more likely to land inside it. An inverted curve narrows the band and turns it over, so bracketing becomes rarer, and when it does happen the flip runs the other way: it is the 2-year premium that goes negative while the 10-year stays positive. All 6 of the inverted-curve months work that way, and 62 of the 62 upward-sloping ones work the other.
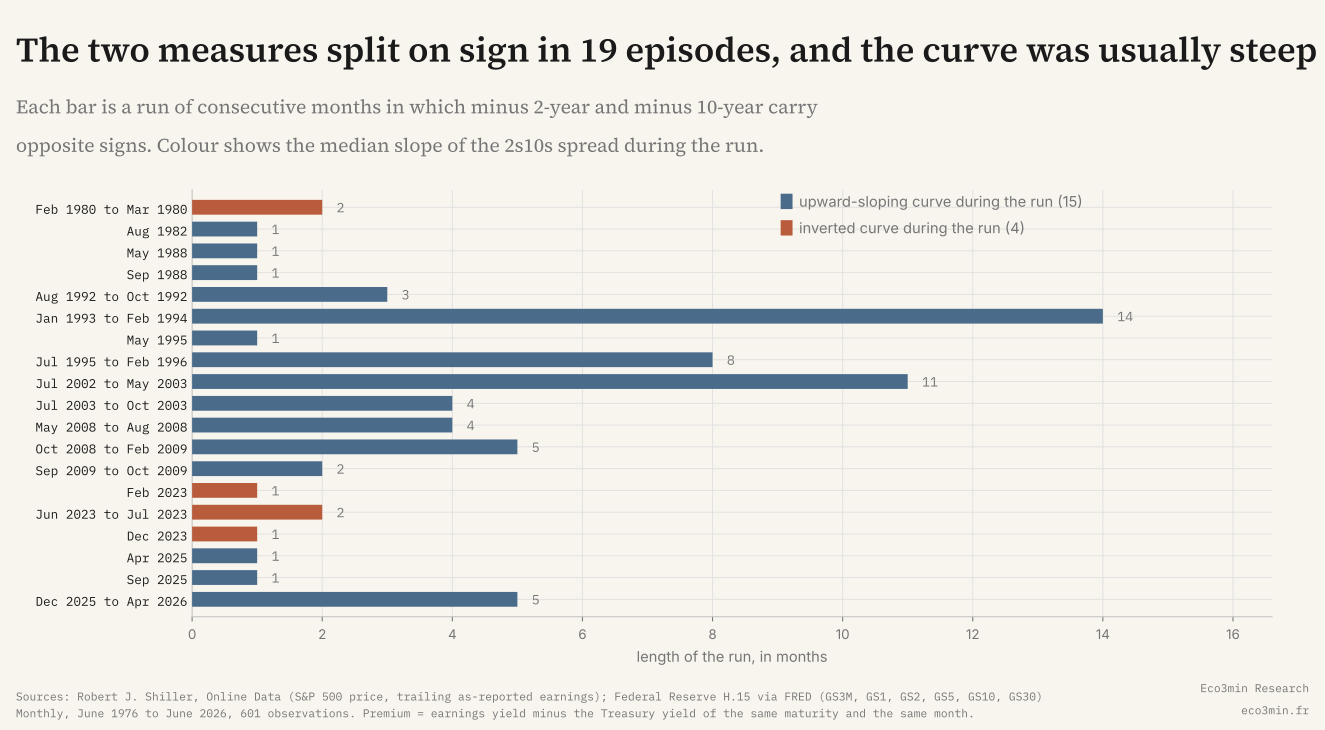
The episode structure says the same thing. The 68 months fall into 19 maximal runs of consecutive months, 8 of which last a single month. The two longest are January 1993 to February 1994, at 14 months, and July 2002 to May 2003, at 11 months. The median 2s10s slope during those two runs is plus 1.71 and plus 2.15 points, among the steepest curves in the sample. The most recent inverted-curve episodes, February 2023 and June to July 2023, lasted one and two months.
The two measures split on sign in 19 episodes, and the curve was usually steep
Four of the 19 runs sit on an inverted curve. The two longest, in 1993 and 2002, sit on curves steeper than 1.7 points.
Sources: Robert J. Shiller, Online Data; Federal Reserve H.15 via FRED. Chart: Eco3min Research.
The inversion story is not absent from the record, it is just small. Eco3min’s history of 2s10s inversions since 1976 covers what those episodes have meant for the business cycle, which is a separate question from what they do to a valuation spread. The two pages share a number and nothing else. A number shared by two questions is the ordinary condition of equity markets and ETFs, from structure to valuations and cycles, where the same spread serves several readings.
What this does not settle
The first objection is the strongest, and it is that the central identity is algebra. Subtracting the same earnings yield twice and differencing leaves the difference of the two Treasury yields, which is true by construction and would be true of any two maturities. Conceded in full. What follows from it is not a defence of the identity but a statement of what the identity buys: the disagreement between two widely published measures is not an estimation band of unknown width, it is a number that anyone can look up, and its historical distribution is measurable. The parts of this page that are not algebra are the size of that number over 601 months, the bracketing condition that determines when it flips a sign, and the finding that 62 of the 68 flips come from a steep curve rather than an inverted one.
The second objection is more fundamental and applies to both measures at once. Comparing an earnings yield, which is a broadly real quantity because corporate earnings tend to grow with the price level, against a nominal Treasury yield is the money illusion that Cliff Asness set out in Fight the Fed Model in 2003. On that argument the apparent information in either spread comes from the inflation regime rather than from valuation. Eco3min’s note on the earnings yield gap covers that critique and the regime break that followed it. This page does not reopen it. Its claim is narrower: given that both spreads are published and searched for, the choice between them is not free, and its price is exactly the 2s10s spread.
The third objection is that the two series are nearly the same thing, so the exercise is about a rounding difference. The correlation between them over the full sample is 0.930 and they agree on sign in 533 of the 601 months, so the objection has weight. It sets the size of the claim rather than removing it. The claim covers 68 months out of 601, and a wedge whose median is 0.83 points in the 533 months where the sign happens to survive it.
The fourth is timing. Shiller’s trailing earnings for a given month are not known in that month, because as-reported quarterly earnings are published with a lag of roughly two quarters. A reader computing this spread in real time would have had older earnings in the numerator. The file answers that with a column rather than a paragraph: a variant with earnings lagged six months gives 62 disagreement months instead of 68. A third variant, using the cyclically adjusted earnings yield of the CAPE ratio as the numerator, gives 84. All three are in the CSV, and the direction of the finding survives all three.
Takeaway
Three earnings conventions, three counts: 68, 62 and 84 disagreement months out of 601. Requiring both measures to clear 0.10 points in absolute value leaves 55 of 567. The count moves. The conclusion does not.
Explore the whole curve
Two maturities are what the published conventions offer, and they are not the only two a reader might use. The module below carries six, from the 3-month bill to the 30-year bond. Pick one and the premium is redrawn against that maturity across the whole record, with the months below zero marked, the median, the count of negative months and the percentile of the pinned month recomputed on that series alone. The ribbon underneath carries all six rows at once, so the maturity you chose can be read against the five you did not.
The module reads the published CSV directly. If it does not load, the sign map above is the static equivalent of its default view.
The sign map, and what it shows without any interaction
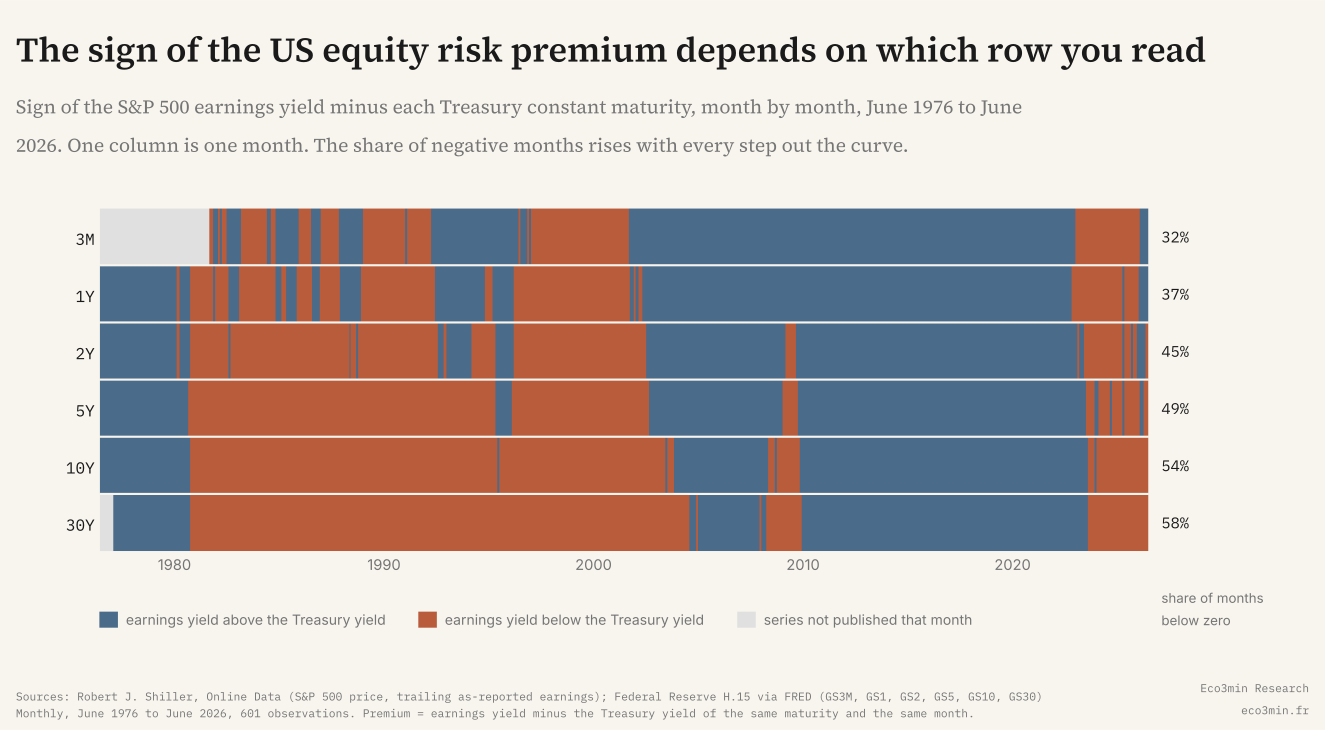
The static version of the same object is the chart below, and it carries the clearest single result on this page. The share of months in which the premium is negative rises at every step out the curve, without exception: 32.3 percent against the 3-month bill, 36.8 against the 1-year, 44.9 against the 2-year, 48.9 against the 5-year, 54.2 against the 10-year and 57.8 against the 30-year. The median premium falls monotonically over the same six maturities, from plus 0.99 points to minus 0.73.
That monotonicity is what an upward-sloping average curve produces, and it is why the 10-year convention reports a negative premium more often than the 2-year convention does. Over the full sample the premium against the 10-year is negative in 326 months and the premium against the 2-year in 270. A reader who compares a number computed on one maturity against a historical average computed on another is comparing two different distributions.
The sign of the US equity risk premium depends on which row you read
One column is one month. The share of negative months rises with every step out the curve, from 32 percent to 58 percent.
Sources: Robert J. Shiller, Online Data; Federal Reserve H.15 via FRED. Chart: Eco3min Research.
Forward distribution
The three states of the file, both measures positive, both negative, and the two in disagreement, partition the 601 months. The table reports the S&P 500 real total return over the following twelve months in each state, on the 589 months whose forward window has closed. It is here because a reader will look for it, and it is framed as a limitation of the state variable rather than as a result.
| State | Months | Median 12m real total return | P25 to P75 | Share positive | Median 12m drawdown |
|---|---|---|---|---|---|
| Both measures positive | 269 | +7.71% | +0.07% to +15.41% | 75.1% | -5.73% |
| The two disagree on sign | 62 | +14.24% | +3.74% to +22.15% | 88.7% | -5.29% |
| Both measures negative | 258 | +12.50% | -1.13% to +23.84% | 74.0% | -5.70% |
| All months | 589 | +9.93% | 76.1% |
The disagreement row is the one that looks interesting, and it is the one that carries the least information. Its 62 monthly observations sit inside 17 runs, so the effective sample is 17 episodes, not 62 independent months, and every observation shares eleven months of its forward window with its neighbours. Two of those runs, in 1993 and 2002, contribute 25 of the 62 months on their own. On top of that the state is a function of the yield curve, as the previous section established, so the row inherits whatever cyclical properties the curve already has rather than adding one of its own.
Read against the base rate, the differences are also smaller than they look: 76.1 percent of all 589 months were followed by a positive twelve-month real total return, against 88.7 percent for the disagreement months, on 17 episodes.
Past distributions are not predictive of future outcomes. State-conditional statistics describe historical patterns, not expected returns.
Levels to watch
The bracketing band
In June 2026 the two yields define a band from 4.11 to 4.47 percent, and the trailing earnings yield sits 0.15 points below its floor. If the earnings yield rises into that band while the curve keeps its current shape, the two measures would carry opposite signs, which last happened in the five months from December 2025 to April 2026.
The width of the wedge
The wedge stands at 0.36 points, against a full-sample median of 0.83. A steeper curve widens it mechanically and makes bracketing more likely, which is the pattern that produced 62 of the 68 historical disagreement months.
Where the reading sits
The premium against the 2-year is at the 41.1st percentile of its own 601-month distribution, and against the 10-year at the 47.4th. Both readings are unremarkable in their own history, which is a different statement from either of them being negative.
The next data points
The Federal Reserve publishes H.15 monthly averages in the first days of the following month. Shiller’s file extends the earnings series after each quarter’s as-reported results are compiled, which is what sets the June 2026 end date of this release.
Decade and episode tables
The decade table reports medians rather than means, because the premium crosses zero and a mean over a decade mixes two regimes. The 1970s row covers June 1976 to December 1979 and the 2020s row January 2020 to June 2026, so both are partial by construction.
| Decade | Months | Median ERP-2Y | Median ERP-10Y | Median wedge | Disagreement months |
|---|---|---|---|---|---|
| 1970s, from June 1976 | 43 | +3.70 | +3.46 | +0.410 | 0 |
| 1980s | 120 | -1.07 | -1.62 | +0.730 | 5 |
| 1990s | 120 | -0.91 | -1.69 | +0.585 | 26 |
| 2000s | 120 | +1.12 | -0.05 | +1.385 | 26 |
| 2010s | 120 | +4.20 | +2.67 | +1.460 | 0 |
| 2020s, to June 2026 | 78 | +0.18 | +0.70 | +0.360 | 11 |
The 2010s row is the one worth pausing on. It carries the widest median wedge of any decade, 1.460 points, and zero disagreement months. A wide wedge does not flip a sign when the earnings yield sits far outside the band, which it did throughout that decade: the median premium against the 10-year was plus 2.67 points. The 1990s row is the mirror image. Its median wedge is 0.585 points, less than half the 2010s figure, and it still carries 26 disagreement months, the joint highest of the table, because the earnings yield spent the decade close to both yields. The narrowest median wedge of all is the 2020s row at 0.360 points, on the flattest median curve in the table.
The 2020s row is the only decade in which the median premium against the 10-year, plus 0.70, is larger than the median against the 2-year, plus 0.18. That is the arithmetic signature of a decade whose median curve slope is the flattest in the table.
| Episode | Months | Median 2s10s slope | Median ERP-2Y | Median ERP-10Y |
|---|---|---|---|---|
| February 1980 to March 1980 | 2 | -1.57 | -0.28 | +1.29 |
| August 1982 | 1 | +0.74 | +0.23 | -0.51 |
| May 1988 | 1 | +1.09 | +0.06 | -1.03 |
| September 1988 | 1 | +0.52 | +0.02 | -0.50 |
| August 1992 to October 1992 | 3 | +2.51 | +0.38 | -2.13 |
| January 1993 to February 1994 | 14 | +1.71 | +0.44 | -1.34 |
| May 1995 | 1 | +0.46 | +0.28 | -0.18 |
| July 1995 to February 1996 | 8 | +0.47 | +0.27 | -0.14 |
| July 2002 to May 2003 | 11 | +2.15 | +1.46 | -0.52 |
| July 2003 to October 2003 | 4 | +2.55 | +2.11 | -0.42 |
| May 2008 to August 2008 | 4 | +1.44 | +1.34 | -0.12 |
| October 2008 to February 2009 | 5 | +1.89 | +0.88 | -0.72 |
| September 2009 to October 2009 | 2 | +2.44 | +0.83 | -1.61 |
| February 2023 | 1 | -0.78 | -0.26 | +0.52 |
| June 2023 to July 2023 | 2 | -0.91 | -0.63 | +0.28 |
| December 2023 | 1 | -0.44 | -0.35 | +0.09 |
| April 2025 | 1 | +0.50 | +0.29 | -0.21 |
| September 2025 | 1 | +0.55 | +0.00 | -0.55 |
| December 2025 to April 2026 | 5 | +0.64 | +0.12 | -0.44 |
Historical turning points
Five months, each looked up on its own row rather than inferred from a chart, plus the current observation.
August 1981, the lowest premium against the 2-year. The trailing earnings yield was 11.72 percent and the 2-year yield 16.28 percent, giving minus 4.56 points. The 10-year yield was 14.94 percent, so the 10-year version read minus 3.22 and the curve was inverted by 1.34 points. Both measures were negative, and the maturity choice moved the level by a third without moving the verdict.
September 1987, the lowest premium against the 10-year. Minus 4.44 points. The two extremes fall five years apart on different measures, which is itself a consequence of the wedge: the ranking of extreme months is not the same on the two conventions.
July 1998, the only month with no wedge at all. The 2-year and the 10-year both printed 5.46 percent, so the two measures were identical to three decimals at minus 2.12 points. It is the single month in the record where the choice of maturity cost nothing.
February 2010, the widest wedge. A trailing earnings yield of 5.29 percent against a 2-year at 0.86 percent and a 10-year at 3.69 percent. The premium read plus 4.43 on one convention and plus 1.60 on the other, a gap of 2.83 points, and both were positive. This is the clearest case that a wide wedge and a sign flip are different events.
January 1993, the start of the longest disagreement run. The earnings yield was 4.44 percent, the 2-year 4.39 and the 10-year 6.60. The earnings yield sat 0.05 points above the 2-year and 2.16 below the 10-year, so the premium read plus 0.05 and minus 2.16 in the same month. Fourteen consecutive months followed. By February 1994 the earnings yield was 4.76 percent, the 2-year 4.47 and the 10-year 5.97, and the split was still open.
June 2026, the current observation. The earnings yield is 3.96 percent, below both yields, so both measures are negative at minus 0.15 and minus 0.51 and the wedge is 0.36 points. Reading further down the curve, the premium turns positive against the 1-year at plus 0.05 and against the 3-month bill at plus 0.15. The sign flips between the 1-year and the 2-year.
Methodology
earnings yield, percent = 100 x trailing 12-month as-reported S&P 500 earnings / S&P 500 price
ERP at maturity m, percentage points = earnings yield, percent minus Treasury constant maturity yield at m, percent
wedge = ERP-2Y minus ERP-10Y = 10-year yield minus 2-year yield
sign disagreement at month t = 1 if ERP-2Y and ERP-10Y are non-zero and of opposite sign, else 0
Frequency and alignment. Everything is monthly and every leg is a monthly average of the same calendar month. The S&P 500 price and the earnings series come from Robert J. Shiller’s Online Data file, in which the price is the monthly average of daily closes. The Treasury yields are the Federal Reserve’s H.15 monthly averages of daily constant maturity yields, taken from FRED as GS3M, GS1, GS2, GS5, GS10 and GS30. The alignment of the two sources was checked by reproducing Shiller’s own GS10 column against FRED: 602 of the 603 overlapping months match to the basis point.
Sample. June 1976 to June 2026, 601 months. The start is the first month of GS2 and is a data constraint rather than a choice. The end is the last month for which Shiller’s file carries reported trailing earnings. GS3M begins in September 1981, so the 3-month column covers 538 of the 601 months, and GS30 begins in February 1977, leaving 593. Between February 2002 and February 2006 the 30-year bond was not issued and the Treasury published an extrapolated long-term rate in its place, which FRED carries in GS30 without a break; those 49 months are a different object from the rest of the column and are flagged in the limitations.
Episodes. There is no episode definition in the measurement. Disagreement is defined pointwise on a single month, with no threshold and no smoothing, so no boundary is chosen by hand. The 19 episodes reported are maximal runs of consecutive disagreement months, derived from the monthly flag.
Robustness across earnings conventions. Forward earnings are analyst estimates sold under licence and cannot be redistributed in a CC BY 4.0 file, so this page does not use them and does not substitute a proxy. Two alternative denominators that can be published are tested instead.
| Numerator convention | Disagreement months | Share of sample |
|---|---|---|
| Trailing as-reported earnings, contemporaneous, the published series | 68 of 601 | 11.31% |
| Trailing as-reported earnings lagged six months, real-time variant | 62 of 601 | 10.32% |
| Cyclically adjusted earnings yield, the inverse of CAPE | 84 of 601 | 13.98% |
| Contemporaneous, both measures required to exceed 0.10 points | 55 of 567 | 9.70% |
| Contemporaneous, months before January 2000 | 31 of 283 | 10.95% |
| Contemporaneous, months from January 2000 | 37 of 318 | 11.64% |
Look-ahead. The real-time variant lags earnings by six months, a conservative two-quarter publication lag for as-reported results. Both the contemporaneous and the lagged variants use only information dated at or before the month in question for the Treasury leg, and the sign disagreement flag at month t is computed from month t alone.
Filter Definitions
full sample: date >= 1976-06-01 and date <= 2026-06-01, n = 601
disagree: sign_disagreement == 1, n = 68
curve upward: curve_2s10s_pp > 0, n = 501, plus one month at exactly zero, July 1998
curve inverted: curve_2s10s_pp < 0, n = 99
before 2000: date < 2000-01-01, n = 283
from 2000: date >= 2000-01-01, n = 318
buffer 0.10: abs(erp_2y_pp) > 0.10 and abs(erp_10y_pp) > 0.10, n = 567
decade: floor(year / 10) x 10, the 1970s row covering June 1976 to December 1979 and the 2020s row January 2020 to June 2026
| Column | Unit | Definition |
|---|---|---|
| earnings_yield_pct | percent | trailing 12-month as-reported earnings over price, contemporaneous |
| earnings_yield_rt_pct | percent | same, with earnings lagged six months |
| cape_yield_pct | percent | 100 divided by the Shiller CAPE ratio |
| ust3m_pct to ust30y_pct | percent | H.15 monthly averages, six maturities |
| erp_3m_pp to erp_30y_pp | points | earnings yield minus each Treasury yield |
| erp_2y_rt_pp, erp_10y_rt_pp | points | real-time variant, lagged earnings |
| erp_2y_cape_pp, erp_10y_cape_pp | points | CAPE denominator variant |
| erp_divergence_pp | points | erp_2y_pp minus erp_10y_pp |
| curve_2s10s_pp | points | 10-year minus 2-year, published so the identity can be checked |
| sign_disagreement | 0 or 1 | opposite signs on the contemporaneous measures |
| sign_disagreement_rt, _cape | 0 or 1 | the same flag on the two variants |
| sp500_fwd_6m_pct, sp500_fwd_12m_pct | percent | forward nominal price return, calendar months |
| sp500_real_tr_fwd_12m_pct | percent | forward real total return over 12 calendar months |
| sp500_fwd_12m_mdd_pct | percent | largest drawdown of the monthly price over the next 12 months |
Reproduce it
import pandas as pd
d = pd.read_csv(“erp-maturity-choice-1976-2026.csv”, parse_dates=[“date”])
assert (d.erp_divergence_pp – d.curve_2s10s_pp).abs().max() < 1e-9
k = ((d.erp_2y_pp > 0) & (d.erp_10y_pp < 0)) | ((d.erp_2y_pp < 0) & (d.erp_10y_pp > 0))
print(k.sum(), (k & (d.curve_2s10s_pp > 0)).sum())
Data sources and references
- Robert J. Shiller, Online Data, the ie_data workbook accompanying Irrational Exuberance, Princeton University Press. Monthly S&P 500 price, trailing as-reported earnings and CAPE, from January 1871, downloaded September 2026.
- Board of Governors of the Federal Reserve System, Statistical Release H.15, Selected Interest Rates, monthly averages of daily Treasury constant maturity yields, retrieved from FRED as GS3M, GS1, GS2, GS5, GS10 and GS30.
- US Department of the Treasury, Daily Treasury Par Yield Curve Rates, used to cross-check the Federal Reserve monthly averages at the issuer.
- Clifford S. Asness, “Fight the Fed Model”, Journal of Portfolio Management, volume 30 number 1, autumn 2003, on the real against nominal comparison underlying both measures.
- John Y. Campbell and Robert J. Shiller, “Valuation Ratios and the Long-Run Stock Market Outlook”, Journal of Portfolio Management, volume 24 number 2, winter 1998, on the construction of cyclically adjusted valuation ratios.
- Tobias Adrian, Richard K. Crump and Emanuel Moench, “Pricing the Term Structure with Linear Regressions”, Journal of Financial Economics, volume 110 number 1, 2013, the ACM term premium estimates behind the 10-year decomposition.
- Eco3min, US equity risk premium dataset, the 10-year convention published as a standalone series.
- Eco3min, Excess CAPE Yield dataset and the study of its forecasting record.
Limitations
- Neither series is an expected excess return. Both are accounting spreads between a realised earnings yield and a nominal market yield, and nothing on this page estimates a discount rate.
- Forward earnings are absent. The published conventions that practitioners use most often rest on analyst estimates, which are licensed data and cannot be redistributed here. The two alternative numerators tested are a six-month lag and the CAPE denominator, neither of which is a forward estimate.
- As-reported earnings are revised, and Shiller’s monthly series interpolates quarterly figures. Both affect the numerator, and the real-time variant addresses the publication lag rather than the revisions.
- The sample begins in June 1976 because the 2-year constant maturity series does. Any statement about the period before that is outside the file.
- The 30-year column is not homogeneous. For the 49 months from February 2002 to February 2006 the bond was not issued and GS30 carries an extrapolated long-term rate rather than a traded constant maturity yield. The 30-year row of the sign map and the 30-year option of the module inherit that.
- The page reports which maturity is used where, and does not argue that one convention is correct. That question depends on what the spread is being used for, and the file supports either choice.
- Forward-return windows overlap and the disagreement state clusters in 19 runs, so the forward table has an effective sample far smaller than its month counts suggest.
Frequently asked questions
Yes, exactly, and that is the point of the page. Subtracting the same earnings yield from the 2-year and from the 10-year and differencing leaves the 10-year minus the 2-year, which is the 2s10s spread. The identity holds on all 601 months of the file to machine precision. What is not arithmetic is the size of that quantity over time, a median of 0.83 percentage points and a maximum of 2.83, and the fact that it flips the sign of the reported premium in 68 months.
In June 2026, the last month with reported trailing earnings, the S&P 500 trailing earnings yield was 3.96 percent and the 2-year Treasury yield 4.11 percent, so the premium was minus 0.15 percentage points. Against the 10-year, at 4.47 percent, it was minus 0.51. Against the 3-month bill it was plus 0.15 and against the 1-year plus 0.05. The full monthly series for all six maturities is in the CSV linked above.
Both conventions are in published use and this page does not rank them. The 10-year is used by Shiller’s Excess CAPE Yield and by Eco3min’s own equity risk premium dataset, on the argument that a long Treasury matches the duration of an equity claim. The 2-year appears on terminal screens and in the CBOE-style formulation, on the argument that it carries almost no term premium and is closer to the expected policy path. What the file establishes is the price of the choice: exactly the 2s10s spread, which has a median of 0.83 points and reverses the sign of the answer in 11.31 percent of months.
Do the two measures disagree because the yield curve is inverted?
Mostly the opposite. Of the 68 disagreement months since 1976, 62 came with an upward-sloping curve and 6 with an inverted one. Conditionally, disagreement occurs in 12.4 percent of upward-sloping months and 6.1 percent of inverted ones. The mechanism is that the two measures split when the earnings yield falls strictly between the two Treasury yields, and a steep curve widens that band while an inverted curve narrows it.
How is ERP-2Y written elsewhere, and does the notation matter?
The same object appears as ERP-2Y, as the 2-year equity risk premium, as the earnings yield minus the 2-year Treasury yield, and inside the broader earnings yield gap or Fed model family. The wedge between the two maturities is written 2s10s, 2Y-10Y or 10Y-2Y depending on the sign convention, and this page uses 10-year minus 2-year throughout. The notation does not change the arithmetic, but it does change what a search returns, which is why the file carries the maturity in the column name rather than in a footnote.
Does this dataset say anything about whether equities are cheap?
No, and the scope is worth stating plainly. The file measures two published accounting spreads and the distance between them. It contains no expected return, no discount rate and no valuation judgment. The separate question of whether the earnings yield gap carries information about future returns is covered in Eco3min’s note on the earnings yield gap and in the study of the Excess CAPE Yield’s forecasting record, both linked in the sources.
Cite this page
Eco3min Research, “Equity risk premium, 2-year against 10-year Treasury: the maturity choice flips the sign in 68 months since 1976”, September 2026. https://eco3min.fr/en/equity-risk-premium-2-year-vs-10-year/ Data CC BY 4.0.
Last updated — 18 September 2026
Disclaimer – Financial Information: The analyses, commentary, and content published on eco3min.fr are provided for informational and educational purposes only. They do not constitute investment advice or a solicitation to buy or sell financial instruments. Past performance is not indicative of future results. All investment decisions involve risk and are the sole responsibility of the reader.