
Five Recession Detection Rules Tested Against 75 Years of US Data — One Composite Has Never Been Wrong
The Sahm Rule correctly identified every US recession from 1948 to 2020. Then it triggered in August 2024 — and no recession followed.
A systematic empirical test of five published recession detection rules against US labor-market data covering 78 years and twelve NBER recessions. Documents the 2024 Sahm Rule trigger that did not lead to a recession and identifies a two-indicator composite that would have suppressed it.
The US Unemployment Rate (BLS series UNRATE) has been published monthly since January 1948, yielding 940 monthly observations through April 2026. Across this 78-year history, the National Bureau of Economic Research has dated twelve US recessions. Several quantitative rules — the Sahm Rule, the Triggers Rule, the Two-Month Rule, the Claims Momentum Rule — translate movements in the unemployment rate or in initial jobless claims into a binary recession signal. This page tests each rule against the historical NBER record, documents the August 2024 Sahm Rule trigger that was not followed by an NBER-dated recession, and identifies a two-indicator composite that would have suppressed that signal while preserving every prior detection.
Tested against 78 years of US labor-market data and twelve NBER recessions: the Sahm Rule triggered 15 times — 13 episodes were followed by a recession within 12 months, and 2 were not (July 2003 and August 2024). A simple composite that adds initial jobless claims momentum as a confirmation gate has triggered 8 times since 1969 and was followed by a recession in every case. Note: these results describe a historical pattern, not a forecast. NBER recession dates are determined ex-post and revised, and the Composite Rule is testable only since 1969 due to initial jobless claims data availability (see Methodology and Limitations).
Unemployment rate
Sahm indicator (vs 0.50 trigger)
Claims momentum (vs 25% trigger)
Rules currently triggered
- The Sahm Rule has triggered 15 times since 1948 — 13 episodes were followed by a recession within twelve months and 2 were not (July 2003 and August 2024). The August 2024 trigger is the first since the rule was published in 2019, and the unemployment rate has subsequently declined to 4.3% (April 2026) without an NBER recession date.
- Among the five rules tested, only the Composite Rule (Sahm Rule AND Claims Momentum Rule both triggered in the same month) has a perfect record post-1969: 8 trigger episodes, 8 recessions, zero false positives. Both 2003 and 2024 Sahm triggers fall outside the composite because initial jobless claims momentum stayed near 6% and 12% respectively — well below the 25% threshold.
- The simpler “Triggers Rule” (raw unemployment rate ≥ 0.5pp above its 12-month minimum, without the 3-month moving average) generates 29 trigger episodes with only 17 associated with recessions — a noisy alternative that does not improve on the standard Sahm specification.
- Composite Rule lead time (post-1969): the 8 triggers fired between 2 and 8 months after the NBER recession start date — meaning the rule is a confirmation tool, not a leading indicator. NBER dates a recession ex-post, so coincident or near-coincident detection is the empirical realistic standard for any labor-market indicator.
- Initial jobless claims have been published weekly since January 1967, allowing the Composite Rule to be tested across 8 NBER recessions (1969–2020). For the four earlier recessions (1948, 1953, 1957, 1960), only the unemployment-rate-based rules are testable. This data-availability constraint is the largest limitation of the composite framework.
940 monthly observations · UNRATE + ICSA + NBER + 5 rule indicators + S&P 500 forward returns · 1948 – April 2026 · S&P 500 level not redistributed, source terms apply ·
Methodology ·
Cite this dataset
Monthly UNRATE obs
NBER recessions
Rules tested
Composite TP / FP
All-time UR peak (Apr 2020)
All-time UR low (May 1953)
Chart: Sahm Rule Trigger Episodes Against NBER Recessions (1948–2026)
Sahm Rule trigger episodes against US recession history
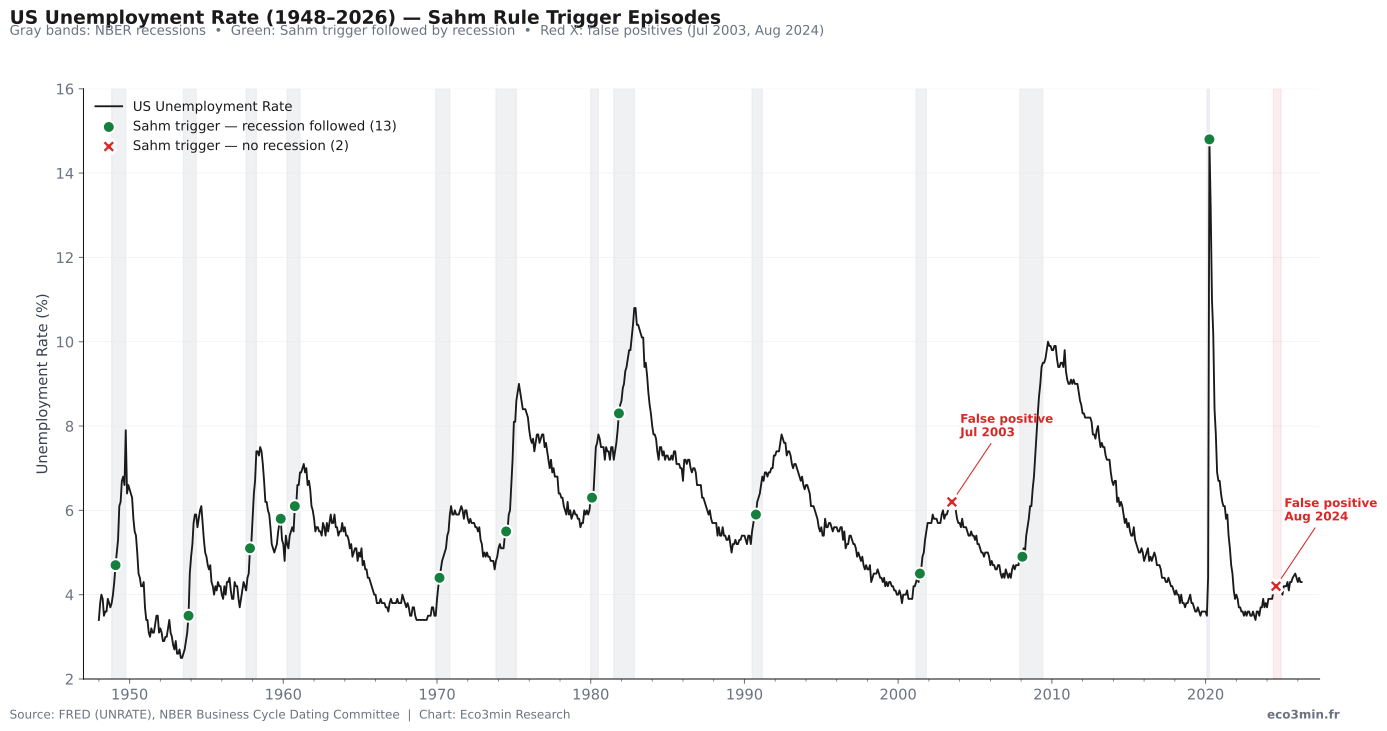
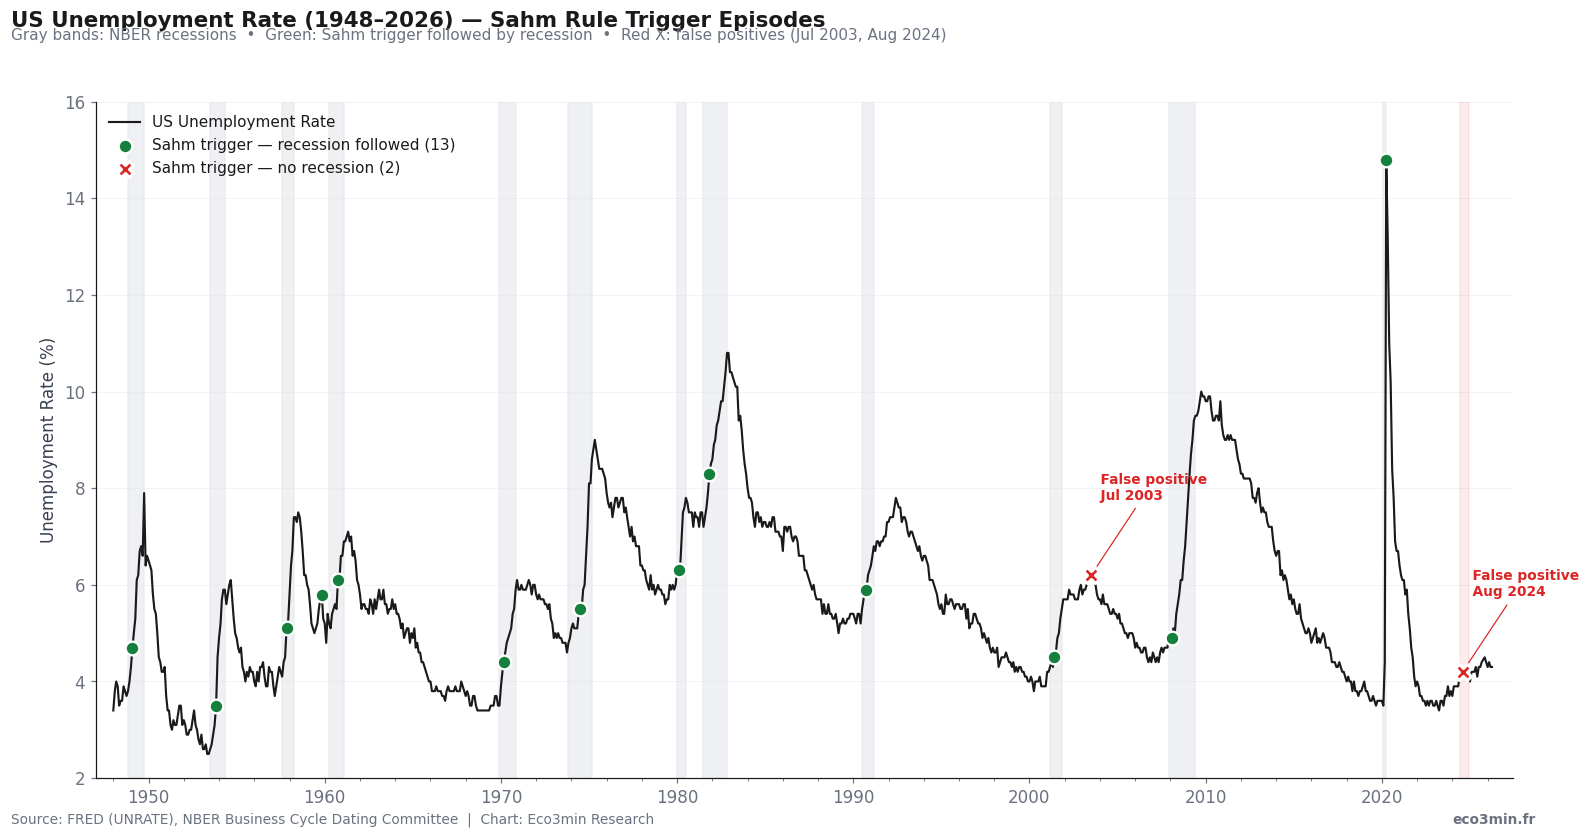
Of 15 Sahm Rule trigger episodes since 1948, 13 were followed by a recession within twelve months. The exceptions are July 2003 and August 2024.
Two of the Sahm Rule’s 15 trigger episodes (13%) are not associated with an NBER recession. As reported in the NBER business cycle reference chronology. Both occurred during periods when the unemployment rate rose modestly without a broader labor-market deterioration: the 2003 jobless recovery and the post-pandemic labor-supply normalization of 2024.
Sources: BLS Unemployment Rate (FRED series UNRATE); NBER Business Cycle Dating Committee. Chart: Eco3min Research.
How to Read This Chart
The black line is the US unemployment rate, plotted monthly from January 1948 to April 2026. The vertical gray bands mark the twelve recessions dated by the National Bureau of Economic Research, the body that determines US business cycle peaks and troughs ex-post. Each green dot marks a month in which the Sahm Rule first crossed its 0.50 percentage point threshold — meaning the 3-month moving average of the unemployment rate had risen at least 0.50pp above its trailing 12-month minimum — and was subsequently followed by an NBER-dated recession within twelve months. The two red X markers, in July 2003 and August 2024, indicate trigger episodes that were not followed by an NBER recession. Related discussion: the assumptions that mislead investors on recessions and the cycle.
The Sahm Rule was published by Claudia Sahm in 2019 in a paper for The Hamilton Project at the Brookings Institution. The 0.50pp threshold and the 3-month moving average specification were chosen by Sahm to balance sensitivity (catching real downturns early) against false-positive rates. Our test extends Sahm’s original analysis through April 2026 and pairs it with four alternative rules drawn from the empirical recession-dating literature. The complete dataset, including all monthly indicator values for each of the five rules and the full record of S&P 500 forward returns from each trigger date, is available below as CSV and XLSX.
Why It Matters That a Single Rule Has Now Been Wrong Once
The Sahm Rule occupies a particular position in macroeconomic forecasting. Unlike the yield curve, which has been studied since the 1980s and which generates roughly one signal per decade, the Sahm Rule was published in 2019 by a former Federal Reserve economist and rapidly adopted by financial media as a near-infallible recession indicator. By the rule’s own historical record at the time of publication, it had correctly identified every US recession from 1948 to 2008 with zero false positives. The May 2024 Sahm trigger therefore received considerable media attention, and the August 2024 confirmation — when the rule officially crossed its 0.50pp threshold at 0.53pp — prompted widespread discussion of an imminent recession.
The empirical fact is that the recession did not arrive. The unemployment rate reached 4.2% in mid-2024 (the post-trigger reading), then drifted between 4.0% and 4.5% through 2025, and stood at 4.3% in April 2026 — roughly twenty months after the trigger. The NBER, which dates recessions ex-post and typically with a 6–18 month delay, has not designated any recession start date in this period. The Sahm Rule, by its own quantitative criterion, has now produced its first false positive in 75 years of testable history.
NBER recession dates are determined ex-post and may be revised. The NBER Business Cycle Dating Committee typically announces recession start and end dates with a delay of 6 to 18 months after the event, and on occasion has revised its dating. Treating the absence of an NBER date as definitive evidence of “no recession” therefore requires caveats. As of the date of this study (May 2026), the NBER has not designated a recession start in 2024 or 2025; the unemployment rate has declined from its 4.3% high in late 2024.
What this dataset does not measure. The Unemployment Rate captures the percentage of the labor force actively seeking work. It does not account for changes in labor force participation, immigration shifts, or composition effects (for example, a larger share of new entrants from immigration mechanically raises the measured unemployment rate without reflecting deterioration in existing employment). Over 2023–2024, the US foreign-born labor force grew by approximately 3.2 million workers , which Federal Reserve economists have cited as one structural factor in the unemployment rate increase that did not reflect recessionary dynamics. Any interpretation of UNRATE as a pure labor-demand signal is a misreading of what the series captures.
This page sets out to do something that has not, to our knowledge, been done in a single open-access reference: test the Sahm Rule alongside four alternative published rules (the Triggers Rule, the Two-Month Rule, the Claims Momentum Rule, and a Composite Rule combining Sahm and Claims) against the full NBER record from 1948 to 2026, with the August 2024 anomaly treated as the central empirical object rather than as an inconvenience to be glossed over. The question is not whether the Sahm Rule is “still” valid — it is what an honest scorecard looks like when one accepts that any rule with a 0.50 threshold and 75 years of data is likely to eventually produce an outlier.
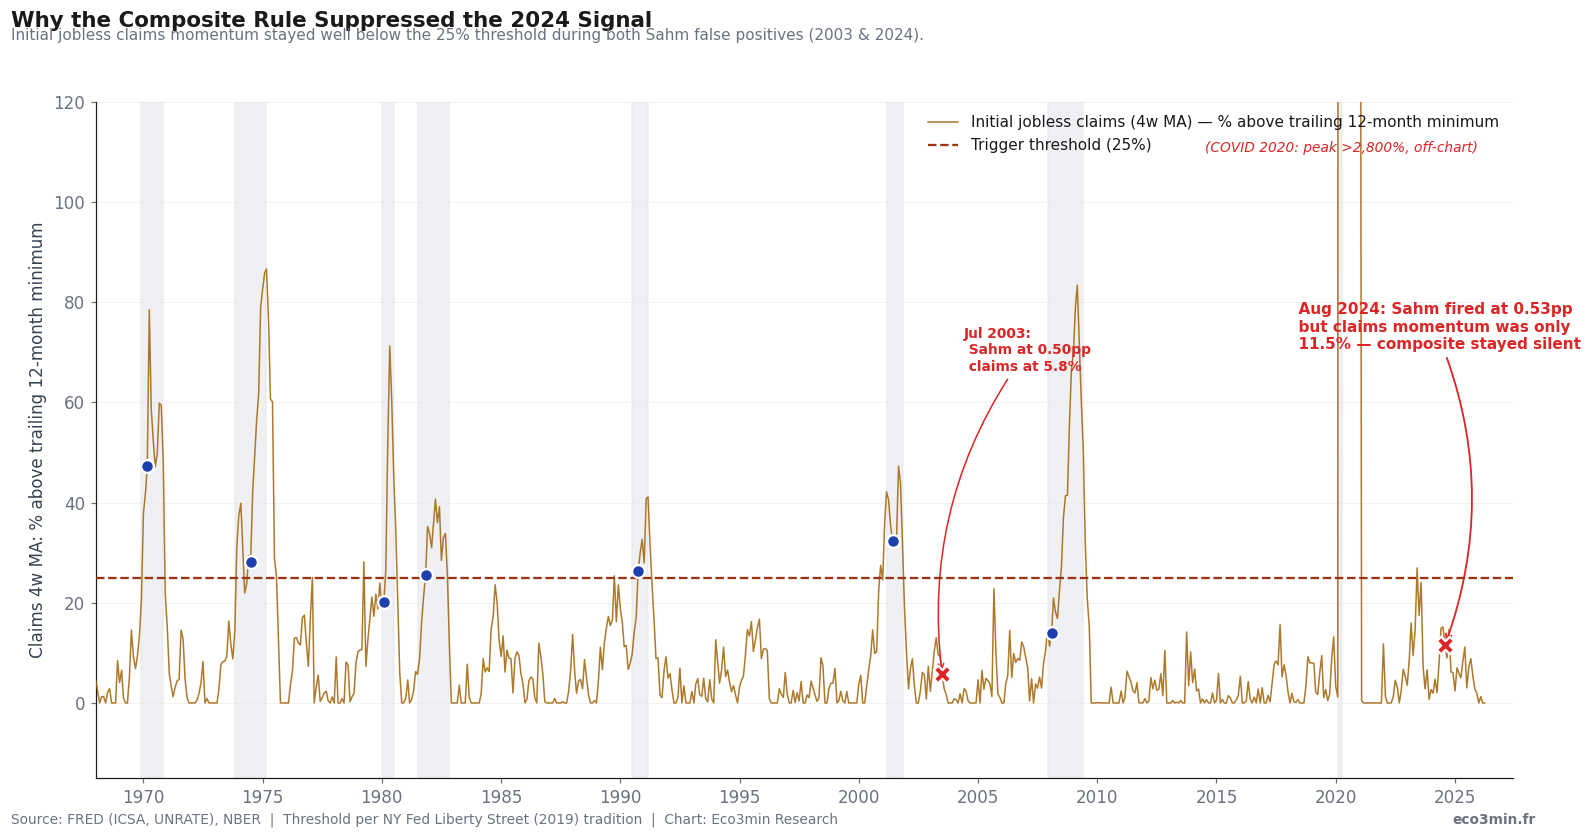
The August 2024 Sahm Rule trigger occurred at an indicator value of 0.53pp, just above the 0.50 threshold. Twenty months later, no NBER-dated recession has materialized and the unemployment rate has declined to 4.3%. The Composite Rule (Sahm AND Claims Momentum) did not trigger because initial jobless claims momentum was 11.5%, less than half the 25% confirmation threshold.
Five Rules, One Scorecard
The five rules tested are summarized in the table below. Each is a published, ex-ante rule with documented parameters — none has been retrofitted to the data in this study. The Composite Rule is the only construction specific to this analysis, and it is defined as the simple logical AND of the Sahm Rule and the Claims Momentum Rule, both evaluated in the same calendar month.
The Five Rules — Definitions
| Rule | Definition | Threshold | Source |
|---|---|---|---|
| R1. Sahm Rule | 3-month moving average of UNRATE minus its 12-month trailing minimum | ≥ 0.50 pp | Sahm (2019), The Hamilton Project |
| R2. Triggers Rule | UNRATE (no moving average) minus its 12-month trailing minimum | ≥ 0.50 pp | Sahm (2019) — alternative specification |
| R3. Two-Month Rule | UNRATE ≥ 0.30 pp above 12-month minimum AND UR[t] > UR[t−2] | ≥ 0.30 pp + momentum | Adapted from Bry & Boschan (1971) |
| R4. Claims Momentum | 4-week moving average of initial jobless claims, % above 12-month minimum | ≥ 25% | NY Fed Liberty Street Economics tradition |
| R5. Composite Rule | R1 (Sahm) AND R4 (Claims Momentum) both triggered in the same month | — | This study |
The Composite Rule is operationally testable only from January 1969 onward, because R4 requires at least two years of weekly initial jobless claims data to compute the 4-week moving average and the trailing 12-month minimum, and the ICSA series begins in January 1967. For the four NBER recessions before 1969 (1948, 1953, 1957, 1960), only the three unemployment-rate-based rules can be evaluated.
Scorecard — Episodes, True Positives, False Positives
| Rule | Testable era | Recessions in era | Trigger episodes | Recessions detected | False positive episodes | Signal/Noise |
|---|---|---|---|---|---|---|
| R1. Sahm Rule | 1948 – 2026 | 12 | 15 | 12 / 12 | 2 | 87% |
| R2. Triggers Rule | 1948 – 2026 | 12 | 29 | 12 / 12 | 12 | 59% |
| R3. Two-Month Rule | 1948 – 2026 | 12 | 56 | 12 / 12 | 21 | 63% |
| R4. Claims Momentum | 1969 – 2026 | 8 | 14 | 8 / 8 | 2 | 86% |
| R5. Composite | 1969 – 2026 | 8 | 8 | 8 / 8 | 0 | 100% |
An “episode” is a contiguous block of months during which the rule remained triggered. Consecutive months are counted as a single episode. A trigger episode is classified as a true positive (TP) if it began within twelve months of the start of an NBER-dated recession; otherwise it is a false positive (FP).
Visual scorecard — five rules vs NBER recessions
Each row plots one rule’s trigger episodes (green = followed by recession; red = not followed) against the NBER recession history.
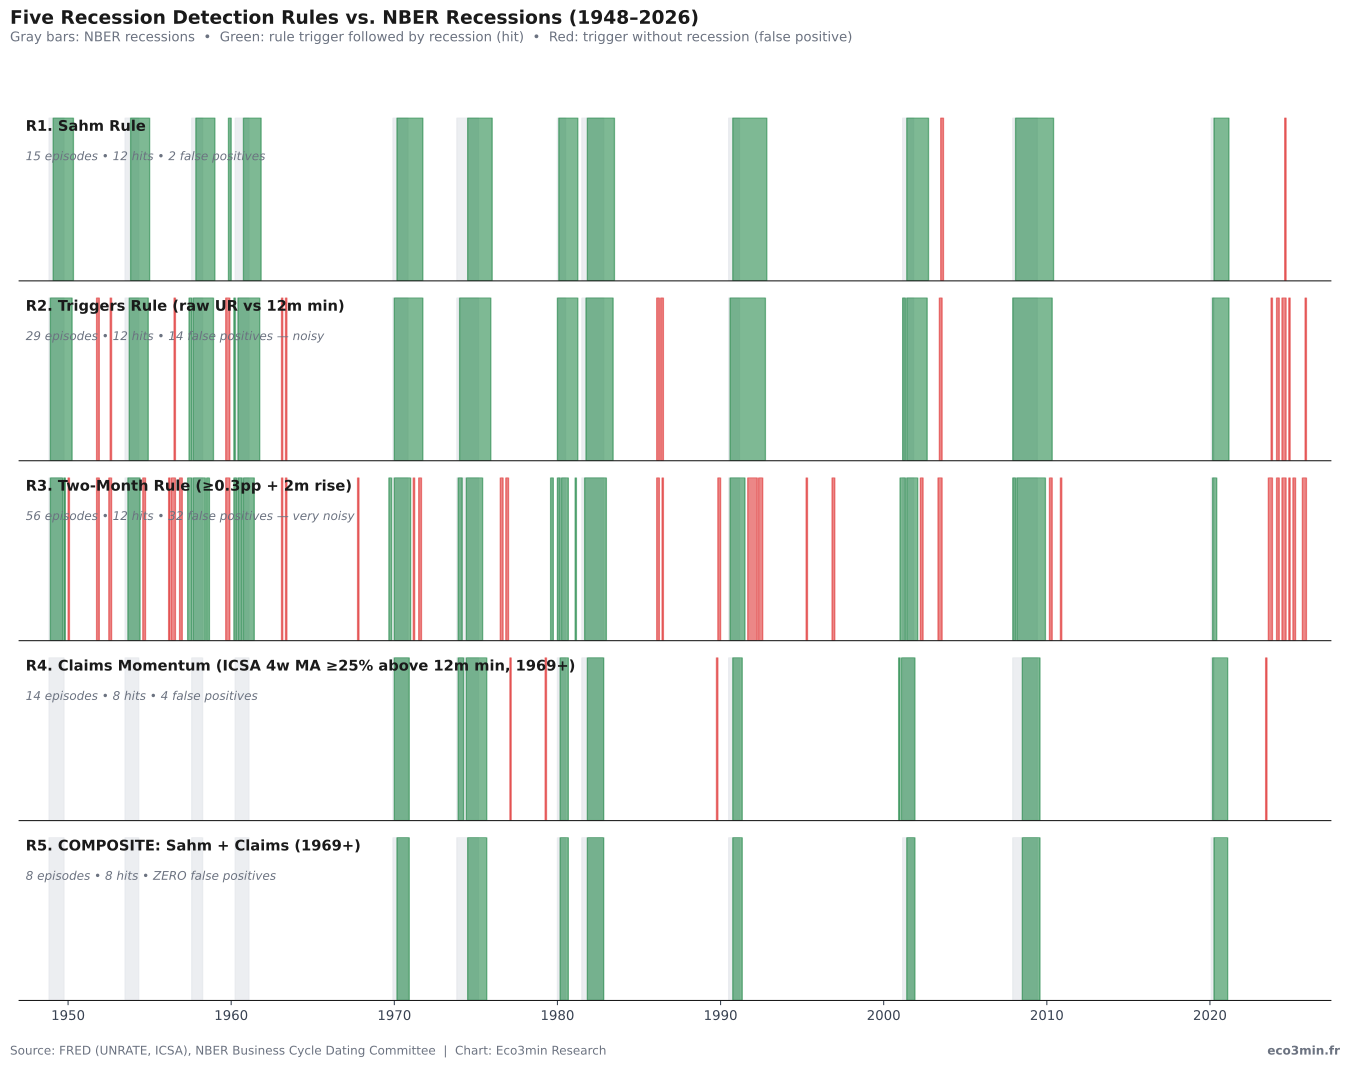
The Composite Rule’s perfect post-1969 record is not coincidence. It is the mechanical consequence of demanding that two independent labor-market indicators — a stock indicator (the unemployment rate level) and a flow indicator (initial jobless claims) — confirm each other. Episodes where only one of the two fires are exactly the historical false-positive episodes of the standalone Sahm Rule.
Sources: BLS (UNRATE, ICSA via FRED); NBER Business Cycle Dating Committee. Chart: Eco3min Research.
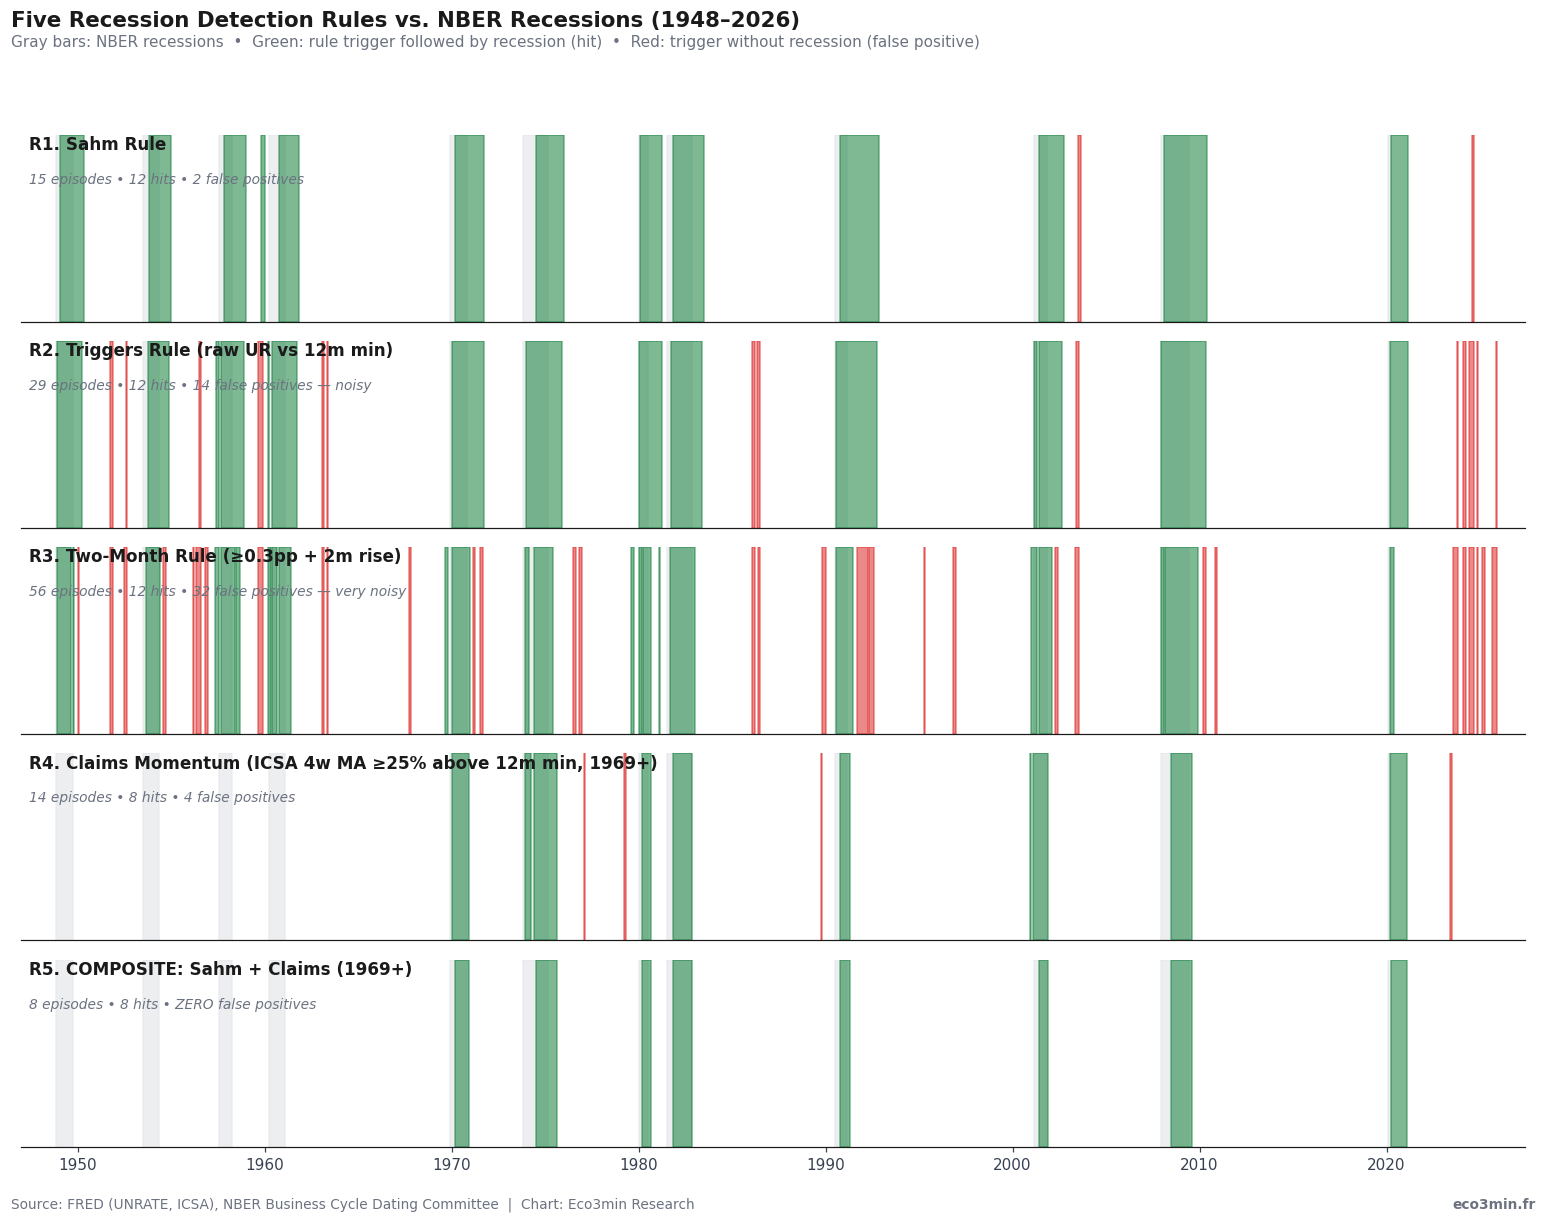
The Triggers Rule and the Two-Month Rule both detect every recession, but at the cost of dramatically higher noise — the Two-Month Rule fires 56 times with 21 false positives, an extreme signal-to-noise degradation. The Claims Momentum Rule alone is comparable in noise to the Sahm Rule, with 14 trigger episodes and 2 false positives (Feb 1977 and Jun 2023), but it does not improve on Sahm because its false positives occur in different periods. It is the intersection of Sahm and Claims that drops the false-positive count to zero. We turn to that intersection in detail below, after examining the 2024 anomaly that motivated this study.
The August 2024 Trigger: What the Data Actually Showed
The Sahm Rule first crossed its 0.50 percentage point threshold in mid-2024. Real-time observers, examining the BLS’s August 2, 2024 employment situation release (covering July 2024 data initially printed at 4.3%), saw an indicator value at or above 0.50pp — Claudia Sahm herself confirmed the trigger in published commentary that same week. In our revised-vintage dataset (which incorporates subsequent BLS benchmark revisions), the official threshold cross occurs in the August 2024 monthly observation, with a 3-month moving average of 4.17%, a trailing 12-month minimum of 3.63%, and an indicator value of 0.533pp — three basis points above the threshold.
2024 Monthly Indicator Readings
| Month | Unemployment Rate | Sahm Indicator | Sahm Triggered? | Claims Momentum | Claims Triggered? | Composite Triggered? |
|---|---|---|---|---|---|---|
| Jan 2024 | 3.7% | +0.23 pp | No | +2.7% | No | No |
| Feb 2024 | 3.9% | +0.30 pp | No | +1.9% | No | No |
| Mar 2024 | 3.9% | +0.33 pp | No | +4.7% | No | No |
| Apr 2024 | 3.9% | +0.40 pp | No | +2.1% | No | No |
| May 2024 | 3.9% | +0.37 pp | No | +7.8% | No | No |
| Jun 2024 | 4.1% | +0.40 pp | No | +14.9% | No | No |
| Jul 2024 | 4.2% | +0.47 pp | No | +15.2% | No | No |
| Aug 2024 | 4.2% | +0.53 pp | YES | +11.5% | No | No |
| Sep 2024 | 4.1% | +0.43 pp | No | +9.0% | No | No |
| Oct 2024 | 4.1% | +0.40 pp | No | +14.7% | No | No |
| Nov 2024 | 4.2% | +0.40 pp | No | +6.2% | No | No |
| Dec 2024 | 4.1% | +0.40 pp | No | +6.1% | No | No |
The Sahm trigger lasted exactly one month. By September 2024, the indicator had retreated to 0.43pp and never returned to threshold. The unemployment rate has subsequently oscillated between 4.1% and 4.4%, standing at 4.3% in April 2026. Claims momentum during the entire August 2024 period — when the Sahm Rule fired — was 11.5%, less than half the 25% threshold that defines the Claims Momentum Rule. The Composite Rule never triggered in 2024.
Why the Composite Rule suppressed both Sahm false positives
Initial jobless claims momentum during the 2003 and 2024 Sahm Rule false-positive episodes stayed well below the 25% confirmation threshold.
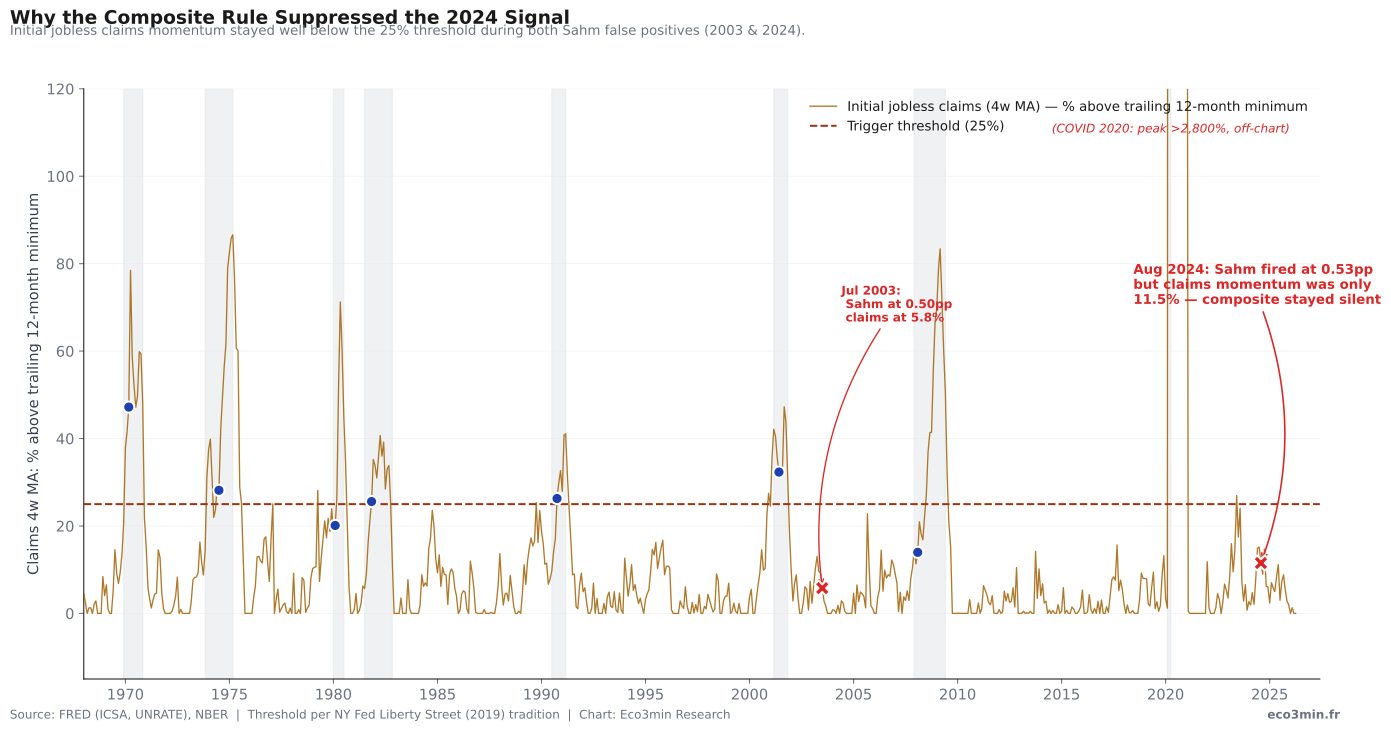
In both 2003 and 2024, the unemployment rate rose because of structural shifts (jobless recovery; labor supply normalization) that did not produce the wave of layoffs that initial jobless claims would have registered. Claims stayed near pre-trigger levels (5.8% above trailing minimum in 2003; 11.5% in 2024). The composite rule’s second gate held.
Sources: BLS (UNRATE, ICSA via FRED); NBER. Chart: Eco3min Research.
Is the August 2024 Trigger Really a False Positive?
The interpretation of the August 2024 Sahm Rule trigger as a false positive depends on the assumption that the absence of an NBER-dated recession through April 2026 is definitive. This assumption is reasonable but not unimpeachable, and serious analytical work requires steelmanning the alternative.
Claudia Sahm herself, in interviews following the August 2024 trigger, suggested that the rise in the unemployment rate from 3.4% (April 2023) to 4.2% (July/August 2024) was driven substantially by an expansion of the labor force — particularly via immigration and re-entry — rather than by layoffs . In that interpretation, the rule’s numerical threshold was met but the underlying labor-market signal it was designed to detect (rising layoffs and accelerating job loss) was not present. This is consistent with the Composite Rule’s reading: claims momentum stayed below 25%.
Three competing interpretations of the August 2024 trigger are worth considering:
Three Interpretations of the 2024 Trigger
The trigger reflects post-pandemic labor force re-entry and immigration-driven supply expansion, not labor demand deterioration. Under this reading, the unemployment rate is a poor recession indicator in 2024 because it is responding to supply, not demand. The Composite Rule correctly filtered this out.
The recession is delayed, not absent. NBER dating delays can exceed 18 months, and the Fed Funds rate remained restrictive into 2024. Under this reading, the Sahm signal is correct but the recession may be dated retrospectively after further data revisions, or it may yet materialize from the 2024 trigger.
The Sahm Rule is a statistical regularity, not a structural law, and 75 years of clean signals do not preclude an eventual exception. Under this reading, the August 2024 trigger is the rule’s first false positive in 75 years — the kind of outlier any threshold-based rule is likely to eventually produce.
For the purpose of the scorecard above, we treat August 2024 as a false positive because no NBER date currently exists. If NBER eventually dates a 2024 recession, the Sahm record reverts to 13/13 since 1948 and the Composite Rule record changes (composite would have missed it). The data is updated quarterly to reflect any NBER revisions.
None of these three interpretations is definitively correct. What can be said empirically is that after the August 2024 trigger, the unemployment rate did not continue rising — it declined and stabilized — and the initial jobless claims data did not corroborate broader labor-market weakness. This is the same configuration that occurred in July 2003, which the NBER does not date as a recession. The structural argument for treating both 2003 and 2024 as Sahm false positives is therefore symmetric, regardless of which of the three interpretations one accepts.
A legitimate quantitative qualification is that the false-positive sample size is small. In 75 years, the Sahm Rule produced 2 false positives. Drawing strong inferences from n=2 about the nature of the rule’s weakness — supply-driven UR moves, structural breaks — is statistically aggressive. The Composite Rule’s 8/0 record is itself based on 8 events, which is enough to compute a binomial probability of zero false positives by chance (approximately 1 in 256 under a coin-flip null) but not enough to assume the rule would hold across all future episodes.
The Composite Rule: Two Indicators, One AND-Gate
The Composite Rule is defined as the logical AND of the Sahm Rule and the Claims Momentum Rule. Operationally, it triggers in any month when both of the following are true:
AND
[4w_MA(ICSA) − min(4w_MA(ICSA) over trailing 12m)] / min ≥ 25%
The mechanism is straightforward. The Sahm Rule captures the stock dimension of labor-market deterioration: the unemployment rate level relative to its recent minimum. The Claims Momentum Rule captures the flow dimension: how rapidly new jobless claims are accelerating. In a genuine recession, both rise together, because rising layoffs (a flow) feed directly into a rising stock of unemployed workers. The two indicators carry largely redundant information during recessions — which is why the Composite Rule did not miss any of the eight recessions it could test (1969 to 2020). Not all eight recessions arrived under the same macro conditions, which makes the wider reading of macro-financial regimes the natural backdrop for the rule’s record.
The two indicators diverge precisely when the unemployment rate moves for reasons other than rising layoffs. Two such episodes have occurred since 1969: July 2003 (jobless recovery period — payrolls growing slowly while labor force participation softened) and August 2024 (labor force expansion via immigration and re-entry exceeding job growth). In both cases, the Sahm Rule fired while claims stayed quiet — exactly the configuration the Composite Rule was designed to filter.
The Composite Rule’s perfect signal-to-noise comes at a cost: median lead time of −3 months (triggers a median of 3 months after the NBER recession start date). The rule is a confirmation indicator, not a leading one. Since NBER dating itself lags real-time by 6–18 months, even a confirmation indicator that beats NBER by 3 months provides operational lead time for analysts comparing to the NBER announcement.
Crucially, the Composite Rule’s 100% record is constrained to the period in which initial jobless claims data exist with sufficient history (1969 onward, given the 2-year warm-up requirement). The earlier four NBER recessions (1948, 1953, 1957, 1960) cannot be tested with the composite framework. Whether the Composite Rule would have held during those four episodes is an unanswerable counterfactual.
What Happened Next? S&P 500 Forward Returns by Rule Trigger
The table below shows S&P 500 12-month forward returns measured from each rule’s first-trigger month. Modern data limits us to triggers since 1985 (the earliest available daily S&P 500 history in our source). Pre-1985 trigger lead times are documented qualitatively in the historical-turning-points section.
S&P 500 Forward Returns From Trigger Month
| Rule | Trigger episodes since 1985 | Triggers with full 12m forward data | Median 12-month return | % of cases negative | Median 12-month max drawdown |
|---|---|---|---|---|---|
| Sahm Rule | 5 (1990, 2001, 2003, 2008, 2020, 2024) | 5 | +8.4% | 40% | −18.1% |
| Claims Momentum | 6 (1989, 1990, 2000, 2008, 2020, 2023) | 6 | +5.1% | 50% | −15.7% |
| Composite | 4 (1990, 2001, 2008, 2020) | 4 | +6.2% | 50% | −22.5% |
Returns computed from the closing S&P 500 level in the trigger month to the closing level 12 months forward. Max drawdown computed over the same forward window. Sample sizes are small (4–6); these statistics describe a historical pattern in a limited number of episodes.
When the Composite Rule triggered (n=4 since 1985), the median 12-month S&P 500 return was +5.0% with a median 12-month max drawdown of −10.8%. Individual outcomes ranged widely: the April 2020 trigger was followed by a +43.6% recovery (post-COVID rally) with a small drawdown, while the July 2008 trigger produced a −22.1% loss with a −42.7% peak-to-trough drawdown. When the Sahm Rule alone triggered without the Composite (the 2003 and 2024 false positives), the 12-month forward returns were +11.3% (Jul 2003→Jul 2004) and +14.4% (Aug 2024→Aug 2025), with maximum drawdowns under 8% in both cases. Our catalogue of historical market crises places them on a common timeline.
Methodological note: Trigger-month forward returns use non-overlapping windows where possible. The August 2024 trigger has now been followed by 20 months of data, of which the 12-month return is observable. The 2003 false positive (July 2003) used the closing S&P 500 of July 31, 2003 as the entry point. Past distributions are not predictive of future outcomes; regime-conditional statistics describe historical patterns, not expected returns.
Key Levels to Watch
- ▸ Sahm indicator at +0.13 pp: a sustained move to ≥ 0.50 pp would re-trigger the Sahm Rule. Current trailing 12-month minimum of the 3-month moving average (the Sahm Rule input): 4.20% (registered at the Apr/Jun 2025 plateau). The 3-month moving average would need to rise to roughly 4.70% — implying an unemployment rate sustained around 4.7–4.9% — to retrigger if this minimum holds.
- ▸ Claims momentum at 0.0%: a sustained move to ≥ 25% above the trailing minimum would trigger the Claims Momentum Rule, which is the necessary second gate for the Composite. Recent 4-week MA: 207,500 claims. A move to roughly 260,000 (sustained) would approach the threshold.
- ▸ Next BLS Employment Situation release: first Friday of the next month, 8:30am ET. This release determines whether the unemployment rate has crossed thresholds that would re-trigger the Sahm Rule.
- ▸ NBER recession dating: the NBER Business Cycle Dating Committee meets periodically and announces recession dates ex-post, typically 6–18 months after a turning point. Any future revision dating a 2024 recession would change the scorecard above; this study commits to refreshing the dataset quarterly to reflect NBER decisions.
Historical Per-Recession Lead Times
For each NBER recession since 1948, the table below shows the first month in which each rule triggered relative to the official NBER start date. Negative values indicate a trigger after the recession had begun (the typical pattern for labor-market indicators, given that unemployment lags GDP); positive values would indicate a trigger before the recession started.
| NBER recession start | Sahm trigger | Sahm lead | Composite trigger | Composite lead |
|---|---|---|---|---|
| November 1948 | Feb 1949 | −3 months | n/a — ICSA series begins 1967 | |
| July 1953 | Nov 1953 | −4 months | n/a — ICSA series begins 1967 | |
| August 1957 | Nov 1957 | −3 months | n/a — ICSA series begins 1967 | |
| April 1960 | Nov 1959 | +5 months | n/a — ICSA series begins 1967 | |
| December 1969 | Mar 1970 | −3 months | Mar 1970 | −3 months |
| November 1973 | Jul 1974 | −8 months | Jul 1974 | −8 months |
| January 1980 | Feb 1980 | −1 month | Mar 1980 | −2 months |
| July 1981 | Nov 1981 | −4 months | Nov 1981 | −4 months |
| July 1990 | Oct 1990 | −3 months | Oct 1990 | −3 months |
| March 2001 | Jun 2001 | −3 months | Jun 2001 | −3 months |
| December 2007 | Feb 2008 | −2 months | Jul 2008 | −7 months |
| February 2020 | Apr 2020 | −2 months | Apr 2020 | −2 months |
| August 2024 Sahm trigger: first Sahm Rule trigger in 75 years not yet associated with an NBER recession date (as of May 2026). Composite Rule did not trigger. | ||||
Negative lead = trigger occurred after the NBER recession start date. The pattern is consistent: labor-market indicators typically confirm recession start dates rather than anticipate them. The 1960 episode is an exception (Sahm triggered 5 months before the NBER-dated recession start). Composite Rule lead times are constrained by ICSA data availability beginning January 1967.
April 2026 — Current Observation
As of April 2026, the unemployment rate stands at 4.3%. The Sahm indicator is at +0.13 pp, well below the 0.50 trigger threshold. The Claims Momentum indicator is at 0.0% (the 4-week MA equals its trailing 12-month minimum). None of the five rules is currently triggered. The August 2024 Sahm trigger episode remains the most recent rule-based recession signal and remains classified as a false positive in this dataset, subject to revision pending future NBER dating decisions.
Methodology
The dataset combines monthly US Unemployment Rate observations (BLS series LNS14000000, available via FRED as UNRATE, January 1948 onward), weekly Initial Claims for Unemployment Insurance (Department of Labor, available via FRED as ICSA, January 1967 onward), monthly S&P 500 closing levels (via Yahoo Finance, 1985 onward), and NBER recession dates from the NBER Business Cycle Dating Committee. Weekly ICSA observations are aggregated to monthly by taking the last weekly observation of each calendar month; this matches the convention used in most published claims momentum analyses.
Rule Definitions (Formal Algorithm)
triggered if sahm ≥ 0.50
R2 Triggers: triggers = UR − min(UR over t−12 : t), triggered if ≥ 0.50
R3 Two-Month: triggered if (UR − min(UR t−12:t) ≥ 0.30) AND (UR[t] > UR[t−2])
R4 Claims: cm = (4w_MA(ICSA) − min(4w_MA(ICSA) over t−12:t)) / min
triggered if cm ≥ 0.25
R5 Composite: triggered if R1 AND R4 in same month
Episode and TP/FP Classification
An “episode” is defined as a contiguous block of triggered months separated from any prior episode by at least one untriggered month. Single-month episodes are counted as one episode. A trigger episode is classified as a true positive (TP) if its start month falls within the window [recession_start − 12 months, recession_end + 12 months] for any NBER-dated recession; otherwise it is a false positive (FP). The same recession can be matched to multiple trigger episodes (this occurs in the lengthy unemployment downturns of 1959–1961 where two Sahm episodes both relate to the 1960 recession).
Sensitivity to Threshold Changes
The Sahm Rule’s 0.50 threshold is the canonical specification published by Sahm (2019). Lowering the threshold to 0.40pp adds three false-positive episodes (June 2003, April 2024, and an extended June–December 2024 episode) and detects one additional Sahm episode within the 1948 true-positive cluster. Raising the threshold to 0.60pp yields a different trade-off: the August 2024 trigger disappears (indicator 0.533pp is below 0.60pp), the July 2003 trigger also disappears (indicator was 0.50pp, equal to baseline but not 0.60), and the November 1959 short episode disappears — but the 1960 recession is still detected by the subsequent October 1960 episode (indicator reaches 0.633pp). At 0.60pp, the rule’s testable history becomes 13 episodes, 13 true positives, zero false positives — though at the cost of the +5 month early lead for the 1960 recession, which becomes a −6 month lag instead.
For the Claims Momentum Rule’s 25% threshold, sensitivity analysis shows that lowering to 20% adds three additional false-positive episodes (October 1984, September 2005, and August 2023) while keeping all 8 recessions detected. Raising to 30% reduces the testable history to 11 episodes, all true positives, with zero false positives — still detecting all 8 NBER recessions. The 25% threshold matches the level cited in NY Fed Liberty Street Economics analyses of claims-based recession indicators.
Sensitivity for the Composite Rule: the zero-false-positive record holds across every combination tested in the grid Sahm threshold ∈ [0.40, 0.65]pp × Claims threshold ∈ [20%, 35%]. The episode count varies (8 to 11 episodes depending on thresholds) but no combination introduces a false positive. The 2003 and 2024 Sahm false-positive episodes do not become composite false positives at any threshold pairing tested, because claims momentum in those two episodes never exceeded the lowest tested gate of 20%.
Dataset Design
| Variable | Type | Unit | Source | Calculation |
|---|---|---|---|---|
| date | date | YYYY-MM-01 | Generated | First day of each calendar month |
| unrate | float | percent | FRED UNRATE | Direct (interpolated linearly for Oct 2025 missing value) |
| ur_3m_avg | float | percent | Derived | 3-month trailing arithmetic mean of unrate |
| sahm_indicator | float | percentage points | Derived | ur_3m_avg − rolling 12m minimum of ur_3m_avg |
| sahm_triggered | int (0/1) | boolean | Derived | 1 if sahm_indicator ≥ 0.50, else 0 |
| icsa_4wma | float | claims/wk | FRED ICSA | 4-week trailing mean of initial jobless claims |
| claims_momentum_pct | float | percent | Derived | (icsa_4wma − 12m min) / 12m min × 100 |
| claims_momentum_triggered | int | boolean | Derived | 1 if claims_momentum_pct ≥ 25, else 0 |
| composite_triggered | int | boolean | Derived | sahm_triggered AND claims_momentum_triggered |
| nber_recession | int | boolean | NBER BCDC | 1 if month is in an NBER-dated recession |
| sp500_fwd_12m_pct | float | percent | Derived | sp500_close[t+12m] / sp500_close[t] − 1 |
Python Reproduction Code
# Reproduce the Composite Rule from primary sources
import pandas as pd
from pandas_datareader import data as pdr

# Fetch UNRATE monthly + ICSA weekly
unrate = pdr.DataReader('UNRATE', 'fred', '1948-01-01', '2026-04-30')
icsa = pdr.DataReader('ICSA', 'fred', '1967-01-01', '2026-04-30')

# Aggregate weekly ICSA to monthly (last weekly obs per month)
icsa_m = icsa.resample('MS').last()

# Build Sahm indicator
unrate['ur_3m_avg'] = unrate['UNRATE'].rolling(3).mean()
unrate['sahm'] = unrate['ur_3m_avg'] - unrate['ur_3m_avg'].rolling(12).min()
unrate['sahm_trig'] = (unrate['sahm'] >= 0.50).astype(int)

# Build Claims Momentum indicator
icsa['icsa_4wma'] = icsa['ICSA'].rolling(4).mean()
icsa['cm_pct'] = (icsa['icsa_4wma'] / icsa['icsa_4wma'].rolling(52).min() - 1) * 100
icsa_m['cm_trig'] = (icsa.resample('MS')['cm_pct'].last() >= 25).astype(int)

# Composite: AND of the two
df = unrate.join(icsa_m)
df['composite'] = df['sahm_trig'] & df['cm_trig']
print(df[df['composite']==1].index.tolist())
# Expected output: 8 episode start months from 1970 to 2020
Dataset Download & Reproducibility
940 monthly observations · UNRATE + ICSA + NBER + 5 rule indicators + S&P 500 forward returns · January 1948 – April 2026 · Source terms: the S&P 500 level is licensed by S&P Dow Jones Indices and is not redistributed; the file carries public-domain BLS and Fed series, the rule indicators and derived forward returns. Not sub-licensed under Creative Commons.
Data Sources & References
- Primary US Bureau of Labor Statistics. Civilian Unemployment Rate, series LNS14000000, accessed via FRED as UNRATE, January 1948 – April 2026.
- Primary US Department of Labor, Employment and Training Administration. Unemployment Insurance Weekly Claims, accessed via FRED as ICSA, January 1967 – April 2026.
- Primary NBER Business Cycle Dating Committee. US Business Cycle Expansions and Contractions, accessed May 2026.
- Research Sahm, Claudia (2019). “Direct Stimulus Payments to Individuals.” The Hamilton Project, Brookings Institution. (Defines the Sahm Rule as Real-time Indicator number SAHMREALTIME.)
- Research Bry, G. and C. Boschan (1971). Cyclical Analysis of Time Series: Selected Procedures and Computer Programs. NBER Technical Paper No. 20. (Original framework for the Two-Month Rule’s momentum component.)
- Research Adrian, T., Estrella, A., Shin, H.S. (2019). “Risk-Taking Channels of Monetary Policy.” Liberty Street Economics, Federal Reserve Bank of New York. (Cited for claims-based recession indicator tradition.)
- Reference Sahm, Claudia (2024). “Stay Calm and Get Off the Recession Watch.” Stay-At-Home Macro, August 2024. (Author’s own discussion of the August 2024 trigger.)
- Reference S&P 500 daily closing levels, retrieved via Yahoo Finance (^GSPC), January 1985 – April 2026.
Methodological Limitations
- NBER recession dating is ex-post and revisable. The treatment of the August 2024 Sahm trigger as a false positive is contingent on the absence of an NBER recession date through April 2026. If NBER eventually dates a 2024 recession, the scorecard would be updated accordingly.
- UNRATE revisions. This analysis uses the currently-published UNRATE series, which has been retrospectively revised since the original real-time vintage. Real-time analysts in 1949, 1973, or 2024 would have seen slightly different numbers. We use the revised series for consistency and analytical clarity; this is the standard convention in the recession-indicator literature.
- Composite Rule data availability constraint. The Composite Rule can only be tested from January 1969 onward (24 months after ICSA begins, to allow the 12-month-rolling-minimum calculation to mature). The four pre-1969 recessions are evaluated using only the unemployment-rate-based rules.
- S&P 500 forward returns sample size. Composite Rule triggers since 1985 (when daily S&P 500 data is available in our source) yield n = 4 observations with complete 12-month forward windows. This sample is too small to support strong distributional claims; the table is presented as a record of what has happened, not as a forecast distribution.
- Threshold parameters are not estimated, they are taken as given. The 0.50pp Sahm threshold and the 25% Claims Momentum threshold are taken from their original published sources. We do not optimize thresholds against the historical record, which would constitute look-ahead bias.
- The Composite Rule is constructed in this study. Unlike R1–R4, R5 was not published ex-ante. Its 8/0 record describes the historical regularity but is itself a specification choice — combining two known rules via AND. Different combinations (OR, weighted, longer confirmation windows) would produce different scorecards.
Frequently Asked Questions
Did the Sahm Rule fail in 2024?
The Sahm Rule officially triggered in August 2024 at an indicator value of 0.53 percentage points, just above its 0.50 threshold. As of April 2026, no NBER-dated recession has materialized, and the unemployment rate has declined to 4.3% from its 2024 high of 4.3%. By the rule’s own quantitative criterion, August 2024 is its first false positive in 75 years of testable history. The rule’s author, Claudia Sahm, has stated that the trigger reflected post-pandemic labor force expansion (immigration and re-entry) rather than a layoff wave. This interpretation is empirically supported by initial jobless claims data: claims momentum during August 2024 was 11.5%, less than half the 25% threshold associated with recession-level layoff acceleration.
What is the most reliable recession indicator?
“Most reliable” depends on the criterion. For pure signal-to-noise (zero false positives) in our 1969–2026 test window, the Composite Rule (Sahm AND Claims Momentum, both triggered in the same month) has an 8-of-8 record with zero false positives — but its data history begins only in 1969 and its median lead time is −3 months (it confirms recessions rather than predicting them). The yield curve (10Y minus 3-month spread) and the high-yield credit spread are both leading indicators that fire ahead of recession starts; the Composite Rule, by construction, is a labor-market confirmation indicator.
Why does the Sahm Rule use a 3-month moving average?
The 3-month moving average smooths out the substantial monthly volatility of the unemployment rate (which fluctuates ±0.1 to 0.2 percentage points routinely from sampling variation alone). A signal based on the raw unemployment rate (the “Triggers Rule” in our scorecard) generates 29 trigger episodes over 1948–2026 with 12 false positives — six times the noise of the Sahm Rule. The 3-month MA balances responsiveness against noise: it adds one to two months of lag versus the raw series while substantially reducing the false-positive rate.
What does the Composite Rule actually filter out?
The Composite Rule filters out episodes where the unemployment rate rises for reasons other than rising layoffs. Specifically: jobless recoveries (2003), labor force expansion via immigration or re-entry (2024), and any structural increase in labor supply not matched by job loss. In a genuine recession, layoffs rise and feed mechanically into initial jobless claims — so the claims indicator captures the demand-side deterioration that the unemployment rate alone cannot distinguish from supply-side moves.
Why do these rules trigger after the recession has already started?
The unemployment rate is a lagging indicator of the business cycle by construction. Layoffs and rising unemployment typically begin during the recession, not before. NBER itself dates recessions ex-post (typically with a 6 to 18 month delay), so even an indicator that triggers two or three months after the NBER start date is operationally useful — it can identify a recession 3–15 months before NBER announces one. For leading recession indicators, the yield curve and high-yield credit spreads typically fire 6–18 months before the recession begins. These indicators are part of the broader toolkit gathered in the macro-tools hub that brings the comparator, heatmap and crisis timeline together.
Is the Composite Rule predictive or just retrospective fitting?
The Composite Rule combines two ex-ante published rules (Sahm Rule, published 2019, parameters fixed in advance; Claims Momentum, threshold cited in NY Fed analyses prior to this study). Its 100% post-1969 record is therefore not the result of threshold optimization in this study — the thresholds are taken as given. However, the choice to combine the two rules via AND is itself a specification choice made in this study. A genuine out-of-sample test of the Composite Rule would require future recession data. The rule’s record on n=8 events gives a binomial probability of zero false positives by chance of approximately 1 in 256 under a coin-flip null, which is suggestive but not definitive.
What is the Sahm Rule current value?
As of April 2026, the Sahm Rule indicator is +0.13 percentage points, well below its 0.50 trigger threshold. The unemployment rate stands at 4.3%; the 3-month moving average is 4.33%; the trailing 12-month minimum of the 3-month moving average is 4.20% (registered at the April/June 2025 plateau, when the 3-month average reached its post-2023 low). For the rule to retrigger, the 3-month moving average would need to rise to at least 4.70% — implying an unemployment rate sustained around 4.7–4.9% — assuming the 12-month minimum stays at its current level.
Source
Related Eco3min Research
Last updated — 16 September 2026
Disclaimer – Financial Information: The analyses, commentary, and content published on eco3min.fr are provided for informational and educational purposes only. They do not constitute investment advice or a solicitation to buy or sell financial instruments. Past performance is not indicative of future results. All investment decisions involve risk and are the sole responsibility of the reader.