
Commodities Stopped Being a Reliable Diversifier After 2008 (1992–2026)
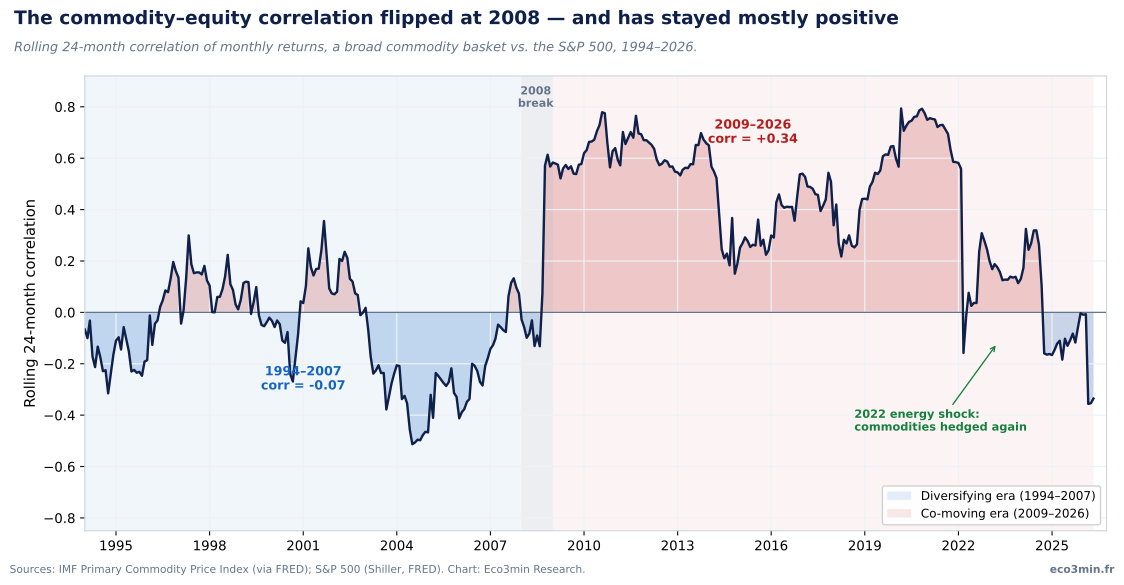
For the 14 years before 2008, commodities and the S&P 500 moved independently — a correlation of −0.07. Since 2008 they have mostly moved together, at +0.34.
Sources: IMF Primary Commodity Price Index (via FRED); S&P 500 (Shiller, FRED). Chart: Eco3min Research.
Commodities are widely held as a portfolio diversifier — an asset class expected to rise when stocks fall, smoothing returns through different economic regimes. Across the monthly record since 1992, that property weakened sharply after 2008. The correlation between a broad commodity basket and the S&P 500 was −0.07 over 1994–2007 and +0.34 over 2009–2026; the shift survives stripping out energy (non-fuel commodities: +0.06 to +0.32) and stripping out the two crash years (post-2008 ex-crises: +0.25). But the change is regime-dependent rather than absolute: commodities no longer hedge financial crises — they fell alongside stocks in 2008 and 2020 — yet they still hedge supply shocks, rising 18% in the 2022 inflation shock while the S&P fell 18%. This page documents the structural break, the financialization mechanism behind it, the regimes in which diversification survives, and what the data does and does not establish. The full monthly dataset (413 observations, 1992–2026) is available below; the S&P 500 level is not redistributed, source terms apply. Further detail: The Eco3min framework on how commodities signal inflation and shifting macro regimes.
The reliable, near-zero commodity–equity correlation of the pre-2008 era (−0.07) gave way to a persistently positive one afterwards (+0.34). The shift holds without energy and without crisis months, and the most cited cause is the financialization of commodity markets after 2004. But diversification did not vanish — it became episodic. Commodities stopped hedging financial crises (they fell with stocks in 2008 and 2020) while still hedging supply-driven inflation (in 2022 they rose 18% as the S&P fell 18%). The latest rolling correlation, −0.34, sits back in diversifying territory.
A broad commodity basket and the S&P 500 were effectively uncorrelated before 2008 and have been positively correlated since. The break is robust: it holds when energy is excluded and when the 2008 and 2020 crashes are removed. The standard explanation is the financialization of commodity futures — large, sustained index investment after 2004 that drew commodities into the same flows as equities. The diversification benefit did not disappear, however; it became conditional on the type of shock. In equity-led crises (2008, 2020) commodities fell with stocks; in the supply-led inflation shock of 2022 they rose while stocks fell. The honest summary is that commodities went from a reliable diversifier to an episodic one.
The diversification case, and what the record shows
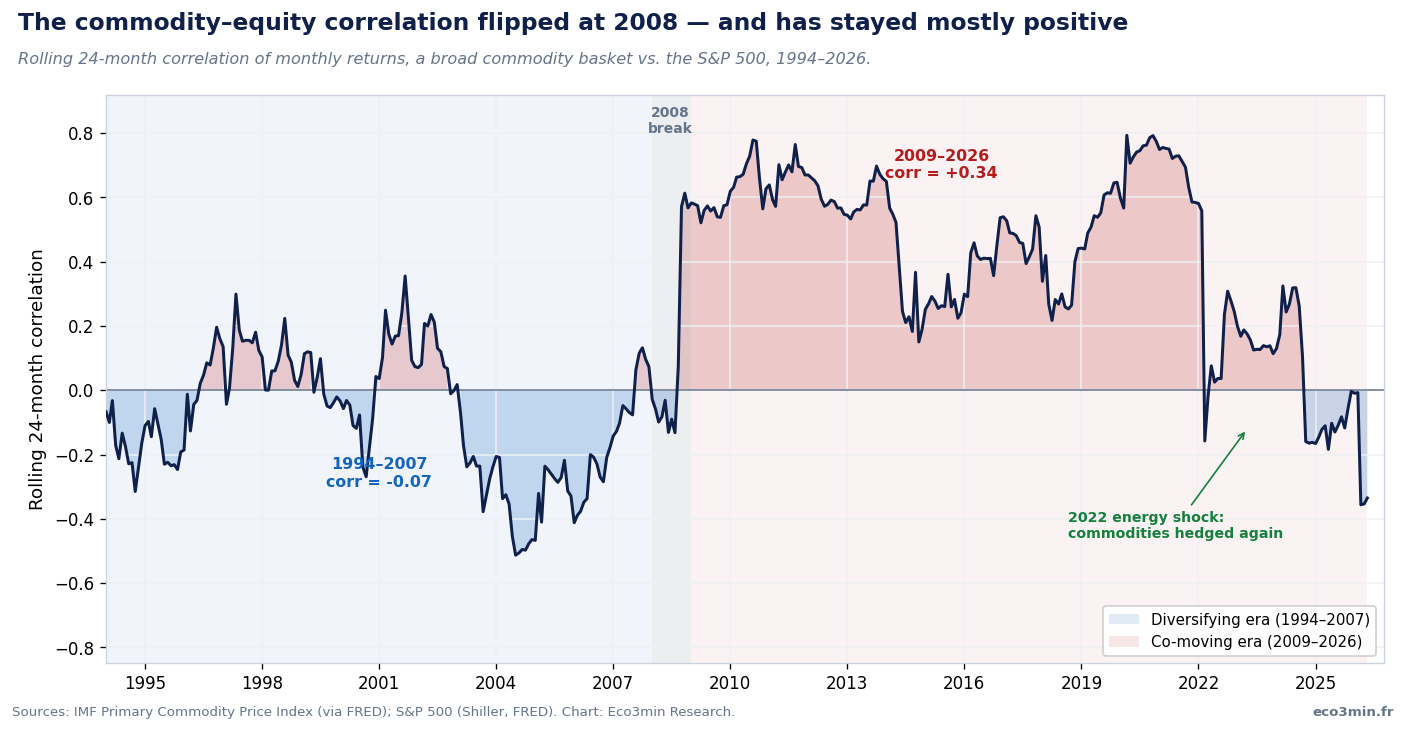
The textbook reason to hold commodities alongside stocks is diversification. Commodity prices are driven by physical supply and demand — harvests, oil production, industrial cycles — that need not move with corporate earnings or equity valuations. In classic portfolio terms, an asset with low or negative correlation to equities lowers total portfolio volatility even if its own returns are modest. For the period before 2008, the data supports that case cleanly: across 1994–2007 the correlation of monthly returns between a broad commodity basket and the S&P 500 was −0.07 — statistically indistinguishable from zero, and on the helpful side of it. Over the same window the rolling 24-month correlation stayed near zero, slightly negative on average, and spent most of the 2000–2007 commodity boom below zero, bottoming near −0.51 in 2004–2007. Related work: our mapping of the commodity exposure chain.
After 2008 the picture changes. Across 2009–2026 the same correlation is +0.34 — positive, and large enough to matter for a portfolio. The rolling 24-month correlation jumped sharply positive, averaging +0.52 across 2008–2012 and +0.47 across 2008–2019. A property that held for a decade and a half did not gradually erode; it changed regime.
What this dataset does and does not measure. It measures the co-movement of commodity and equity returns — the correlation that determines diversification benefit — not the level of returns. Whether commodities are a good investment on their own (their absolute return, net of roll and storage costs) is a separate question this page does not address. The commodity series is the IMF Primary Commodity Price Index, a transparent spot-price benchmark; an investor accesses commodities through futures-based indices (such as the S&P GSCI or Bloomberg Commodity Index) whose total returns differ from spot prices because of roll yield and collateral. The financialization literature finds the same post-2008 correlation rise in those investable indices, so the structural conclusion carries across — but spot and investable returns are not identical.
The commodity–equity correlation moved from −0.07 (1994–2007) to +0.34 (2009–2026). Excluding 2008 itself is the conservative choice: including the crisis year only raises the post-break figure to about +0.40.
Why the correlation rose: the financialization of commodities
The most widely cited explanation is the financialization of commodity markets. Beginning in the mid-2000s, large pools of capital — pensions, endowments and retail funds — began allocating to commodities as an asset class, predominantly through index products tracking broad commodity baskets. As this index investment grew, commodity futures came to be bought and sold alongside equities by the same investors responding to the same macro signals: risk appetite, the dollar, liquidity conditions. Tang and Xiong (2012) document that the correlation between commodities and equities, and among commodities themselves, rose markedly after 2004 in step with the growth of index investment — the central empirical claim of the financialization thesis.
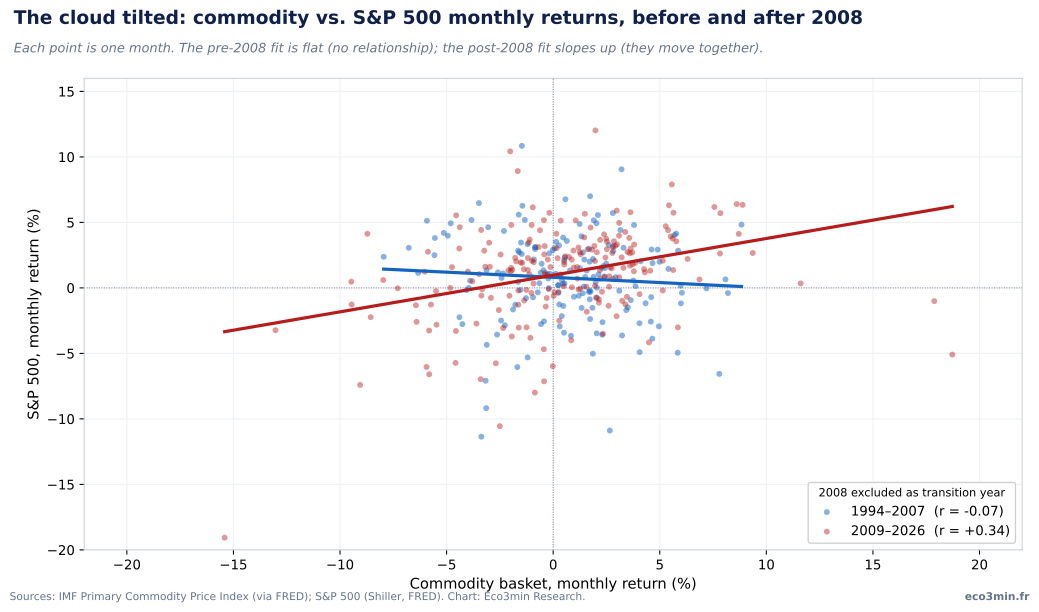
The scatter below shows the change directly. Each point is one month’s pair of returns. Before 2008 the cloud has no tilt — the fitted line is flat, the relationship absent. After 2008 the same cloud slopes upward: months when commodities rose were, on average, months when stocks rose too.
The cloud tilted
Monthly commodity vs. S&P 500 returns. The pre-2008 fit (blue) is flat; the post-2008 fit (red) slopes up. 2008 is excluded as the transition year.
Sources: IMF Primary Commodity Price Index (via FRED); S&P 500 (Shiller, FRED). Chart: Eco3min Research.

An important robustness check: the break is not just an energy story. Energy dominates broad commodity indices and is itself sensitive to global growth, so a rising correlation could in principle reflect oil alone. Restricting the basket to non-fuel commodities — metals, agriculture, raw materials — the correlation still moves from +0.06 (1994–2007) to +0.32 (2009–2026). Nor is it only a crisis artifact: excluding the 2008 and 2020 crash windows, the post-2008 correlation is still +0.25. The shift is broad-based and persists outside of panics. For the inflation dimension of the commodity story, see our study on how oil shocks pass through to core inflation.
When commodities still diversify
A positive average correlation does not mean commodities never diversify. The relationship is regime-dependent, and the distinction that matters is the source of the shock. When a sell-off originates in financial conditions — tightening credit, a liquidity scramble, a growth scare — commodities and equities fall together, because the same deleveraging hits both and because weaker growth lowers commodity demand. When a sell-off originates in a supply shock — an oil embargo, a war, a harvest failure — the very thing depressing equities (higher input costs, higher inflation, tighter policy) is what lifts commodity prices, and the two diverge.
The rolling correlation makes this visible. After holding firmly positive through the 2010s, it fell back toward zero and below during the 2020–2026 window, which averaged +0.27 but ranged from −0.36 to +0.79 — a far wider spread than any earlier period. The most recent reading, for May 2026, is −0.34: by this measure commodities are diversifying again. The post-2008 regime is one of higher average co-movement and lower reliability, not permanent co-movement.
Fell together in financial crises, hedged in the supply shock
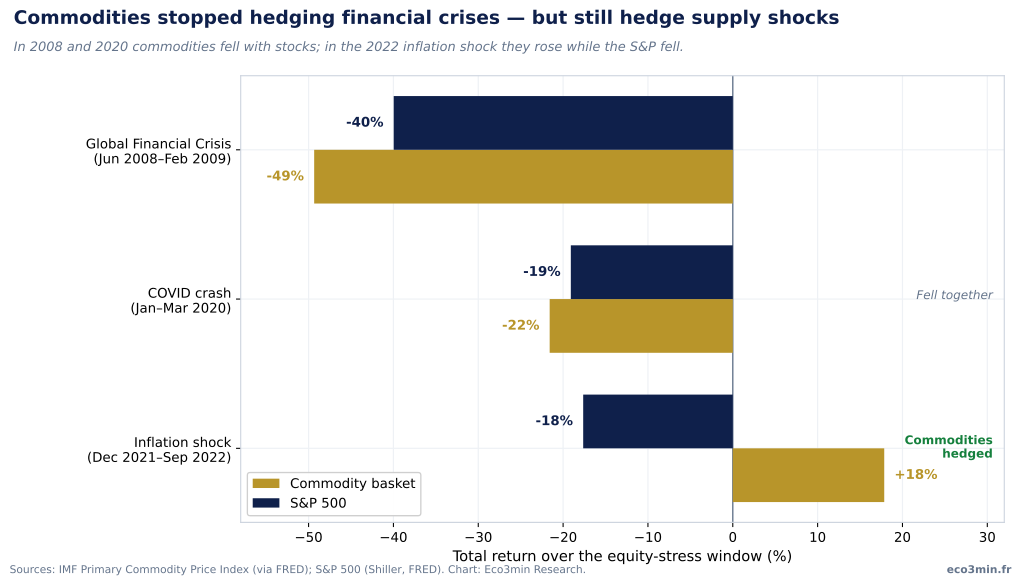
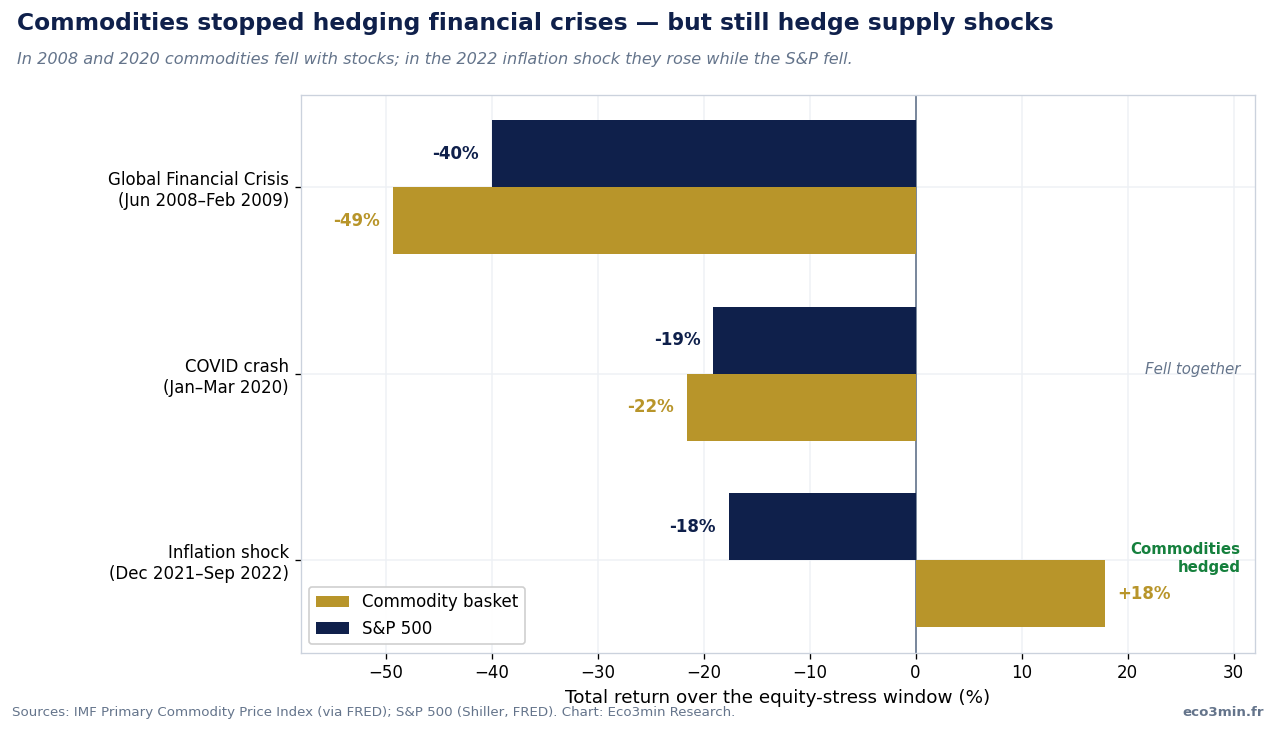
Total return over each equity-stress window. In 2008 and 2020, commodities fell with stocks; in the 2022 inflation shock, commodities rose while the S&P fell.
Sources: IMF Primary Commodity Price Index (via FRED); S&P 500 (Shiller, FRED). Chart: Eco3min Research.
Co-movement in the crises that mattered
Diversification is bought for the bad months, so the relevant test is what commodities did during equity stress, not on average. The record across the three defining episodes since 2008 is split exactly along the supply-versus-financial line:
| Episode | Window | Commodities | S&P 500 | Outcome |
|---|---|---|---|---|
| Global Financial Crisis | Jun 2008 – Feb 2009 | −49% | −40% | Fell together |
| COVID crash | Jan – Mar 2020 | −22% | −19% | Fell together |
| Inflation shock | Dec 2021 – Sep 2022 | +18% | −18% | Diverged (hedged) |
The shift in tail behaviour shows up in a simpler statistic too. Before 2008, commodities and the S&P fell in the same month 13% of the time; after 2008, 20% of the time. Commodities became a less dependable hedge precisely in the financial drawdowns investors most want one. But the 2022 episode is decisive for the opposite point: in the largest inflation shock in four decades, commodities did exactly what the textbook promised, gaining 18% while equities lost 18%. For the equity side of these drawdowns, see every S&P 500 crash since 1950; for the financial-stress backdrop, see our NFCI vs. VIX stress audit.
In the two financial crises since 2008, commodities fell with stocks (−49% and −22%). In the one supply-driven inflation shock, they rose as stocks fell (+18% vs. −18%). The diversification that disappeared was the reliable kind; what remains is conditional on the shock being a supply shock.
Past co-movement is not predictive of future outcomes. Regime-conditional and episode statistics describe historical patterns, not expected returns.
The single most informative variable is the source of an equity sell-off. Financial-led stress (credit, liquidity, growth) has historically pulled commodities down with stocks; supply-led stress (energy, war, harvests) has historically pushed them the other way. The rolling commodity–equity correlation summarises which regime currently prevails: it was −0.34 in May 2026.
The correlation regime map
The rolling 24-month correlation is a descriptive gauge of how much diversification commodities are currently providing. It is a lagging, smoothed measure — not a forecast — but it summarises the prevailing regime in a single number.
Commodities are diversifying: they tend to move opposite to equities. Characteristic of the pre-2008 era and of supply-shock periods such as 2022. Latest reading (May 2026) sits here.
Little diversification either way. Commodity and equity returns are largely independent — the textbook “zero correlation” case, but without a reliable hedging benefit in drawdowns.
Commodities co-move with equities and provide little diversification. The dominant regime across 2008–2019, when the rolling correlation averaged +0.47. Common when financial conditions, not supply, drive both markets.
Because the measure is regime-dependent, the same portfolio decision can look very different depending on when it is made. An allocator sizing a commodity position for its diversification value is, implicitly, taking a view on whether the next major shock will be financial or supply-driven — a distinction the historical record makes unusually concrete.
Historical turning points
1994–1999 — The independent era
Through the 1990s the rolling correlation hovered around zero (mean −0.01), occasionally dipping negative. Commodities and equities responded to largely separate drivers, and the diversification case held without much drama.
2000–2007 — The commodity supercycle
The 2000s commodity boom — driven by Chinese industrialisation and a weak dollar — coincided with the most negative stretch of the correlation, which averaged −0.13 and reached −0.51 in 2004–2007. Commodities rose strongly while equities were comparatively flat, the high-water mark of commodities as a diversifier.
2008–2009 — The break
The Global Financial Crisis marks the regime change. Commodities fell 49% from June 2008 to February 2009, slightly more than the S&P’s 40% decline, as global deleveraging and collapsing demand hit both. The rolling correlation flipped sharply positive and, in the 2008–2012 window, averaged +0.52.
2010–2019 — The co-moving decade
Through the 2010s the correlation stayed firmly positive (2013–2019 mean +0.43). With financial conditions — central-bank liquidity, the dollar, risk sentiment — driving most market moves, commodities behaved much like a risk asset, offering little diversification.
January–March 2020 — COVID
The pandemic crash was another financial-style shock: commodities fell 22% as the S&P fell 19%, the rolling correlation reaching its all-time high of +0.79 in 2020. Once again, commodities did not cushion an equity drawdown.
2021–2022 — The supply shock exception
The post-pandemic inflation surge, amplified by the 2022 energy crisis, produced the clearest counter-example in the dataset. From December 2021 to September 2022 commodities rose 18% while the S&P fell 18% — a textbook diversification year, driven by exactly the supply-side forces that hurt equities.
May 2026 — Current observation
The latest rolling 24-month correlation is −0.34, back in diversifying territory and consistent with a period in which supply and inflation dynamics, rather than financial conditions, have been moving commodity prices. Whether this persists depends on the character of the next major shock.
Methodology
All figures are computed from monthly data, 1992–2026, and are reproducible from the dataset below.
Core definitions
Correlation = Pearson correlation of monthly returns (commodity basket vs. S&P 500)
Rolling 24m = correlation over a trailing 24-month window of monthly returns
Period and regime definitions
“Post-2008” = Jan 2009 to May 2026 (2008 treated as the transition year)
“Non-fuel” = IMF non-fuel commodity index (excludes energy)
Crisis windows are the equity-drawdown spans listed in the turning-points section.
2008 is excluded from the two-period correlations as the transition year. This is the conservative choice: including 2008 — whose extreme co-movement is the strongest single piece of evidence for the break — raises the post-break correlation to roughly +0.40 rather than lowering it.
Data construction
The commodity basket is the IMF Primary Commodity Price Index (all commodities, and the non-fuel sub-index), retrieved via FRED. It is a spot-price index, used here as a transparent public proxy for commodity returns; investable indices (S&P GSCI, Bloomberg Commodity Index) differ in level because of roll yield and collateral return, but the financialization literature documents the same post-2008 correlation rise in those series. One anomalous June 2026 observation in the IMF index was dropped; the series ends at May 2026. The S&P 500 monthly series splices Robert Shiller’s long-run monthly data (through September 2023) with the Eco3min FRED-based monthly close thereafter; the S&P is used as a price index (dividends excluded) to match the price-based commodity index.
Reproduction code
# Reproduce the core result from the published dataset
import pandas as pd

df = pd.read_csv("https://eco3min.fr/wp-content/uploads/2026/07/commodity-equity-correlation-v2.csv", parse_dates=["date"])
pre  = df[(df.date >= "1994-01-01") & (df.date <= "2007-12-31")]
post = df[(df.date >= "2009-01-01") & (df.date <= "2026-05-01")]
print(pre["commod_ret"].corr(pre["sp500_ret"]))    # -> -0.074
print(post["commod_ret"].corr(post["sp500_ret"]))   # -> +0.344
Dataset download & reproducibility
The dataset includes the commodity index (all and non-fuel), the S&P 500 monthly close, monthly returns, rolling 24- and 36-month correlations, an era label, a correlation-regime label, a both-down flag, and a crisis flag.
Eco3min Research (2026). Commodities Stopped Being a Reliable Diversifier After 2008: The Commodity–Equity Correlation, 1992–2026. Dataset and analysis, open access; source terms on the page. https://eco3min.fr/en/commodities-stopped-diversifying/
Data sources & references
- Primary International Monetary Fund — Primary Commodity Price Index, all commodities (FRED series PALLFNFINDEXM) and non-fuel (PNFUELINDEXM), monthly, index 2016 = 100.
- Primary Robert J. Shiller — long-run monthly S&P 500 price series (Yale, “Online Data”), used through September 2023.
- Primary Federal Reserve / FRED — S&P 500 index, used for the monthly close from October 2023 (Eco3min canonical S&P series).
- Research Tang, K. & Xiong, W. (2012), “Index Investment and the Financialization of Commodities,” Financial Analysts Journal 68(6).
- Research Cheng, I.-H. & Xiong, W. (2014), “Financialization of Commodity Markets,” Annual Review of Financial Economics 6.
- Reference Gorton, G. & Rouwenhorst, K. G. (2006), “Facts and Fantasies about Commodity Futures,” Financial Analysts Journal 62(2) — on the historical diversification case.
Methodological limitations
- The commodity series is a spot-price index, not an investable total-return index; roll yield and collateral return mean an investor’s realised commodity returns differ from those shown here, though the correlation pattern is documented to carry across.
- Pearson correlation measures linear co-movement only; it does not capture tail dependence or non-linear relationships, which can differ from the average.
- Rolling 24-month windows overlap, so adjacent values are autocorrelated; the full-period (non-overlapping) correlations are reported alongside to avoid over-reading the rolling series.
- The S&P 500 series is spliced from two sources; the splice point (September/October 2023) is well after the 2008 break and does not affect the structural conclusion.
- Period boundaries (1994–2007, 2009–2026) are choices; the conclusion is robust to including or excluding 2008, but a different break date would shift the precise figures.
Related Eco3min research
Frequently asked questions
Do commodities still diversify a stock portfolio?
Less reliably than before 2008. The correlation between a broad commodity basket and the S&P 500 was −0.07 over 1994–2007 and +0.34 over 2009–2026, so on average commodities now provide far less diversification. But the relationship is regime-dependent: in financial crises (2008, 2020) commodities fell alongside stocks, while in the 2022 supply-driven inflation shock they rose 18% as the S&P fell 18%. The diversification benefit is now conditional on the type of shock rather than dependable across all of them.
Why did the commodity–equity correlation rise after 2008?
The most cited cause is the financialization of commodity markets. From the mid-2000s, large pools of capital began allocating to commodities through index products, so commodity futures were increasingly bought and sold alongside equities by the same investors reacting to the same macro signals. Research by Tang and Xiong (2012) documents that the correlation between commodities and equities rose markedly after 2004 in step with the growth of index investment. Financialisation is one layer; the physical regime underneath — supply constraints, energy transition — is the other, and it is the subject of the pillar devoted to commodity regimes.
Did commodities protect investors in 2022?
Yes — 2022 is the clearest example of commodities working as a hedge in the entire dataset. From December 2021 to September 2022 the commodity basket rose 18% while the S&P 500 fell 18%. The reason is that the 2022 sell-off was supply-driven: the same energy and inflation shock that hurt equities lifted commodity prices. This is exactly the regime in which commodities still diversify, even in the post-2008 era of higher average co-movement.
Is the IMF commodity index the same as the S&P GSCI or Bloomberg Commodity Index?
No. The IMF Primary Commodity Price Index is a spot-price benchmark, while the S&P GSCI and Bloomberg Commodity Index are investable total-return indices whose returns include roll yield and collateral interest. The IMF index is used here because it is transparent and publicly reproducible. The financialization literature finds the same post-2008 rise in correlation using investable indices, so the structural conclusion holds across both — but the precise return levels differ.
What is the current commodity–equity correlation?
As of May 2026 the rolling 24-month correlation is −0.34 — back in diversifying territory. This is consistent with a period in which supply and inflation dynamics, rather than financial conditions, have been driving commodity prices. It does not contradict the post-2008 finding: the average correlation since 2009 is +0.34, but the regime swings, and the recent swing is toward diversification.
Last updated — 16 September 2026
Disclaimer – Financial Information: The analyses, commentary, and content published on eco3min.fr are provided for informational and educational purposes only. They do not constitute investment advice or a solicitation to buy or sell financial instruments. Past performance is not indicative of future results. All investment decisions involve risk and are the sole responsibility of the reader.