
Commodities and the Business Cycle: A Leading Indicator of Economic Regimes

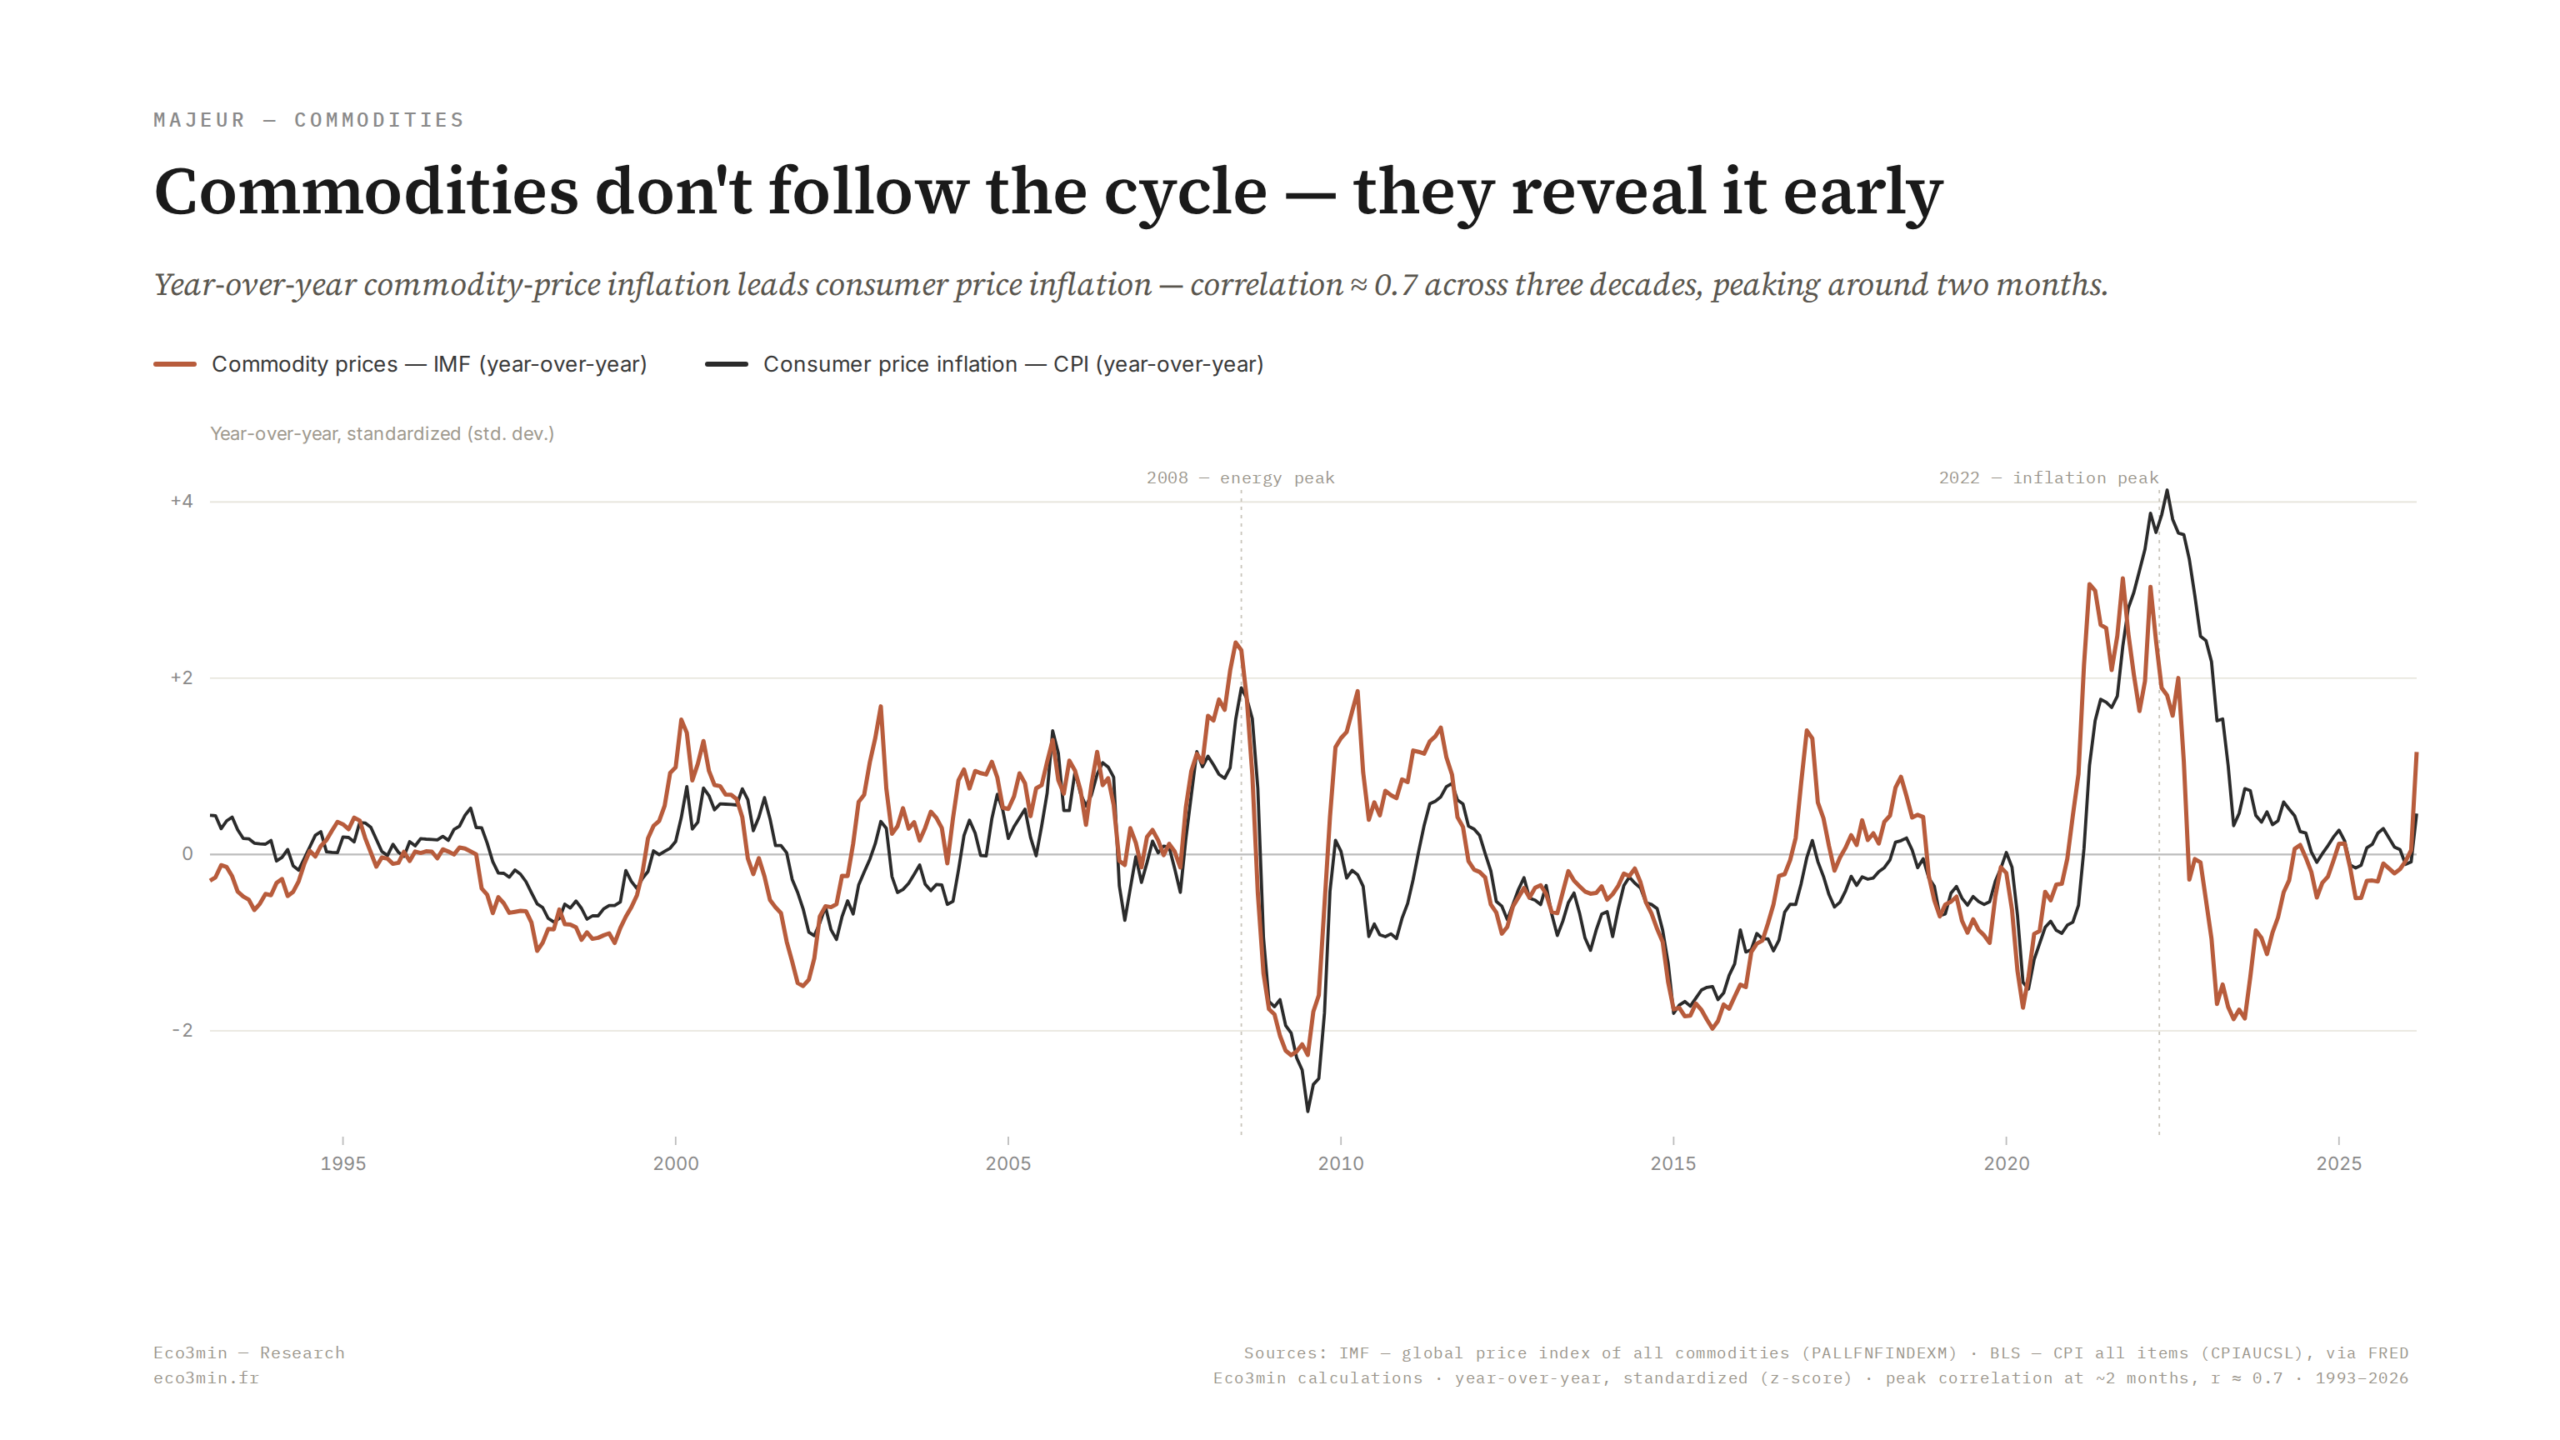
Commodities are not ordinary goods. They sit at the intersection of investment cycles, monetary arbitrage, and emerging geopolitical fault lines — and their signals consistently land ahead of traditional macroeconomic indicators.
TL;DR
With extractive capex still about 25% below its 2014 peak, commodities flag a constrained supply regime that inflation and GDP data have yet to register.
- Commodities lead inflation and production cycles by 3 to 6 months (BIS, IMF); the informative reading is the mix of declining capex, thinning inventories and widening regional spreads, not the spot price.
- A core split separates financial-cycle commodities (gold, silver), which track liquidity and real rates, from real-cycle ones (energy, industrial metals); gold's 2024–2025 records flag risk aversion and central-bank buying, not scarcity (World Gold Council).
- Geopolitical fragmentation adds a rigidity beyond geology and capital: since 2022 the same commodity trades at persistently different regional prices with no immediate arbitrage (IMF, OECD).
How commodities anticipate macroeconomic turning points
Commodities do not follow the business cycle. They reveal it in advance through investment dynamics and supply constraints.
Commodity markets function as a primary macroeconomic transmission channel. Pressures on supply capacity, extractive investment cycles, and supply-chain fragmentation emit early signals on the inflation path, the sustainability of economic policies, and the phase of the real cycle — often several quarters before conventional indicators catch up. Commodities as macro regime signals places this within a broader frame.
Read this way, commodities stop being vehicles for directional speculation and become diagnostic tools for the real economic cycle. For allocators, policymakers, and industrial executives, the signal coming out of commodity markets is an essential complement to traditional macro indicators. This article unpacks the mechanisms through which commodities signal regime shifts and their implications for the current cycle. A parallel read: Copper Stocks: Why the Shortage Threatens Markets.
Financial markets underestimate a structural fact: commodity prices do more than track the balance between physical supply and demand. They capture capacity constraints, investment dead ends, and value-chain dislocations long before those tensions show up in statistical aggregates — GDP, inflation, industrial production. This informational lead is documented by the BIS (Annual Report 2025) and the IMF (World Economic Outlook, October 2025): commodity price indices are significant leading indicators of inflation and production cycles, with a 3 to 6 month lead. Read alongside: Brent: The Market Is Underpricing a Looming Supply Crunch.
This perspective sits inside the broader framework of the global dynamics of commodities in the world economy and connects with the analysis of the indirect transmission of economic policy through commodities.
- Commodities signal macro regime shifts 3 to 6 months before conventional indicators
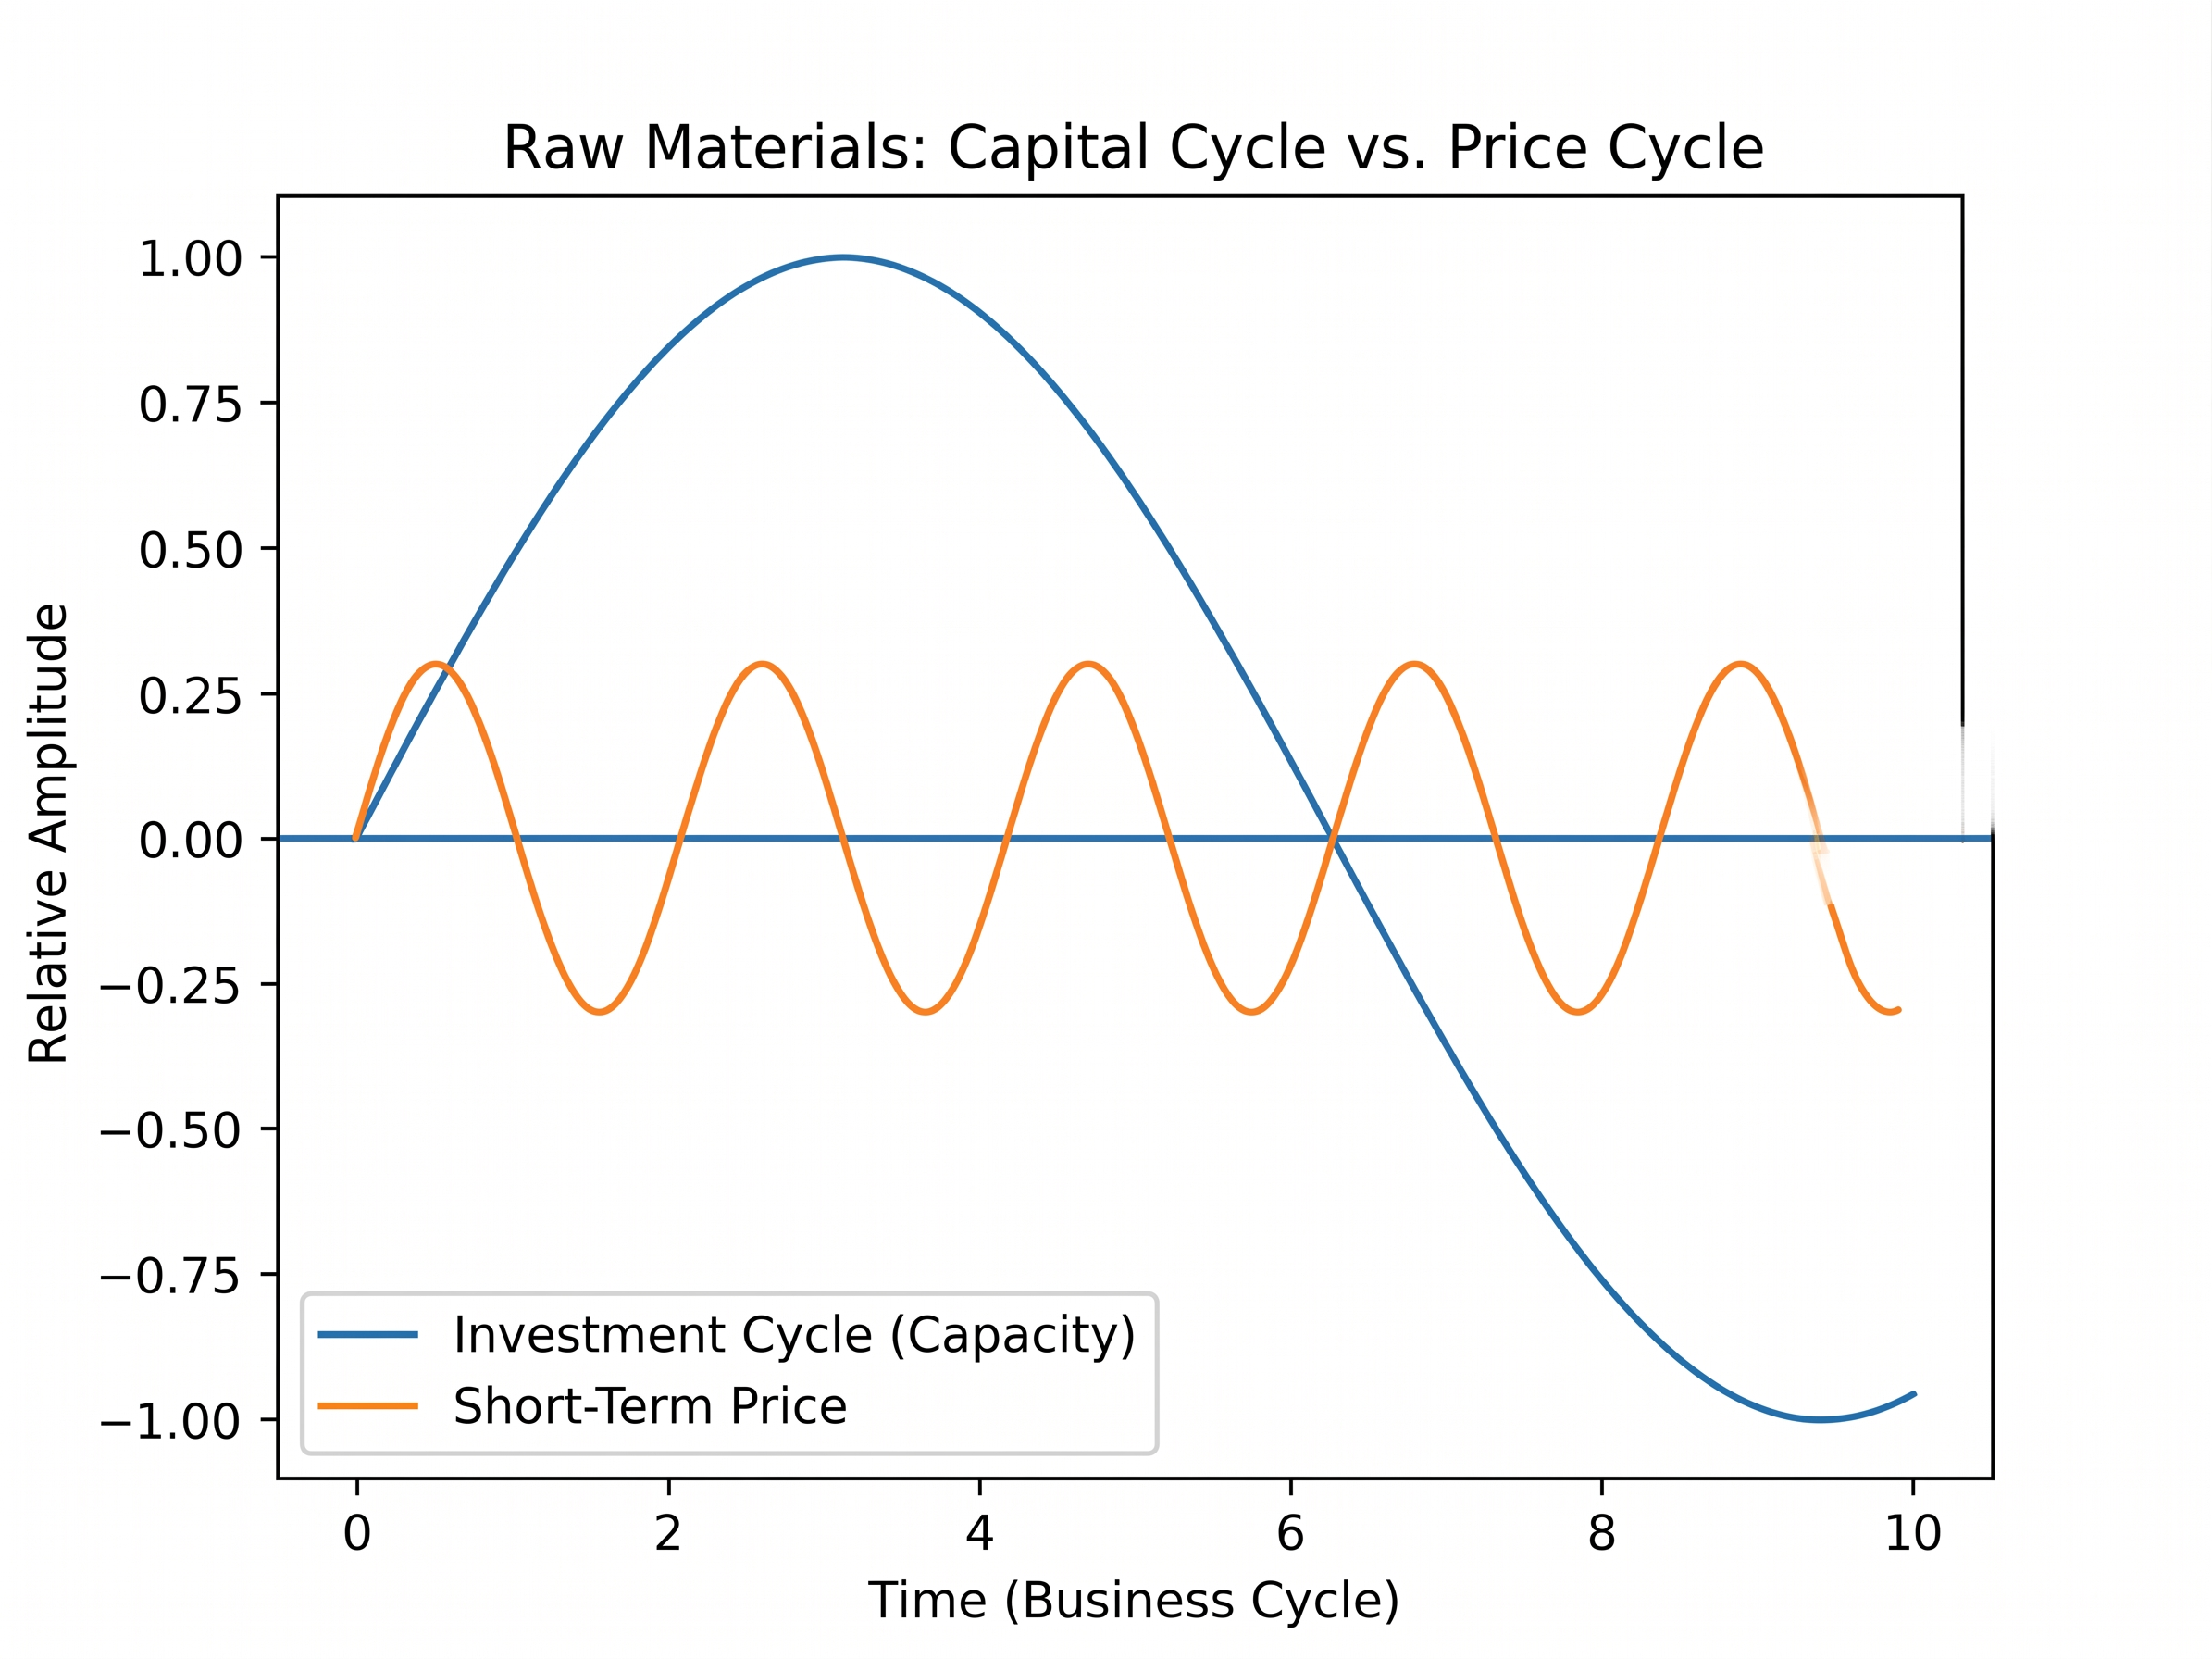
- The decisive cycle is the investment cycle (5–12 years), not short-term price moves
- Geopolitical fragmentation turns commodities into strategic variables whose signals extend beyond physical supply and demand
Commodities do not follow the business cycle. They reveal it in advance. Their informational value rests on three transmission channels: the extractive investment cycle (whose 5–12 year inertia anticipates future supply constraints), the monetary channel (real rates and the dollar, which jointly set extractive capital costs and commodity valuations), and the geopolitical channel (value-chain fragmentation creating persistent cross-regional price asymmetries). This three-fold leading-signal function is documented by the BIS, IMF, and IEA. The current setup — cumulative underinvestment, positive real rates, rising fragmentation — points to a constrained regime in which commodities continue to flag imbalances that conventional macro indicators have yet to capture.
The core mechanism: three channels through which commodities signal the macro regime
Commodities’ capacity to anticipate regime turning points rests on a three-channel causal chain that runs simultaneously and reinforces itself.
Supply-capacity constraints (investment cycle) + Monetary pressure (real rates, dollar) + Geopolitical fragmentation (regionalization of flows) → Stress signals in prices and market structures (contango/backwardation, inventories, regional spreads) → Materialization in macro indicators (inflation, production, employment) with a 3–6 month lag
Channel 1: the investment cycle as a leading signal. The fundamental cycle in commodities is not price — it is investment. Between the exploration of a deposit and the start of production, lags are measured in years: 7 years for conventional oil, 10 years for copper, 12 years for lithium (IEA, World Energy Outlook 2025). The inertia means today’s investment decisions (or their absence) set tomorrow’s supply constraints for the next decade. When extractive capex declines — as it has since 2014, with oil exploration-production spending still 25% below its peak despite comparable prices (IEA, World Energy Investment 2025) — the signal is clear: future supply will be constrained, regardless of short-term price moves. The signal precedes its macroeconomic materialization by years, giving extractive capex data greater diagnostic value than spot prices. The breakdown of price formation through supply-demand time asymmetry details how supply inertia translates into price volatility.
Channel 2: monetary transmission through real rates and the dollar. Commodities are a domain where monetary policy lands with particular intensity and speed. Real rates operate through two simultaneous channels: on the supply side, higher real rates raise the cost of capital for extractive projects (whose return horizons span decades), slowing investment and prolonging capacity constraints. On the pricing side, the dollar — in which most commodities are priced — acts as a distortion filter: a strong dollar compresses real prices for non-dollar buyers. The BIS (Annual Report 2025) formalizes this dual transmission, showing a significant negative correlation between real rates and extractive capex (2–3 year lag) and between the DXY index and real non-energy commodity prices (–0.5 over 2000–2025, World Bank data). The mechanism makes commodities the first arena where monetary policy “bites,” often before effects show up in credit or employment. The framework of the role of real rates and global financial conditions provides the analytical foundation. A companion piece: the fragility of concentrated soft markets.
Channel 3: geopolitical fragmentation as a new structural rigidity. The paradigm of a fluid, unified global commodity market is fracturing. Trade tensions, sanctions regimes, and supply-security policies are driving the regionalization of flows, documented by the IMF (World Economic Outlook, October 2025) and the OECD in its geo-economic fragmentation work. Value chains splinter: two regions now display radically different prices for the same commodity, with no possibility of immediate arbitrage. Security premia rise — not because demand is surging, but because access to certain resources depends on political alliances or dedicated infrastructure. Fragmentation adds a layer of structural rigidity to supply — beyond geological and capital constraints — amplifying the signaling value of regional price spreads. The new geopolitical front of critical minerals is the most advanced illustration. The role of producer countries in price cycles shows why fiscal trade-offs and rent strategies among exporting states extend tensions beyond initial financial signals.
- Lead on inflation: commodity price indices lead CPI inflation by 3 to 6 months in advanced economies. Source: BIS, IMF WEO.
- Extractive capex: –25% vs the 2014 peak in oil exploration & production, despite comparable price levels. Source: IEA, World Energy Investment, 2025.
- Capex/real-rate correlation: negative, 2–3 year lag — today’s underinvestment translates into supply constraints by 2027–2030. Source: BIS, 2025.
- DXY/non-energy commodities correlation: –0.5 over 2000–2025. Source: World Bank, Commodity Markets Outlook.
- Fragmentation: persistent regional price differentials for the same commodity, widening since 2022. Sources: IMF, OECD.
Declining extractive capex + positive real rates (investment headwind) + commercial inventories below averages + rising trade-flow fragmentation → commodities are signaling a constrained regime that conventional macro indicators (GDP, inflation) do not yet fully reflect.
What the consensus reads correctly — and the structural signal it misses
The dominant view, carried by commodity desks and echoed in major institutional outlooks, assumes a normalization scenario: prices stabilize, supply gradually adapts to past price signals, and substitution effects (innovation, source diversification) ease structural tensions. The diagnosis is not unfounded — previous cycles did show a supply response with a 3–5 year lag.
Its weakness lies in conflating price stabilization with the resolution of underlying constraints. Apparently stable prices can coexist with persistent underinvestment, declining inventories, and increasing supply-chain fragmentation. Crude oil is the test case of the moment, examined in the Brent pullback, easing or pause before tension. The consensus treats commodities as price assets (that go up or down) when they function as regime assets (that signal structural configurations). The distinction is fundamental: the informative signal is not the price level but the combination of declining capex, falling inventories, and widening regional differentials — a configuration that flags a constrained regime even when prices appear contained.
The most costly consensus mistake is reading stable prices as a return to equilibrium. Stability may reflect a constrained market where quantities — not prices — bear most of the adjustment: fewer transactions, shrinking inventories, supply that no longer responds to price signals because the cost of capital and regulatory uncertainty block investment. The role of inventories in price formation and the analysis of marginal cost of production illuminate these mechanisms.
Reading stable prices as a return to equilibrium. Stability can mask a constrained regime where adjustment runs through quantities (declining inventories, fewer transactions, stalled investment) rather than prices. The informative signal is not the spot price but the capex / inventories / regional differentials combination — three variables that reveal the true state of the supply cycle. Related discussion: refining margins as the hidden driver of oil profits. A second mistake: treating commodities as a homogeneous set. The distinction between financial-cycle commodities (precious metals, highly financialized products) and real-cycle commodities (energy, industrial metals, agriculture) is analytically decisive.
| “Back to normal” view | Regime-signal view | |
|---|---|---|
| Focus | Spot prices and quarterly physical supply/demand balance | Extractive capex, inventories, regional differentials, marginal cost |
| Implicit assumption | Price signals are sufficient to restart investment | Real rates + regulatory uncertainty + fragmentation block the response |
| Time horizon | 1–4 quarters | Full cycle (5–12 years for supply) |
| Stable prices = | Equilibrium restored | Possible constrained regime (adjustment via quantities, not prices) |
| Key variable | Spot price, forecast consensus | Sector capex, term structure (contango/backwardation), regional spreads |

Two speeds, two logics: financial-cycle commodities vs real-cycle commodities
The most widespread mistake is treating commodities as a uniform asset class. In practice, a fundamental analytical distinction is required between two categories whose behaviors differ radically — and the quality of any regime diagnosis hinges on it.
Financial-cycle commodities. Some commodities primarily follow capital-flow dynamics. Their valuations fluctuate with liquidity conditions, portfolio allocation strategies, and interest-rate and inflation expectations. For a deeper dive: Commodities, Inflation, and Monetary Policy: The Transmission Mechanism. Gold and silver, precious metals broadly, and highly financialized commodities (where non-commercial CFTC positions dominate volumes) fall into this category. Their signal is essentially a financial-conditions signal, not a physical-constraint signal. Gold at record highs in 2024–2025 signals risk aversion and central-bank buying (World Gold Council data), not metal scarcity.
Real-cycle commodities. Energy, industrial metals, agricultural products respond primarily to physical constraints: extraction capacity, infrastructure conditions, climate shocks, logistical bottlenecks. Their evolution depends less on short-term capital flows than on investment decisions made years earlier. The category is what gives commodities their role as leading indicators of the real cycle. Tensions in the copper market — sometimes nicknamed “Dr. Copper” for its ability to diagnose industrial health — or in the natural gas market typically reflect industrial or energy constraints already forming well before inflation or industrial-production data register them. Palladium is an extreme case: extreme geographic concentration of production, structurally rigid demand, near-zero short-term adjustment capacity.
Interaction between the two logics. Analytical complexity comes from the interaction between these categories. Monetary tightening weighs on financial-cycle commodity prices (via the dollar and real rates) while amplifying supply constraints for real-cycle commodities (via the cost of capital that slows investment). The result is a blurred short-term signal — falling prices despite rising supply constraints — but a powerful cycle-horizon signal: underinvestment accumulated under high real rates will materialize as supply tensions when demand recovers. This interaction sits at the core of the analysis of price formation through time asymmetry.
Implications for reading the current cycle
Macro diagnosis. Real-cycle commodities are sending an ambivalent signal at end-2025: spot prices remain contained under pressure from a strong dollar and positive real rates, but structural indicators (declining capex, inventories below averages, rising fragmentation) flag a constrained regime. The configuration is consistent with a cyclical-slowdown diagnosis (financial pressure on prices) combined with accumulating structural supply constraints (underinvestment). The gap between the two — low prices today, supply tensions tomorrow — is the most informative signal for the upcoming cycle. The structural lags of macroeconomic indicators make commodities all the more valuable as leading signals.
Inflation outlook. If the investment-cycle framework holds, commodity prices embed a latent inflation signal that current inflation measures do not capture. Cumulative underinvestment, supply-chain fragmentation, and inventory erosion create the conditions for a potential supply shock at the cycle horizon — a second-round inflation risk that demand- and expectations-centered models overlook. The inflation path will depend on the interaction between this latent supply signal and global demand dynamics, themselves conditioned by the lagged transmission of restrictive monetary policy.
Asset allocation and industrial strategy. Commodities offer a richer macro-regime lens than short-term performance signals alone. They help contextualize inflation dynamics, assess the sustainability of monetary policy, and gauge supply-chain disruption risks. For corporations, understanding real supply cycles helps anticipate input-cost pressures and availability constraints regardless of immediate price fluctuations. This reading sits inside the broader framework of financial market functioning mechanisms.
Invalidation condition. The framework loses relevance if a major negative demand shock (deep global recession) eliminates structural supply tensions, if a rapid and sustained decline in real rates massively revives extractive investment, or if geopolitical de-escalation reduces fragmentation premia and restores fluid global trade flows. A major technological breakthrough in extraction or substitution could also change the outlook. Conversely, geopolitical escalation, an energy shock, or an acceleration of the energy transition would amplify constraint signals and strengthen the diagnostic value of commodities.
Three time horizons for interpreting commodity signals
Short term (0–6 months): financial conditions dominate price signals. Indicators to monitor: real rates, DXY, CFTC positioning, commercial inventory levels (EIA, IEA), and the term structure (contango vs backwardation). Persistent backwardation in certain segments (oil, industrial metals) flags physical tightness that spot prices alone fail to capture. The short-term risk is a widening disconnect between the financial signal (contained prices) and the physical signal (declining inventories, capacity under strain).
Cycle horizon (1–3 years): cumulative underinvestment starts materializing as supply constraints. The key variable is the trajectory of global physical demand — conditioned by the phase of the real economic cycle — and its capacity to reveal accumulated supply tensions. If demand accelerates (global recovery, faster energy transition) against constrained capacity, real-cycle commodities will signal a regime shift ahead of macro indicators. The World Bank (Commodity Markets Outlook 2025) estimates investment in transition metals must triple by 2030 to meet climate objectives — an unprecedented pace. On this point: commodities as macroeconomic regime signals.
Structural horizon (5+ years): the energy transition reshapes the demand structure. Transition metals (copper, lithium, cobalt, nickel) enter a structurally rising demand cycle while hydrocarbons approach a plateau (IEA central scenario). One of those metals doubles as a macro thermometer, read in copper prices as a signal of global reindustrialization. Geopolitical fragmentation creates parallel supply chains and permanent security premia. The reconfiguration turns commodities from economic inputs into geostrategic variables whose signals inform cycle analysis far beyond their traditional role. Regular monitoring of the weekly macro dashboard integrates these dynamics.
Commodities do not follow the economic cycle — they reveal it in advance through investment dynamics, monetary transmission, and geopolitical fragmentation. The decisive cycle is not the price cycle (the interaction between financial demand and monetary conditions) but the investment and supply-capacity cycle (whose signals precede macro-indicator materialization by years). The current configuration — cumulative underinvestment, positive real rates, rising fragmentation — signals a constrained regime that short-term prices, under financial pressure, do not yet reflect. The most informative signal is not the price level but the capex / inventories / regional differentials combination, which gives the best available diagnosis of the true state of the supply cycle.
Robust: The leading-indicator role of commodities for inflation and the production cycle (3–6 month lead) is documented by the BIS and IMF. Extractive supply inelasticity over horizons below five years is a structural fact. Cumulative underinvestment since 2014 is measurable in capex data. Dual transmission via real rates (extractive cost of capital) and the dollar (real commodity prices) is formalized. Geopolitical fragmentation of value chains is observable through regional price differentials.
Uncertain: The precise timing of supply-constraint materialization depends on the trajectory of global demand, itself conditioned by the economic cycle. The scale of acceleration in transition-metal demand (dependent on the pace of the energy transition) shows widely dispersed estimates. The ability of prices to remain sustainably above or below marginal cost — and the speed of correction once thresholds are crossed — varies across cycles. The possibility of a deep global recession temporarily erasing supply constraints remains an open scenario.
Reading commodities as regime indicators rather than directional price signals provides a sturdier framework for diagnosing the cycle phase, anticipating structural inflation pressures, and assessing vulnerabilities in global supply chains.
- Commodities do not follow the cycle — they reveal it in advance through investment (5–12 years), monetary transmission (real rates, dollar), and geopolitical fragmentation.
- The decisive cycle is investment and supply capacity, not short-term prices. Extractive capex down 25% since 2014 signals future supply constraints current prices do not reflect.
- The distinction between financial-cycle commodities (gold, precious metals) and real-cycle commodities (energy, industrial metals) is analytically fundamental — they do not send the same signal.
- Stable prices do not mean equilibrium: the combination of declining capex + falling inventories + widening regional spreads signals a constrained regime where adjustment runs through quantities, not prices.
- The framework is invalidated if a negative demand shock removes supply tensions, if falling real rates revive investment, or if a technological breakthrough shortens supply-adjustment timelines. For more detail: the arabica premium over robusta.
Last updated — 12 July 2026
Disclaimer – Financial Information: The analyses, commentary, and content published on eco3min.fr are provided for informational and educational purposes only. They do not constitute investment advice or a solicitation to buy or sell financial instruments. Past performance is not indicative of future results. All investment decisions involve risk and are the sole responsibility of the reader.
Read next
Full pillar →IMO 2020: the regulatory shock that rewrote product spreads
An environmental rule on marine sulfur can move a refining spread more than a swing in crude. IMO…
The 2022–2023 refining golden age: anatomy of an episode
In 2022, refined fuel prices climbed faster than crude. That gap, measured by the 3-2-1 crack spread, reached…
Diesel versus gasoline: why the two crack spreads diverge
The 3-2-1 crack blends gasoline and distillate into a single number, and that convenience hides something the market…


