
The Copper-Gold Ratio as a Macro Signal: Still a Reliable Gauge of Treasury Yields in 2024-2026?

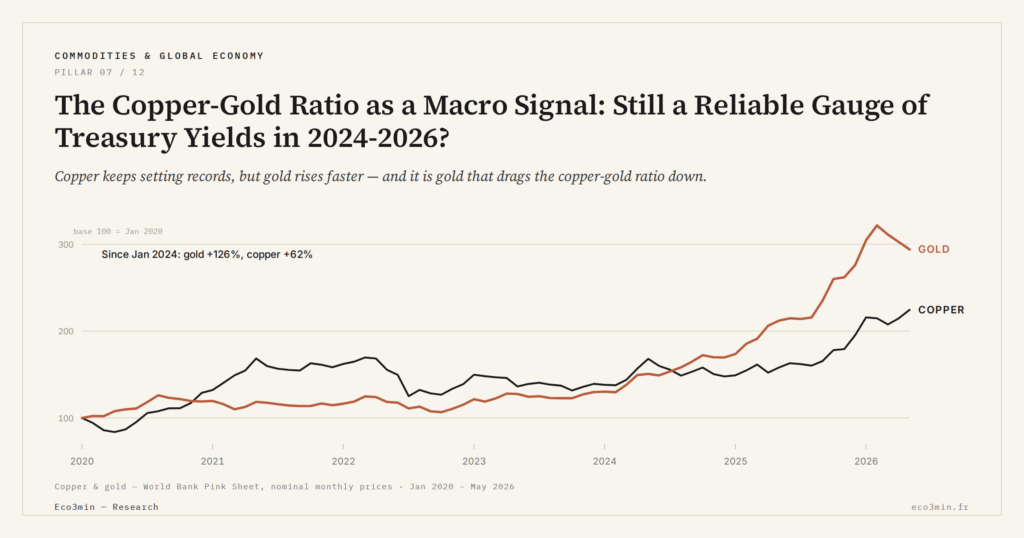
The copper-gold ratio pits a growth metal against a safe haven, and for years it tracked the 10-year US Treasury yield. Since 2024 the two have split apart: the ratio has collapsed while yields have stayed high.
TL;DR
For years the copper-gold ratio tracked the 10-year Treasury yield closely; since 2024 the two have split, the ratio sinking to multi-decade lows while yields held near or above 4%, then crossed 5% in mid-September 2026.
- The fall came from the denominator: gold rose faster than copper, so the ratio slid to multi-decade lows even as copper itself cleared $12,000 a tonne in December 2025.
- The 60-day rolling correlation between the ratio and the 10-year US yield dropped close to zero in early 2026: 0.04 on monthly levels from January 2024 to July 2026, against 0.6-0.8 depending on the window over 2000-2021 (Pink Sheet and FRED).
- Both legs lost their cyclical anchor: copper lifted by mine scarcity and electrification, gold by record central-bank buying since 2022 aimed at cutting reliance on dollar reserves.
- Jeffrey Gundlach, who popularized the ratio-yield link in 2018, has publicly called its use to forecast the 10-year a failure and now favors oil prices and the dollar index.
Understanding why the compass drifted means reading its two needles separately: copper pulled by supply and electrification, gold lifted by monetary distrust. Neither now follows the cycle.
What the copper-gold ratio measures
The copper-gold ratio is a division: the price of a tonne of copper over that of an ounce of gold. Its logic fits in a sentence. Copper is a diffuse industrial input — wiring, motors, grids — so its demand tracks the pace of activity, making it a growth proxy. Gold yields nothing and serves as a store of value when uncertainty dominates: a fear proxy. Dividing one by the other measures risk appetite, expected growth set against ambient fear. Gold as a monetary safe haven and industrial copper demand form the two poles of a single thermometer. More on this: the gold-to-silver ratio and its mean-reversion tendency.
The appeal of that thermometer came from its observed link to long rates. Investor Jeffrey Gundlach popularized the idea in 2018: the copper-gold ratio and the 10-year Treasury yield moved almost in lockstep, the latter appearing to follow the former with a short lag. Across the two decades from 2000 to 2021, the medium-term correlation between the two series ran between 0.6 and 0.8 depending on the window (0.63 on monthly levels over 2000-2021, 0.81 over 2003-2021, Pink Sheet copper and gold against DGS10), high enough to entrench the ratio as a leading indicator for yields. The mechanism looked robust: when the economy accelerates, copper rises, gold stalls, the ratio climbs, and bond yields rise to price stronger growth and inflation. When doubt sets in, the move reverses symmetrically.
That elegance explains its spread well beyond specialist circles. An investor trying to anticipate the direction of rates had a readable, free, continuously updated signal, where conventional macro models demand heavy assumptions. The copper-gold ratio series is built from two public quotes, with no proprietary model. The catch is that both legs of the reasoning — growth for copper, fear for gold — must remain the dominant forces behind each price. That condition is exactly what gave way.
The ratio gained its standing because it distilled a sound intuition over a long stretch. Between the joint peaks of the ratio and yields in early 2020, just before the pandemic recession, and again in 2022 ahead of the slowdown, the two series topped together at the cycle’s major inflection points. That synchrony at the turns reinforced the idea that the ratio captured, better than lagging indicators, the moment risk appetite flips. It is that reputation, built on decades of coincidence, that the current episode puts to the test.
Since 2024, the signal has broken — in the unexpected direction
The market’s instinctive read of 2024-2026 was misleading. Copper printed record after record, clearing $12,000 a tonne in December 2025 and peaking intraday at $14,527.50 on 29 January 2026 on the London Metal Exchange — its sharpest single-day gain since 2008, per Benchmark Mineral Intelligence. Many concluded the copper-gold ratio was soaring and flagging a global acceleration. The opposite is true: over the same span gold rose faster still, so the ratio — a quotient, not a price — fell toward multi-decade lows. The move was driven by the denominator, not the numerator. Background: The Copper/Gold Ratio: Growth Against Safe Haven.
Crucially, yields did not follow that decline. The 10-year US Treasury dipped below 4% on only five days across 2025-2026 (a 3.97% low on 22 October 2025), its monthly averages running from 4.1% to 4.7% before it crossed 5% on 16 September 2026. Source: the FRED DGS10 series for the 10-year Treasury yield. Historically, a ratio this depressed would have implied yields falling sharply, toward 2% or below. Nothing of the sort occurred. The 60-day rolling correlation between the ratio and the 10-year dropped close to zero in early 2026; on monthly levels it stands at 0.04 from January 2024 to July 2026, against 0.63 over 2000-2021 on the same series: a near-total breakdown of the relationship. The compass and the map no longer point the same way.
Update, September 2026: the ratio hit its lowest point since the Pink Sheet series began in 1992 in February 2026, at 2,580 dollars a tonne per ounce, then rebounded 29% to 3,325 in July as gold fell back (5,020 dollars an ounce on average in February, 4,073 in July); the 10-year US yield rose from a 4.1% average in February to 4.9% in September, reaching 5.01% on 16 September 2026 (FRED, DGS10). The two series moved in the same direction again, but through the denominator (gold retreating) and the term premium, not through a growth signal. For context: the turn to episodic diversification.
The clearest sign of the break comes from the indicator’s own source. Gundlach has publicly called the use of the copper-gold ratio to forecast the 10-year a failure, and said he now prefers oil prices and the dollar index to gauge the direction of rates. When the author of a signal removes it from his own toolkit, the working hypothesis warrants re-examination rather than defense. The question is no longer whether the ratio fell — it did — but why its fall stopped saying anything about yields. Worth reading alongside: the trade-offs across commodity access routes.
It is often said that copper’s 2025-2026 records lifted the copper-gold ratio, confirming a growth signal. That is wrong: the ratio collapsed because gold rose more. Confusing the price of copper with the copper-to-gold ratio inverts the signal entirely. A related read: Iron ore’s China gauge against copper.
The “growth” needle distorted: copper pulled by supply and electrons
The first broken condition concerns copper. For the metal to remain a cycle proxy, its rise must reflect cyclical demand. Yet a growing share of the move comes from structural forces indifferent to quarterly GDP. On the supply side, scarcity is partly built in: the International Energy Agency and S&P Global estimate it now takes close to sixteen to seventeen years to move a mine from discovery to production, while average ore grades have fallen by roughly 40% since 1991. Supply that inelastic pushes prices up with no acceleration in present demand. The balance of divergences across industrial metals becomes the way to separate the cycle from the metal.
On the demand side, electrification layers a secular pull on top of the cyclical one. An electric vehicle uses on the order of 80 kilograms of copper against roughly 25 for a combustion car, by industry estimates; add grids, storage and AI datacenter construction, whose copper appetite does not depend on the business cycle. The IEA projects a supply shortfall on the order of 30% by 2035 in its reference case. This copper demand tied to electrification sits atop traditional construction and industrial demand, blurring the metal’s read as a cyclical gauge.
The sharpest paradox involves China. The world’s largest copper consumer saw its refined-metal demand contract by roughly 8% year-on-year in the fourth quarter of 2025, per Goldman Sachs, as the boost from stimulus and tariff front-loading faded. That copper set records while its main cyclical outlet shrank is the most direct illustration of a rise owing almost nothing to cyclical demand — and it confirms the ratio’s numerator has stopped being a pure growth thermometer.
The market itself hesitated. In early 2026 StoneX analysts judged the price “unsustainable” and detached from fundamentals, while Goldman Sachs still expected a small global surplus for 2026 — evidence that no consensus of imminent shortage justified the surge. Monthly copper spot prices trace a path that owes as much to supply as to the cycle. Mining executive Robert Friedland has framed the constraint starkly: merely to sustain 3% global growth, before electrification or datacenters, the world must mine as much copper over two decades as in the whole of recorded history.
A third, purely regulatory factor amplified the rise with nothing owed to the cycle. The prospect of US tariffs on refined copper, expected during 2026, triggered a massive inflow of metal to the United States: COMEX inventories hit records while LME European warehouses fell below 20,000 tonnes in early 2026, creating an artificial regional squeeze. Part of the surge therefore reflects inventory arbitrage front-running a trade barrier, not new industrial demand — a further blurring of the growth signal copper is meant to carry.
The “fear” needle distorted: a gold of monetary regime
The copper-gold ratio isolates risk appetite only if both components stay governed by the cycle: growth for copper, fear for gold. The moment a non-cyclical force — mining scarcity on one side, monetary regime on the other — drives either price, the quotient measures something other than what it claims to.
The second broken condition concerns gold, and it explains most of the ratio’s fall. In the classic frame, gold rises when real rates fall and fear builds. The 2024-2026 move obeys a different logic. Central banks, especially in emerging economies, have accumulated gold at a record pace since 2022, part of a broader move to reduce reliance on dollar reserves and sovereign US risk. That institutional demand answers not to the business cycle but to a slow recomposition of the monetary order. The ratio’s denominator has therefore appreciated for reasons largely disconnected from the “cyclical fear” it is meant to capture.
Fiscal worries compound it: the scale of US deficits and the volume of Treasury issuance weigh on both gold’s appeal and the level of yields. The gold price history thus reflects a monetary and geopolitical premium more than an imminent-recession signal. When gold rises because monetary credibility is in question, rather than because growth is slowing, a falling copper-gold ratio no longer flags lower yields: it records a regime shift that its construction cannot tell apart from a simple bout of cyclical fear.
One detail confirms the regime shift. In the usual mechanics, gold falls when real rates rise, because holding a yieldless asset becomes costly against better-paid inflation-linked bonds. Yet over 2024-2026 gold set records — durably clearing $3,000 an ounce — even as US real yields stayed positive and high. That advance against its classic cyclical driver is, in itself, the fingerprint of monetary and geopolitical demand overriding the logic of real rates. In depth: how the 1980 real peak was exceeded.
Why yields did not follow the ratio down
That leaves the third piece: the behavior of rates themselves. If the 10-year did not ease despite a floored ratio, it is because forces specific to the bond market kept it high. US inflation proved persistent, reaccelerating in spring 2026 partly on energy costs, to the point that markets priced out cuts and priced in the possibility of further Federal Reserve tightening. A regime of yields durably above 4% changes the nature of the signal: the 10-year no longer answers to growth expectations alone, but to a mix of inflation, debt supply and term premium. Also relevant: our reading of commodity cycles and inflation.
That term premium — the compensation demanded for holding a long bond rather than rolling short paper — is precisely the channel the copper-gold ratio cannot see. Deficits, heavy issuance and softer foreign demand for Treasuries push the premium higher, supporting yields independently of the cycle. On top sits the mid-2026 backdrop: tensions in the Middle East and around the Strait of Hormuz lifted energy prices and fed inflation, shutting the door on any quick easing. Copper’s pass-through to inflation illustrates how a metal supply shock can feed cost inflation with no demand acceleration — exactly the kind of episode that keeps yields elevated while the ratio falls.
The picture is internally coherent. All three conditions gave way at once: copper rising as much on supply as on the cycle, gold rising on monetary regime, and yields driven by inflation and term premium. Within commodities in the global economy, the copper-gold ratio looks less like a faulty compass than an instrument calibrated for a world — one where demand sets prices — that is no longer quite ours. Directly related: our sub-pillar on commodities as macro signals.
That dynamic has a history. The term premium had been compressed, even negative, through the quantitative-easing decade, when central-bank asset purchases absorbed long-duration supply. Its rebuild since 2022 marks the reverse path: shrinking balance sheets, heavy net issuance to fund deficits, and softer foreign demand. As long as those forces dominate, yields can stay high regardless of any growth expectation — depriving the copper-gold ratio of the very channel through which it claimed to anticipate them. Data reference: The term-premium record.
Passing noise or a broken compass?
Should the copper-gold ratio be buried, then? Caution argues for distinguishing a temporary break from lasting obsolescence. Divergences between the ratio and yields are not new: comparable gaps appeared at the end of the 2018 tightening cycle and again in 2022 before the relationship reset. What sets the current episode apart is the simultaneity of three structural distortions and their anchoring in long trends — energy transition, de-dollarization, deficits — that will not unwind in a few quarters. The ratio could become readable again if a genuine cyclical shock took over, returning demand to the controls of both prices; nothing guarantees that return. For the broader picture: our reading of direct bonds versus funds.
A more measured reading treats the ratio not as a yield predictor but as a relative-value gauge between two regimes — industrial growth on one side, monetary refuge on the other. In that frame, its 2024-2026 decline tells a real story: a world where physical scarcity and monetary distrust outweigh cyclical momentum. Past supercycles that disappointed are a reminder, though, that a high price eventually funds its own correction through new mines, recycling and substitution — and that extrapolating the current path in a straight line would be a methodological error.
That corrective mechanism is not theoretical. Durably expensive copper stimulates secondary supply — scrap recycling — and encourages substitution by aluminum in some uses, from wiring to certain equipment. These adjustments take time, but they eventually loosen the supply constraint now supporting the price. If scarcity eases while monetary gold demand recedes, both needles of the ratio could regain their cyclical anchor — a possible scenario, by no means assured, and one that nothing in the mid-2026 configuration signals near-term.
The copper-gold ratio did not lie about yields: it stopped measuring growth, with both of its components now driven by supply and money rather than by the cycle.
The copper-gold ratio keeps a descriptive value, provided it is read for what it has become: the relation between a metal made scarce by its geology and an asset sought for its monetary neutrality. As how commodity cycles transmit to markets sets out, an indicator is never valid in the abstract: it is valid under specific regime conditions. When those conditions change, the signal is not wrong — it answers a different question from the one being asked. Which question, exactly, is where the analysis now moves.
- The copper-gold ratio tracked the 10-year Treasury yield with a correlation of 0.6 to 0.8 depending on the window between 2000 and 2021, pitting a growth proxy (copper) against a safe-haven proxy (gold).
- In 2024-2026 the ratio collapsed — driven by gold, not copper — while yields stayed above 4%; the correlation fell to 0.04 on monthly levels since 2024.
- All three drivers of the signal gave way: inelastic mine supply and electrification on the copper side, de-dollarization on the gold side, inflation and term premium on the yield side.
- The indicator retains value as a description of regimes but has lost, at least for now, its function as a predictor of long rates.
Frequently asked questions
Does the copper-gold ratio still predict bond yields? Over 2024-2026, no: the rolling correlation between the ratio and the 10-year US yield fell near zero, and the investor who popularized the indicator stopped using it for that purpose. The link could reset during a strictly cyclical shock, with no guarantee.
Why is the ratio falling while copper sets records? Because the ratio is a quotient. Over the same period gold rose faster than copper, which mechanically lowers the ratio despite the surge in the industrial metal.
Is copper still a good growth indicator? Partly. A growing share of its demand comes from electrification, and part of its rise stems from constrained mine supply; these structural forces dilute its cyclical content without erasing it.
What does a copper-gold ratio near historic lows mean? Descriptively, it reflects a regime where monetary distrust and physical scarcity outweigh growth momentum. It is not, in itself, a directional signal on rates or assets.
Last updated — 23 September 2026
Disclaimer – Financial and Legal Information: The analyses, commentary, and content published on eco3min.fr are provided for informational and educational purposes only. They do not constitute investment advice or a solicitation to buy or sell financial instruments. Past performance is not indicative of future results. All investment decisions involve risk and are the sole responsibility of the reader. Data, charts and calculated series are provided as is and may contain errors or lag behind their source: check any figure against the primary source cited before relying on it. Content describing laws, regulations or contracts reflects the law as of its publication date and does not constitute legal or tax advice; applying it to a specific situation requires a qualified legal or tax professional.
Read next
Full pillar →Pure-play refiners versus integrated majors: downstream margin exposure
A pure-play refiner owns only the downstream, so its earnings track the refining margin. An integrated major also…
Jet fuel, the forgotten margin: the jet crack and the aviation link
The 3-2-1 crack spread reduces the refining margin to two products, gasoline and diesel. Jet fuel sits outside…
Reading the refinery utilisation rate: the threshold, the season, the turnarounds
A refinery runs full near ninety percent, not a hundred: the last slice of nameplate capacity is a…