Economic Slowdown: Four Signals That Separate Normalization from Rupture
Not every slowdown signals a crisis. Four observable signals — sectoral diffusion, credit flow direction, corporate margin trajectory and investment dynamics — separate a cyclical normalization from a genuine regime break, and their combination matters more than any single intensity.

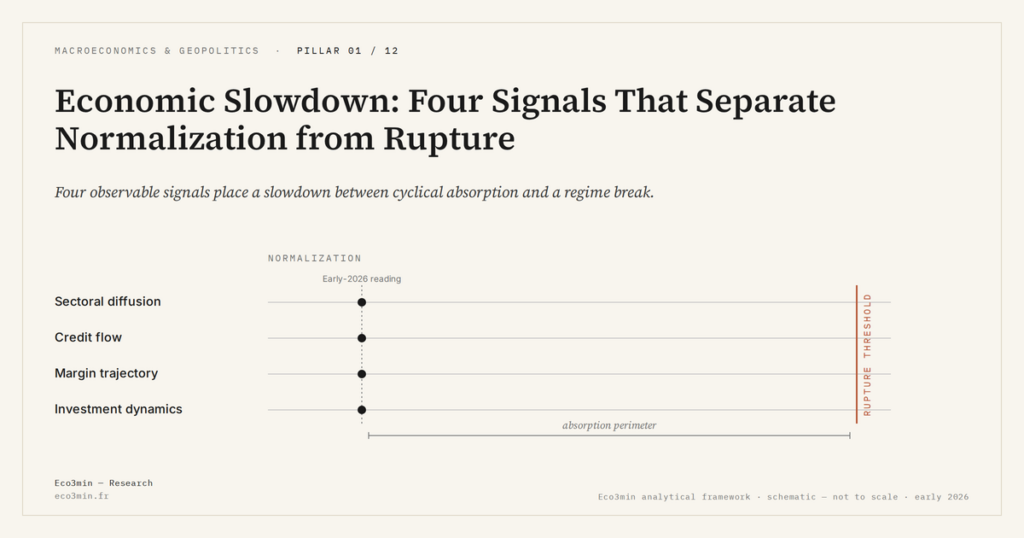
How to distinguish in real time a normal slowdown from an economic breaking point through four observable signals.
TL;DR
Four observable signals separate an absorbable slowdown from a regime break: sectoral breadth, credit direction, margin pace and investment dynamics, none of which reads conclusively on its own.
- End-2025 euro-area contraction stayed confined to manufacturing and real estate while services held up, a sectoral slowdown without generalized contagion.
- The ECB reported euro-area household credit still rising 0.8% year-on-year in December 2025, against −0.4% for non-financial corporate credit: localized refinancing stress, not a systemic freeze.
- Eurostat put the euro-area non-financial corporate margin rate at 42.1% in Q1 2025 and 40.8% in Q3, a 1.3-point erosion within the cyclical-normalization range since 1999.
- Capital goods orders falling more than 10% year-on-year have historically preceded G7 recessions; the euro-area reading was −3.2% at end-2025 (Eurostat), a sign of weakness rather than inflection.
A slowdown is not a recession. Headline GDP prints that surprise to the downside generate the same anxiety as genuine turning points, yet they rarely produce the same outcome. The relevant question is not whether activity is decelerating but how. Four signals — sectoral breadth, credit flow direction, margin trajectory and investment dynamics — separate cyclical normalization from a regime break. None reads conclusively on its own. Read together, they delimit the perimeter within which a slowdown stays absorbable, and the threshold beyond which it tips. Our framework on the real economic cycle beyond cyclical readings argues that the cycle’s nature is read on transmission channels, not on the level of activity.
The diagnostic gap matters in early 2026. The euro area oscillates between stagnation and modest recovery; the US economy has been decelerating for several quarters without a clean recession signature. In this ambiguous regime, the consensus reading swings month to month with each survey print — making an operational framework based on observable signals more useful than aggregate calls.
Signal 1 — Sectoral Diffusion
A slowdown localized in one or two sectors falls within normal adjustment. Inventory cycles in manufacturing, rate-driven slowdowns in real estate, regulatory shocks in autos: these decelerations are absorbed by the rest of the economy. The diagnosis shifts when industry, services, construction and consumption decelerate simultaneously. Cross-sector contagion signals that the shock is no longer relative-price or sector-specific; it has reached the demand function itself.
At end-2025, euro-area contraction stayed confined to manufacturing and real estate while services held up — a profile of sectoral slowdown without generalized contagion. The reading is partial: services can lag manufacturing by two to three quarters, so the diffusion test must be re-run with each new release.
Signal 2 — Credit Flow Direction
As long as credit to firms and households keeps expanding, the economy retains the financing capacity to absorb a downturn. The ECB noted in December 2025 that euro-area household credit was still rising 0.8% year-on-year, against −0.4% for non-financial corporate credit. The divergence describes localized financial stress — concentrated in the corporate segment exposed to refinancing — not a systemic credit freeze. The real economic cycle tips when credit contracts across both legs simultaneously, not when one segment slows in isolation.
Signal 3 — Corporate Margin Trajectory
In a normalization phase, margins compress gradually under the combined pressure of wages, inputs and financing costs, without collapsing. The compression reveals a redistribution of value-added between capital and labor, not a destruction of the firm’s price-setting power. A sharp drop, by contrast, indicates that firms can no longer pass costs through to prices or absorb them through volumes — the signal that demand has weakened beyond cyclical tolerance.
Eurostat estimated that the non-financial corporate margin rate in the euro area declined from 42.1% to 40.8% between Q1 and Q3 2025 — a progressive erosion, not a rupture. The pace, not the level, carries the signal: a 1.3-point move over three quarters falls within the historical range of cyclical normalization episodes since 1999.
Signal 4 — Investment Dynamics
Leading cycle indicators, in particular industrial orders, anticipate investment trajectories several quarters ahead. A drop in capital goods orders exceeding 10% year-on-year has historically preceded recessions across G7 economies. At end-2025, the euro-area decline reached −3.2% (Eurostat) — a signal of weakness, not yet of inflection. Each phase of the economic cycle is characterized by its own configuration of these four markers; their combination is what diagnoses.
Concluding that a slowdown is serious because one indicator deteriorates sharply. A double-digit drop in industrial production can reflect a one-off inventory adjustment with no implication for the rest of the economy. It is the convergence of the four signals — diffusion, credit, margins, investment — that determines severity, not the intensity of any single one.
The framework has its own limits. Systemic financial crises — the 2008 type — can propagate so quickly that real-economy markers have no time to signal the tipping point before it occurs. The fundamentals of economic cycle analysis therefore have to be complemented by monitoring financial conditions — credit spreads, interbank liquidity, implied volatility — which capture systemic tension upstream of real data. Early 2026 sits at the intersection of these two grids: the real-economy diagnosis points to normalization; the financial-conditions diagnosis points to a regime where any new shock may prove harder to absorb than during the post-pandemic period.
Last updated — 23 June 2026
Disclaimer – Financial Information: The analyses, commentary, and content published on eco3min.fr are provided for informational and educational purposes only. They do not constitute investment advice or a solicitation to buy or sell financial instruments. Past performance is not indicative of future results. All investment decisions involve risk and are the sole responsibility of the reader.
Read next
Full pillar →Monetary Tightening: How Central Banks Are Reshaping Financial Markets
After more than a decade of ultra-accommodative policy, monetary tightening has reintroduced the real cost of capital as…
Hidden Unemployment: Reading the Real Labor Market in 2026
Headline unemployment is stabilizing while broad underemployment still runs above pre-2020 levels. Reading the gap between official rates…
2026 Economic Outlook: Key Trade-Offs After the End of Cheap Money
2026 ushers in a more constrained macro regime where real rates stay positive, fiscal space narrows and geoeconomic…