
How to Invest in Gold: Bullion, ETFs, Miners and the Tax Bill at Exit
Gold has one price and four doors. Which door you use decides your entry cost, your holding cost and, at exit, your tax bill.
- Physical bullion carries a premium over spot (from roughly 1–5% on large bars and widely traded coins to far more on small formats), plus storage and insurance, but no annual fee.
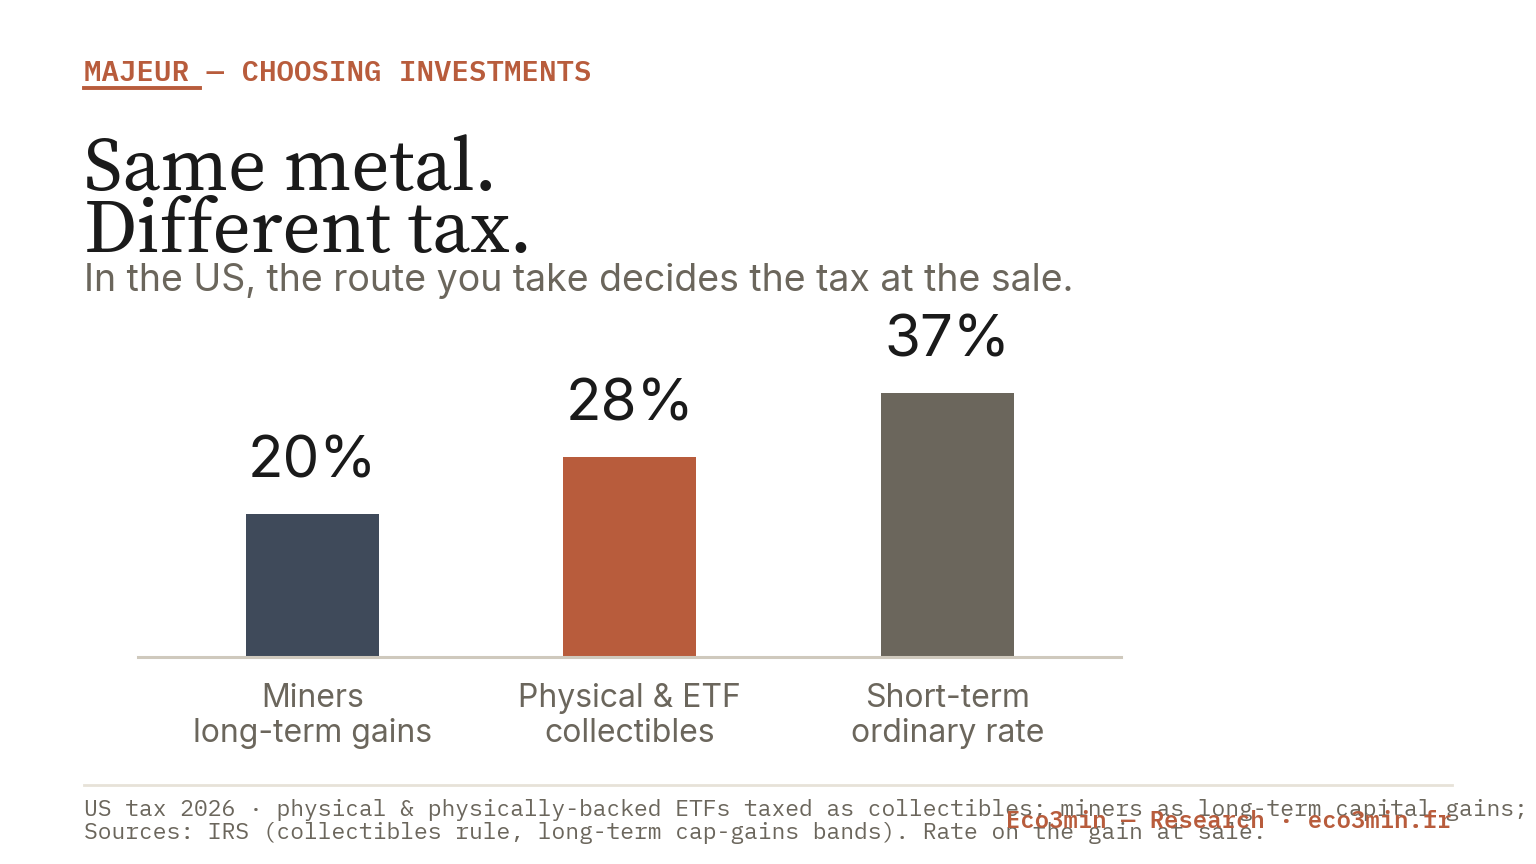
- In the United States, physical gold and physically backed ETFs are taxed as collectibles at a maximum long-term rate of 28%, against the 0/15/20% schedule that applies to mining funds and futures (IRS Topic 409).
- Central banks bought 863 tonnes of gold in 2025, below the exceptional years of 2022–2024 but well above the 2010–2021 average (World Gold Council, full-year 2025).
There are four practical routes into gold: bars and coins, physically backed exchange-traded products, gold-mining shares, and pooled or fractional accounts. The metal is identical across all four. The cost of the journey is not.
Most guides answer a different question, the one about whether gold belongs in a portfolio at all. This page assumes the decision to hold some has been made, and maps the access channels, their fees, and above all how a sale is taxed for a US investor.
What “investing in gold” actually covers
The spot price quoted on a screen is the same number for a central bank in Warsaw and a first-time buyer in Ohio. What differs is everything wrapped around that number: the premium a dealer charges to hand over a physical coin, the expense ratio a fund skims each year, the spread between what you pay and what you can immediately sell for, and the rate the tax code applies when you realise a gain. Gold’s price is global; your costs and taxes are local. That single sentence explains why two people can buy the same ounce on the same morning and end up with materially different after-tax results a decade later.
The four routes fall into two families. Physical gold, coins and bars, gives you the metal itself, with a high cost at the door and none afterward. Paper gold, the physically backed exchange-traded funds, reverses that profile: a low annual fee, no storage to arrange, but a tax treatment that is often less favourable than buyers expect. Miners are a third thing entirely, an equity exposure to companies that dig gold out of the ground, not a claim on the metal. Pooled and fractional platforms sit alongside these, letting you buy a slice of an allocated bar at close to spot in exchange for outsourced custody. The rest of this page walks each door, then puts them in a single grid, because the comparison, not any one route, is where the decision lives. For how these access choices fit inside a wider allocation, the pillar on gold within asset allocation is the reference; this page stays on access and cost.
Physical bullion: coins and bars
Buying a physical coin or bar means paying a premium over the metal content. That premium covers minting, packaging, distribution and dealer margin, and it varies sharply by format. Widely traded, high-liquidity products carry the smallest markups: Krugerrands typically trade at premiums of roughly 1–4% over spot outside shortage periods, and large bars (one kilogram, 500 grams) sit near the bottom of the range because the fixed fabrication cost spreads across more metal. Small formats do the opposite. A one-gram bar concentrates the same fixed costs onto a tiny quantity of gold, so its premium can run into double digits, quietly eroding return before the price has moved at all.
The premium is a cost that is easy to underweight because it is paid once and never itemised again. A 5% premium at purchase means the metal has to rise 5% just to return to breakeven; against a long-run expectation in the mid single digits, that is close to a full year of performance surrendered on day one. Premiums are also not fixed. They widen when physical demand overwhelms supply: during the 2008 crisis, premiums on the French 20-franc Napoléon reached close to 30% as coins became scarce. Comparing dealers before purchasing, and favouring larger, more liquid formats, is how that friction is contained.
Physical also carries running obligations that paper does not. Storage at home raises an insurance and security question; storage in a vault adds a recurring fee. And documentation matters more than most first-time buyers realise: a bar removed from its sealed assay card can lose the traceability that proves its purchase date and price, which becomes decisive at sale, as the tax section below makes clear. The trade-off is clean: physical gold is the route with the highest entry cost and the lowest ongoing cost, and the one where you, not a custodian, hold the asset.
Between full physical possession and a screen-traded fund sits a fourth route: pooled and fractional accounts, where a platform lets you buy an allocated share of a large bar held in a professional vault. The buy-in sits close to spot because you are sharing the fabrication cost of a single big bar rather than paying the premium on a small one, and there is no logistics to manage. The cost migrates elsewhere: a recurring custody fee, and a set of platform terms that define exactly what your claim is, whether it is allocated metal in your name or a contractual promise, and how you can take delivery or exit. That fine print is the whole of the risk on this route, which is why the grid below flags counterparty and custody terms as its trap. The practical lesson across all four doors is that the transaction venue, a bullion dealer, a brokerage account, or a platform, sets the friction before the gold price does anything at all.
Paper gold: physically backed ETFs
Physically backed gold ETFs solve the friction of the physical route. There is no premium beyond a modest bid-ask spread, no vault to rent, no coin to authenticate, and the annual expense ratio on the large products is a fraction of a percent. You buy and sell in a brokerage account in seconds. For an investor whose objective is exposure to the gold price rather than possession of metal, that convenience is real.
Not every product sold as physical gold holds the metal outright. The most rigorous hold allocated bullion, identified and segregated, so that net asset value reflects a quantity of metal. Other structures rely on a counterparty or a synthetic mechanism: they replicate the price but add a counterparty risk that allocated bullion does not carry. On a performance chart the two look alike in calm periods. The difference surfaces under stress on the issuer. “Backed by gold” does not always mean “holding gold.”
The catch is at exit, and it surprises people. A physically backed gold ETF structured as a grantor trust holds actual metal, and the tax code treats the holder as if they owned that metal directly. The convenience of the wrapper does not change the character of the asset. The choice between physical and this kind of paper exposure is therefore less about the metal and more about the fee-versus-tax trade-off, and about whether holding the asset yourself matters to you.
Miners: operating leverage, not a proxy
Gold-mining shares are frequently sold as a leveraged way to own gold. They are not a proxy for the metal. A miner is a business with fixed extraction costs, so when the gold price rises above those costs, profit rises faster than the price, and when it falls toward them, profit collapses faster. That operating leverage cuts both ways, and it comes bundled with everything that has nothing to do with gold: management quality, jurisdictional and political risk, energy costs, debt, and the equity market’s mood on any given day. A miner can fall on a day gold rises, and rise on a day gold falls.
The tax code draws the same distinction. Mining shares and the funds that hold them are ordinary equities for tax purposes, taxed under the standard long-term schedule rather than the collectibles rate that catches physical gold. So miners are a different exposure with a different fee profile and a different tax profile, useful to understand precisely because they are so often confused with the thing itself. A portfolio that holds a mining fund and calls it a gold position owns something that can lag the metal for years when extraction costs squeeze margins, or race ahead of it in a strong price cycle; the two are correlated, not equivalent.
The gap between the two exposures shows most at regime turns. In a stress phase where the real rate falls, gold tends to rise while equities fall, and miners, dragged by their equity beta, can stagnate or decline despite the metal’s advance. The forced selling of March 2020 is the extreme case: gold dipped briefly, miners fell further, then both rebounded. In a risk-on recovery where the metal appreciates without market stress, the margin leverage can carry miners well past it. For diversification, the consequence is direct. Physically backed metal, with no equity beta, keeps its cushioning potential in market downturns, while a miner’s equity component erodes that property precisely when it would be most useful. The vehicle changes the defensive nature of the gold position, not only its size.
“The miners” are not a single block either. A large established producer, a project developer with no output yet, and a royalty company that finances mines in exchange for a share of future production present widely different leverage, equity beta and cost exposure. Unlike the metal, a miner can also pay a dividend, and some tie the payout to the gold price. That income remains subject to corporate risk and can be cut or suspended depending on results.
The US tax angle: collectibles treatment
This is the part of “how to invest in gold” that the listicles skip, and it is where the routes separate most decisively. US tax law does not treat gold like a stock.
Physical gold and some ETFs are taxed as collectibles
Under the Internal Revenue Code, gold, silver and other precious metals are collectibles. When held longer than a year, gains on a collectible are taxed at a maximum federal rate of 28%, not the 0%, 15% or 20% long-term capital gains rate that applies to stocks and most ETFs (IRS Topic 409). Held a year or less, the gain is short-term and taxed as ordinary income at rates up to 37%. The 28% ceiling is what the IRS itself describes: net gains from selling collectibles such as coins are taxed at a maximum 28% rate.
The decisive, widely missed point is that buying gold through an ETF does not automatically escape this. A physically backed fund structured as a grantor trust, such as GLD, is treated as if the holder owned the underlying metal, so the same collectibles ceiling applies. By contrast, gold-mining funds and gold futures are ordinary investments taxed under the standard 0/15/20% long-term schedule; futures carry their own blended treatment rather than the collectibles rate. Two investors can hold “gold” and face a materially different rate depending only on which door they used. High earners may also owe the 3.8% net investment income tax on top, above the relevant income thresholds. None of this is a reason to prefer one route; it is a fact to price in when comparing them.
The gap looks small on paper and compounds in practice. On a realised long-term gain, the difference between the 28% collectibles ceiling and the 20% standard rate is eight points of the gain, and on a 15% bracket it is thirteen. Over a long hold, that wedge is deducted only once, at sale, but it is deducted from the whole accumulated appreciation, so the larger the gain the larger the absolute difference in what reaches your account. A 20% price rise taxed at 28% is not the same after-tax outcome as a 20% rise taxed at 15%, and the divergence is entirely a function of the route, not the metal. This is exactly the arithmetic the tool below makes visible, and the reason the tax question, rather than the headline price, is where a route decision earns or loses its keep. Change that rate and holders reshuffle rather than disappear, an asymmetry that runs through what capital gains tax changes do to markets.
The belief that a gold ETF is automatically more tax-efficient than a coin is often wrong. A physically backed grantor-trust ETF is taxed as a collectible at up to 28%, the same ceiling as the metal it holds. Only mining funds and futures fall under the ordinary long-term schedule.
See it on your own numbers
Because the gap between the collectibles rate and the standard long-term rate is a fixed feature of the code, its effect on a sale is arithmetic, not opinion. The tool below takes a sale amount, a realised gain and a holding period, and shows the net proceeds under the collectibles rate against the standard long-term rate, with the point where the holding period crosses the one-year line that separates short-term from long-term treatment. It describes the mechanics of the tax rules; it is not advice, and it names no product.
Net at collectibles rate (28%)
-Net at standard long-term rate (20%)
-Gap
-The four routes, side by side
The grid below is the working summary. Read it by column, not by row: the question is never “which is best” but “which cost do I mind least”.
| Route | Entry cost | Holding cost | Exit and tax | The trap |
|---|---|---|---|---|
| Physical bullion (coins, bars) | Premium over spot, low on large/liquid formats, high on small ones | Storage and insurance; no annual fee | Dealer spread; collectibles rate up to 28% long-term | Small-format premiums; losing the assay card and its proof of basis |
| Physically backed ETF (grantor trust) | Brokerage commission; bid-ask spread | Expense ratio, a fraction of a percent | Instant sale; still the 28% collectibles rate | Assuming the wrapper changes the tax character |
| Mining shares and funds | Brokerage commission | Fund expense ratio if pooled | Standard 0/15/20% long-term rate | Treating a leveraged equity as a proxy for the metal |
| Pooled / fractional accounts | Near-spot buy-in, reduced premium | Platform custody fee | Platform-dependent; verify on-chain or physical claim | Outsourced custody and counterparty terms in the fine print |
Reading the grid this way reframes the whole question. The physical buyer trades a high premium and storage for direct ownership and no annual drag; the ETF holder trades a small annual fee for instant liquidity and accepts the same collectibles tax; the miner buyer accepts equity risk and a favourable tax rate in exchange for giving up a pure metal exposure; the fractional buyer trades custody terms for a near-spot entry. There is no dominant cell, which is the point. The cost you mind least, upfront friction, ongoing fee, tax at exit, or counterparty exposure, is personal, and it depends on holding period and account type as much as on the metal. A short hold makes the entry premium and the short-term tax rate loom large; a multi-decade hold makes the annual fee and the exit rate the dominant terms. That is why a route that suits one horizon can be the costliest for another.
Gold read through the macro regime
Access explains the cost of holding gold; it does not explain when gold tends to work. That belongs to the macro regime, and specifically to real yields, the interest rate left after inflation. The framework for placing any asset against the prevailing environment, rather than in isolation, is the sub-pillar on choosing gold exposure by regime; the access choices on this page sit underneath it. Gold pays no coupon, so its main competitor is the real return on cash and bonds. When real yields fall or turn negative, the opportunity cost of holding a zero-yield metal drops, and gold tends to find support; when real yields rise, that cost climbs. The empirical relationship, its strength and its exceptions across 1997 to 2026, is set out in the dedicated read on gold against real yields. To see where the current setting sits, the dashboard on the macro regime framing gold now is the live reference, and the deeper study of gold in an inflationary regime maps the historical episodes.
The distinction between the metal’s real and nominal returns matters here more than for almost any other asset, because gold is so often bought as an inflation hedge: a nominal gain in a high-inflation year can hide a flat or negative real result. The primer on real versus nominal gold returns unpacks that gap. And because no single asset behaves the same across every environment, the tool that shows gold compared across regimes is the way to place it against equities, bonds and cash rather than in isolation, the same lens applied to gold among the main investments.
Gold’s price is global, but net return is decided locally, by the premium at entry and the tax code at exit.
The numbers
Two data points frame gold’s current standing. First, official demand: central banks bought 863 tonnes in 2025, a decline from 2024 and the lowest annual total since 2021, yet still comfortably above the average of the 2010–2021 period (World Gold Council, full-year 2025). The buying was broad, with 22 institutions adding at least a tonne, led by the National Bank of Poland at 102 tonnes. Second, and more striking, gold overtook US Treasuries late in 2025 to become the largest reserve asset by value for the first time since 1996 (Morgan Stanley Research), a shift driven as much by price as by tonnage: total gold demand reached a record for the first time, and the metal set 53 all-time highs during the year.
What this says for an access decision is narrow but useful: gold’s demand base has broadened structurally toward official buyers and away from jewellery, which reduces the discretionary, price-sensitive share of demand. It says nothing about where the price goes next, and this page makes no such claim. For the shape of that demand, jewellery against bars against official buying, the breakdown of the composition of gold demand is the detailed source, and the long series behind these figures is the downloadable gold price history dataset. As a macro signal rather than a holding, the ratio of copper to gold, the copper-to-gold growth gauge, reads growth against safe-haven demand, and for the neighbouring monetary metal, the differences in access and tax around physical silver versus gold follow the same logic set out here.
Frequently asked questions
How do physical gold and gold ETFs differ on costs and taxes?
Physical gold carries a one-time premium at purchase plus storage and insurance, but no annual fee; a physically backed ETF carries a small annual expense ratio and a bid-ask spread instead of a premium. On tax, the surprise is that they converge: both the metal and a grantor-trust ETF that holds it are taxed as collectibles at a maximum long-term rate of 28% (IRS Topic 409). The cost profiles differ; the collectibles tax ceiling does not.
How is a gold sale taxed for US investors?
A gain on physical gold or a physically backed ETF held more than a year is taxed at up to 28% as a collectible; held a year or less, it is short-term and taxed as ordinary income (up to 37%). Mining shares and funds, and gold futures, fall outside the collectibles rule and use the standard 0/15/20% long-term schedule. A 3.8% net investment income tax can apply on top above the relevant income thresholds.
The premium is the gap between a coin’s price and the value of the gold it contains. It covers minting, packaging, distribution and dealer margin, and it is larger on small formats, where fixed costs spread over little metal, and on coins in short supply. Large bars and widely traded coins carry the smallest premiums; the same premium can also widen sharply during physical shortages.
How has gold behaved across real-rate regimes?
Because gold pays no income, it has historically tended to find support when real yields fall and to face a headwind when they rise, since the real return on cash and bonds is its main competitor. The relationship is a tendency, not a rule, with notable exceptions, and it is documented empirically over 1997 to 2026 in the dedicated read on gold against real yields. The current setting is shown on the live macro-regime dashboard.
How do gold miners differ from direct gold exposure?
A miner is an equity, not a claim on metal. Its operating leverage means profit can rise or fall faster than the gold price, and it carries company-specific and market risks that gold itself does not, so it can move opposite to the metal on a given day. It is also taxed as an ordinary equity under the standard long-term schedule, not at the 28% collectibles rate.
This content is published for information only. It is not investment advice and does not constitute a recommendation to buy, hold or sell any asset. Tax figures reflect rules in force in 2026 and can change; individual situations vary. Sources: IRS Topic 409; World Gold Council, Gold Demand Trends full-year 2025; dealer premium data, 2026.
Last updated — 29 October 2026
Disclaimer – Financial and Legal Information: The analyses, commentary, and content published on eco3min.fr are provided for informational and educational purposes only. They do not constitute investment advice or a solicitation to buy or sell financial instruments. Past performance is not indicative of future results. All investment decisions involve risk and are the sole responsibility of the reader.
Data, charts and calculated series are provided as is and may contain errors or lag behind their source: check any figure against the primary source cited before relying on it.
Content describing laws, regulations or contracts reflects the law as of its publication date and does not constitute legal or tax advice; applying it to a specific situation requires a qualified legal or tax professional.
Regulated and tax values: the rates, indices, caps and brackets with legal effect cited on this page are set by official decision, change over time and apply according to individual circumstances. Only the official publication in force on the relevant date is authoritative (for example the Journal officiel, INSEE, Banque de France, the IRS or the Social Security Administration). To revise a rent, sign or challenge a contract, or file a return, check the value at the source or with a professional.