
Middle Class Income Range in the US, by Household Size
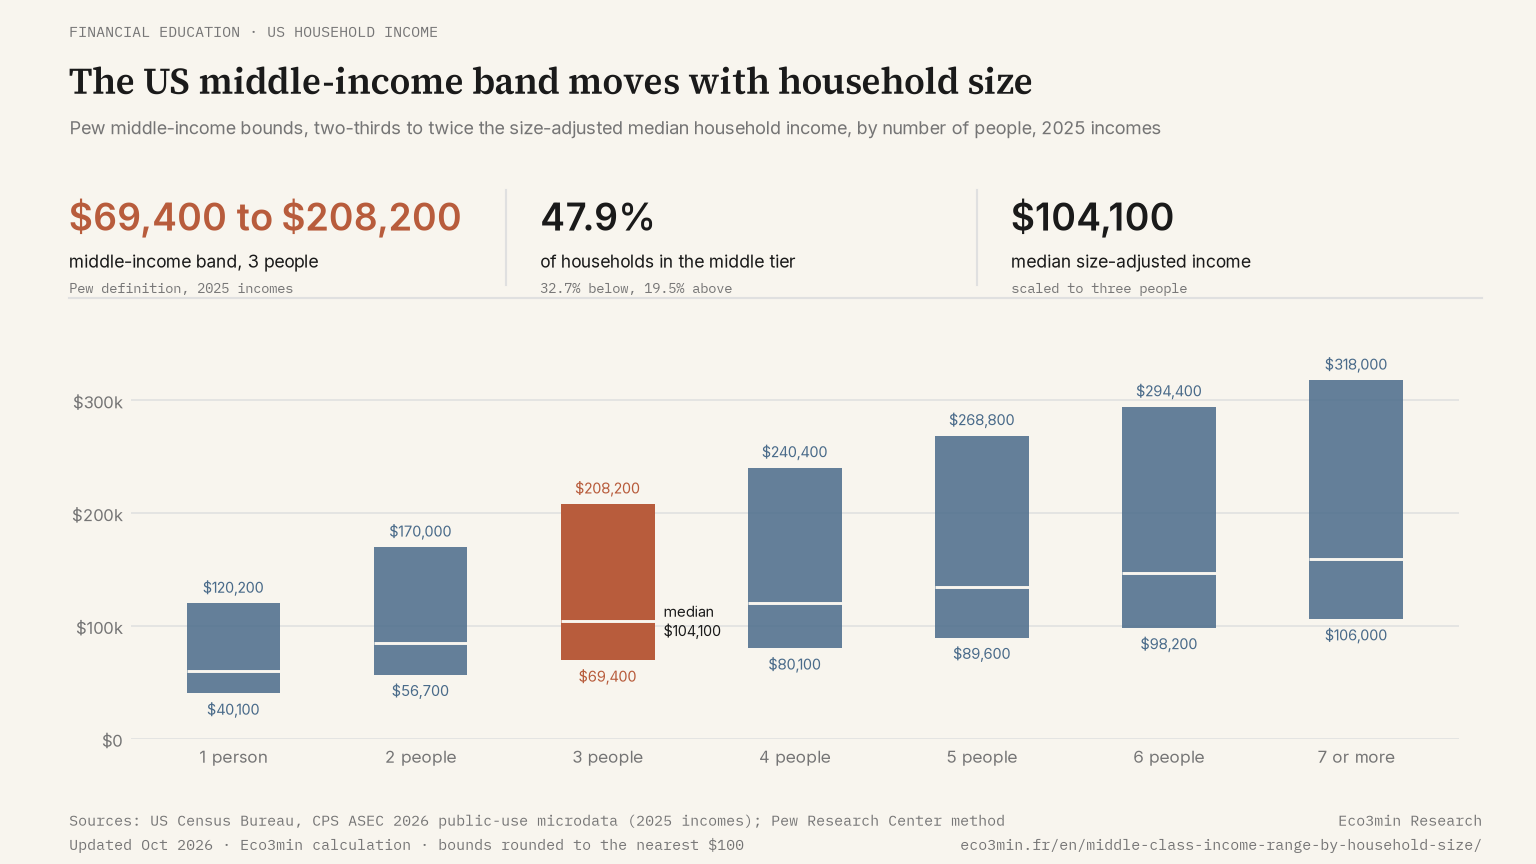
The US middle class ran from $69,400 to $208,200 in 2025 for a household of three, on the Pew definition. Thresholds for each household size, one to seven.
The Pew Research Center defines the American middle class as a ratio to the national median, adjusted for the number of people a household supports. The same income can therefore place a single person in the middle tier and a family of five below it.
Here the definition is applied to the Census Bureau’s 2025 income data, with the bounds for households of one to seven people and a calculator for any household.
On the Pew definition, a three-person US household was middle income in 2025 with $69,400 to $208,200 a year, and the bounds shift with every member added.
- Middle income means two-thirds to twice the median size-adjusted household income, $104,100 for three people in 2025 (Eco3min calculation on Census CPS ASEC 2026).
- A single person is middle income from $40,100 to $120,200; a household of four from $80,100 to $240,400.
- 47.9% of US households fell in the middle tier, 32.7% below it and 19.5% above it (rounded).
A single salary range is often quoted for the American middle class, as if one band could fit a student renting alone and a couple raising three children. The statistics do not work that way. A widely used definition, published by the Pew Research Center, sets no dollar band at all. It sets a ratio: a household is middle income when its income, adjusted for household size, lies between two-thirds and twice the national median.
How the ratio becomes a threshold
The size adjustment does the work. Each household’s income is divided by the square root of the number of people in it, then multiplied by the square root of three, the reference size. In practice a couple’s income is scaled up by about 22% and a family of four’s scaled down by about 13%. The square root reflects shared costs: two people under one roof need more than one, but not twice as much, since rent, heating and a car are partly shared.
Applied to the 2026 Annual Social and Economic Supplement of the Current Population Survey (CPS ASEC), which records 2025 incomes, the median of that size-adjusted income comes to $104,100 for a household of three. Two-thirds of it is $69,400; twice it is $208,200. That median sits above the Census Bureau’s headline median of $87,460 only because it is expressed for three people, while 64.3% of US households have one or two. Mean household income runs higher still, at $126,700, for reasons set out in average versus median household income.
One number, $104,100, sets every bound in the table below.
The bounds for one to seven people
| Household size | Lower income: below | Middle income | Upper income: above |
|---|---|---|---|
| 1 person | $40,100 | $40,100 to $120,200 | $120,200 |
| 2 people | $56,700 | $56,700 to $170,000 | $170,000 |
| 3 people | $69,400 | $69,400 to $208,200 | $208,200 |
| 4 people | $80,100 | $80,100 to $240,400 | $240,400 |
| 5 people | $89,600 | $89,600 to $268,800 | $268,800 |
| 6 people | $98,200 | $98,200 to $294,400 | $294,400 |
| 7 or more people | $106,000 | $106,000 to $318,000 | $318,000 |
The width of the band never changes in relative terms: the upper bound is always three times the lower one. The level is what moves. Going from one person to four doubles both bounds, because the square root of four is two. A household with $85,000 a year is middle income if one person lives on it and lower income if five do.
On these bounds, 47.9% of US households were middle income in 2025, 32.7% lower income and 19.5% upper income, the three shares being rounded. The split leans downward by construction. For a household of three, the middle band reaches $104,100 above the median but only $34,700 below it, so 30.6% of households sit between the median and the upper bound, against 17.3% between the lower bound and the median. How each point of the distribution has moved since 1967 is traced in household income growth by percentile.
Who sits in each tier
One-person households are the likeliest to be lower income: 45.5% of them fall below the bound. The share drops to 25.5% for households of four, then climbs back to 41.8% for seven or more.
| Age of householder | Lower income | Middle income | Upper income |
|---|---|---|---|
| Under 25 | 46.6% | 47.8% | 5.6% |
| 25 to 34 | 27.6% | 54.4% | 18.0% |
| 35 to 44 | 26.9% | 50.5% | 22.6% |
| 45 to 54 | 24.2% | 49.8% | 26.0% |
| 55 to 64 | 28.5% | 47.2% | 24.4% |
| 65 and over | 43.3% | 42.5% | 14.2% |
Age draws a life-cycle arc. Under 25, only 5.6% of households reach the upper tier. The share peaks at 26.0% between 45 and 54, slips to 24.4% at 55 to 64 and drops to 14.2% from 65, the only age group where the lower tier (43.3%) outweighs the middle (42.5%).
Place a household on the scale
Enter a pre-tax annual household income and the number of people it supports. The calculator rescales the bounds to that size, shows the tier and the distance to the nearest bound, and gives the share of US households in each tier.
Reading the bounds as salaries. They apply to total household income before taxes, which the Census Bureau defines as every earner’s pay plus Social Security, pensions, interest and other regular cash income, excluding capital gains and noncash benefits. A $50,000 salary leaves a household of three below the $69,400 bound on its own; a second income of $20,000 puts it in the middle tier.
How the bounds were computed
The source is the Census Bureau’s public-use microdata for the CPS ASEC 2026: 53,344 interviewed households, weighted to represent 137.1 million. Income is household money income before taxes. The median is taken across households with the household supplement weight, the scale is the square root of household size, and the reference size is three. The same microdata reproduce the Census Bureau’s published median and income percentiles within 0.2%, which checks the file and the weights.
The method was tested against Pew’s own figure before being applied to 2025. Run on the 2023 survey, which records 2022 incomes, and converted to 2023 dollars with the consumer price index, the same code returns $61,100 to $183,200 for a household of three. Pew’s report of May 2024 gives about $61,000 to $183,000 from the same survey.
Two differences with Pew’s publications remain, both deliberate. Pew adjusts for local cost of living when it works with the American Community Survey; the CPS version used here does not, so a household in San Francisco and one in rural Mississippi face the same bounds. And the shares above are shares of households, while Pew usually reports shares of adults, so the two are not comparable.
What the three tiers leave out
The tiers measure income, not living standards. A retired couple with a paid-off house and large savings can sit in the lower tier on income alone, while a young household with a high salary and heavy student debt sits in the upper one. How income, wealth and debt pull against each other is the thread of everyday financial decisions across regimes. Income tax and in-kind transfers are outside the measure too: money income is counted before tax and leaves out food assistance, Medicaid and employer health insurance.
The bounds are recomputed every year from the median, so they rise when it does. In 2025 the Census headline median rose 2.6% in real terms. A household whose real income stood still lost ground relative to it, without any change in its own situation. Quintile limits move for the same reason, since they too are cut from the distribution each year: see household income quintiles and their limits. To rank an income within the whole distribution for any year since 1967, see where a household income stood in any year.
Read with the household-size table, the label places a household against the national middle once its members are counted. It says nothing about wealth or debt.
Last updated — 1 October 2026
Disclaimer – Financial and Legal Information: The analyses, commentary, and content published on eco3min.fr are provided for informational and educational purposes only. They do not constitute investment advice or a solicitation to buy or sell financial instruments. Past performance is not indicative of future results. All investment decisions involve risk and are the sole responsibility of the reader. Data, charts and calculated series are provided as is and may contain errors or lag behind their source: check any figure against the primary source cited before relying on it. Content describing laws, regulations or contracts reflects the law as of its publication date and does not constitute legal or tax advice; applying it to a specific situation requires a qualified legal or tax professional.
Regulated and tax values: the rates, indices, caps and brackets with legal effect cited on this page are set by official decision, change over time and apply according to individual circumstances. Only the official publication in force on the relevant date is authoritative (for example the Journal officiel, INSEE, Banque de France, the IRS or the Social Security Administration). To revise a rent, sign or challenge a contract, or file a return, check the value at the source or with a professional.