
What are household income quintiles, and where do the US limits fall?
US household income quintiles in 2025: limits at $35,800, $68,600, $110,300 and $182,400. The top fifth took 52.4% of all income, against 43.6% in 1967.
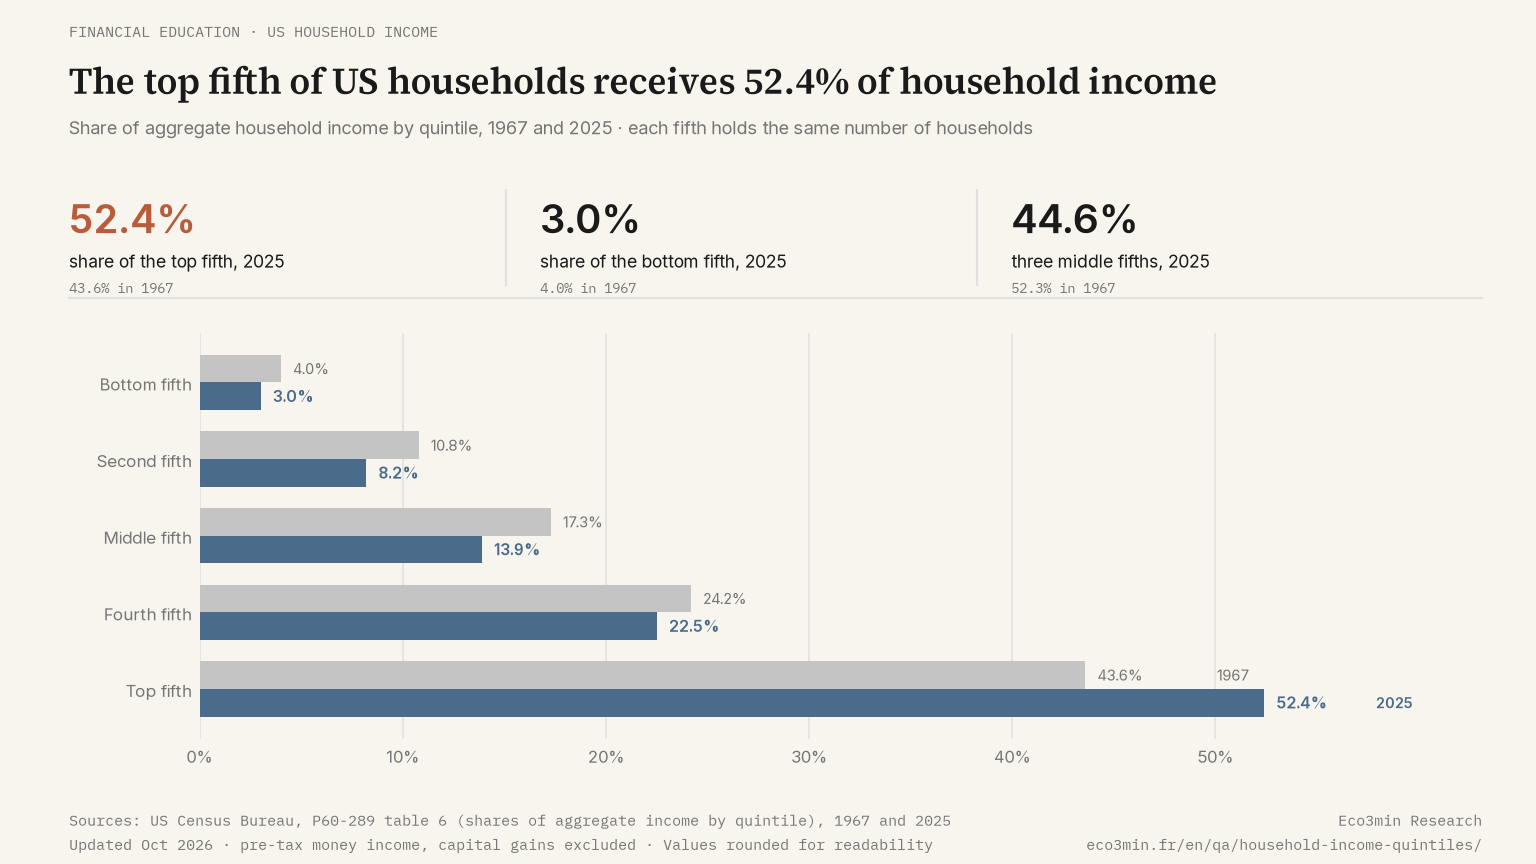
Household income quintiles split US households into five groups of equal size; in 2025 the Census Bureau put the limits at $35,800, $68,600, $110,300 and $182,400. The groups hold the same number of households but not the same number of people or earners, and the top fifth received 52.4% of all household income against 3.0% for the bottom fifth. The limits are recalculated every year: $68,600 in 2025 dollars, now the line between the second and third fifths, would have placed a household in the fourth fifth in 1967.
In this article
The short answer
Rank every US household by its income before taxes, then cut the line into five groups of equal size. Each group is a quintile, and the four cut points are its limits. For 2025, table 6 of the Census Bureau’s annual income report puts them at $35,800, $68,600, $110,300 and $182,400.
A household below $35,800 was in the lowest fifth; one above $182,400 in the highest. Equal in households, the fifths are far apart in income: the top one received 52.4% of all household income in 2025, the bottom one 3.0%.
The limits are recomputed from each year’s survey, so a household can move from one fifth to another without any change in its own income. In 2025 dollars, the top fifth started at $93,210 in 1967 and at $182,400 in 2025.
→ Why the average outruns most households: average income compared with the median
What the data shows
Census table 6 publishes, every year since 1967, the quintile limits and the average income in each fifth, in 2025 dollars, and each fifth’s share of total household income. The source is the Annual Social and Economic Supplement of the Current Population Survey (CPS ASEC).
- Average income by fifth in 2025: $19,100, $51,700, $88,250, $142,500 and $331,800. The top fifth’s share is about 17 times the bottom’s, against about 11 times in 1967.
- Shares of income in 2025, bottom to top: 3.0%, 8.2%, 13.9%, 22.5%, 52.4%. In 1967: 4.0%, 10.8%, 17.3%, 24.2%, 43.6%.
- The three middle fifths together held 52.3% of income in 1967 and 44.6% in 2025.
- Real growth of the limits since 1967: 51.6% for the bottom limit, 95.7% for the top one.
At least 1.2 of the top fifth’s 8.8-point gain comes from changes of method. For 2013 and 2017 Census published the year under both methods, and the new one raised the top share by 0.4 and 0.8 points. In 1993, the year of the switch to computer-assisted interviews with higher caps on reported amounts, the share jumped 2.0 points, from 46.9% to 48.9%; that year was not published both ways.
→ Finer than fifths: where a household income ranked, year by year
What sorts households, and what moves the limits
People and earners. In an Eco3min tabulation of the CPS ASEC 2026, which covers 2025 incomes, with households sorted by the published limits, the bottom fifth held 14.0% of people living in households and the top fifth 25.6%. Households in the top fifth averaged 1.98 earners, those in the bottom fifth 0.39, and 65.1% of bottom-fifth households had no earner at all. Per person, income in the top fifth was about 9.6 times that in the bottom, against 17.4 times per household.
Age. 48.0% of bottom-fifth households were headed by someone aged 65 or older, against 18.0% in the top fifth. Earnings made up 35.8% of bottom-fifth income, against 80.5% in the top fifth.
Moving limits. Because the cut points follow the distribution, a fixed income slides down the ranking as other incomes grow. The $68,600 that separates the second and third fifths in 2025 sat between $65,360 and $93,210 in 1967, in the fourth fifth. Six points of the distribution, followed year by year since 1967, are in six percentiles tracked since 1967.
By regime, measured per year, the top limit outran the bottom one by about half a point both from 1979 to 2000 (1.17% against 0.71% a year) and from 2007 to 2012, when both fell, by 1.10% and 1.59% a year. In both windows the top fifth’s share gained about a quarter of a point a year, whether the economy was expanding or contracting; the earlier window also contains the 1993 change of method. From 2019 to 2025 the top limit grew 0.50% a year and the bottom one 0.43%, a gap under a tenth of a point, and the top share rose 0.08 point a year. The annual gap between the two limits, more than the direction of the cycle, is what separates these periods.
Equal in households, the fifths run from a seventh of Americans to a quarter.
→ Framework: everyday trade-offs and economic regimes
What it means for different economic actors
Households. A household’s quintile is a position among others in one year. Retirement, a second earner or an earning child leaving home can move it across a limit, and so can other households’ incomes rising faster than its own.
Analysts and investors. Quintile shares mix income and demography. Given the age mix shown above, a change in the bottom fifth’s share can reflect retirements as well as pay, and consumer spending data split by quintile carries the same composition.
Public programmes. Transfers conditioned on earnings, such as the Earned Income Tax Credit, concern the 34.9% of bottom-fifth households with an earner, and the credit is not counted in Census money income. Old-age benefits, which are counted, concern a group where close to half of households are headed by someone 65 or older.
A common error is to read the bottom fifth as a fifth of Americans. It holds 14.0% of people in households, and many of its households are small, older or without earnings.
Practical observation
What the data suggests for understanding your situation:
- Question to ask yourself: would a household whose real income stayed flat for ten years still sit in the same fifth at the end of them?
- Data to monitor: the combined share of the three middle fifths in Census table 6. A falling figure means the two ends together gain; from 1967 to 2025 the whole gain went to the top fifth, since the bottom fifth’s share also fell, from 4.0% to 3.0%.
- Historical parallel: from 2007 to 2012 both limits fell in real terms, the bottom one by 7.7% and the top one by 5.4%, yet the top fifth’s share rose 1.3 points.
- What the literature documents: Chetty, Hendren, Kline and Saez (2014) measure how often children whose parents ranked in the bottom fifth of parent income reach the top fifth as adults, using national ranks rather than Census household quintiles, and find large differences across US areas.
This is descriptive information to help you frame your own analysis. Eco3min does not provide investment advice.
Go deeper
📁 For pay rather than household income: real wage growth from hourly earnings and CPI
📖 Related analysis: how retirement risk moved onto households
Related questions
Frequently asked questions
Are income quintiles the same as tax brackets?
No. Tax brackets are thresholds set by law for each filing status and apply to taxable income. Quintile limits are statistics, recomputed every year so that each fifth holds the same number of households. When other incomes grow faster, a household with an unchanged real income drifts down the ranking, which a tax bracket never does.
Who is in the bottom quintile?
Mostly small households without earnings. In the same tabulation of the CPS ASEC 2026, bottom-fifth households averaged 1.68 members against 3.07 in the top fifth, and 65.1% had no earner and 48.0% were headed by someone 65 or older. The group therefore describes retirees and single people at least as much as low-paid workers.
Only in part. Census money income is measured before taxes and includes cash benefits such as Social Security, but leaves out noncash benefits such as food assistance, Medicaid and housing assistance, and tax credits such as the Earned Income Tax Credit. The Congressional Budget Office counts these and federal taxes, and ranks households by income adjusted for size, so each of its fifths holds about the same number of people. Its bottom fifth differs in membership as well as in income.
Last updated — 1 October 2026
Disclaimer – Financial and Legal Information: The analyses, commentary, and content published on eco3min.fr are provided for informational and educational purposes only. They do not constitute investment advice or a solicitation to buy or sell financial instruments. Past performance is not indicative of future results. All investment decisions involve risk and are the sole responsibility of the reader. Data, charts and calculated series are provided as is and may contain errors or lag behind their source: check any figure against the primary source cited before relying on it. Content describing laws, regulations or contracts reflects the law as of its publication date and does not constitute legal or tax advice; applying it to a specific situation requires a qualified legal or tax professional.
Regulated and tax values: the rates, indices, caps and brackets with legal effect cited on this page are set by official decision, change over time and apply according to individual circumstances. Only the official publication in force on the relevant date is authoritative (for example the Journal officiel, INSEE, Banque de France, the IRS or the Social Security Administration). To revise a rent, sign or challenge a contract, or file a return, check the value at the source or with a professional.