
Real US household income by percentile, 1967 to 2025
Real US household income, by percentile
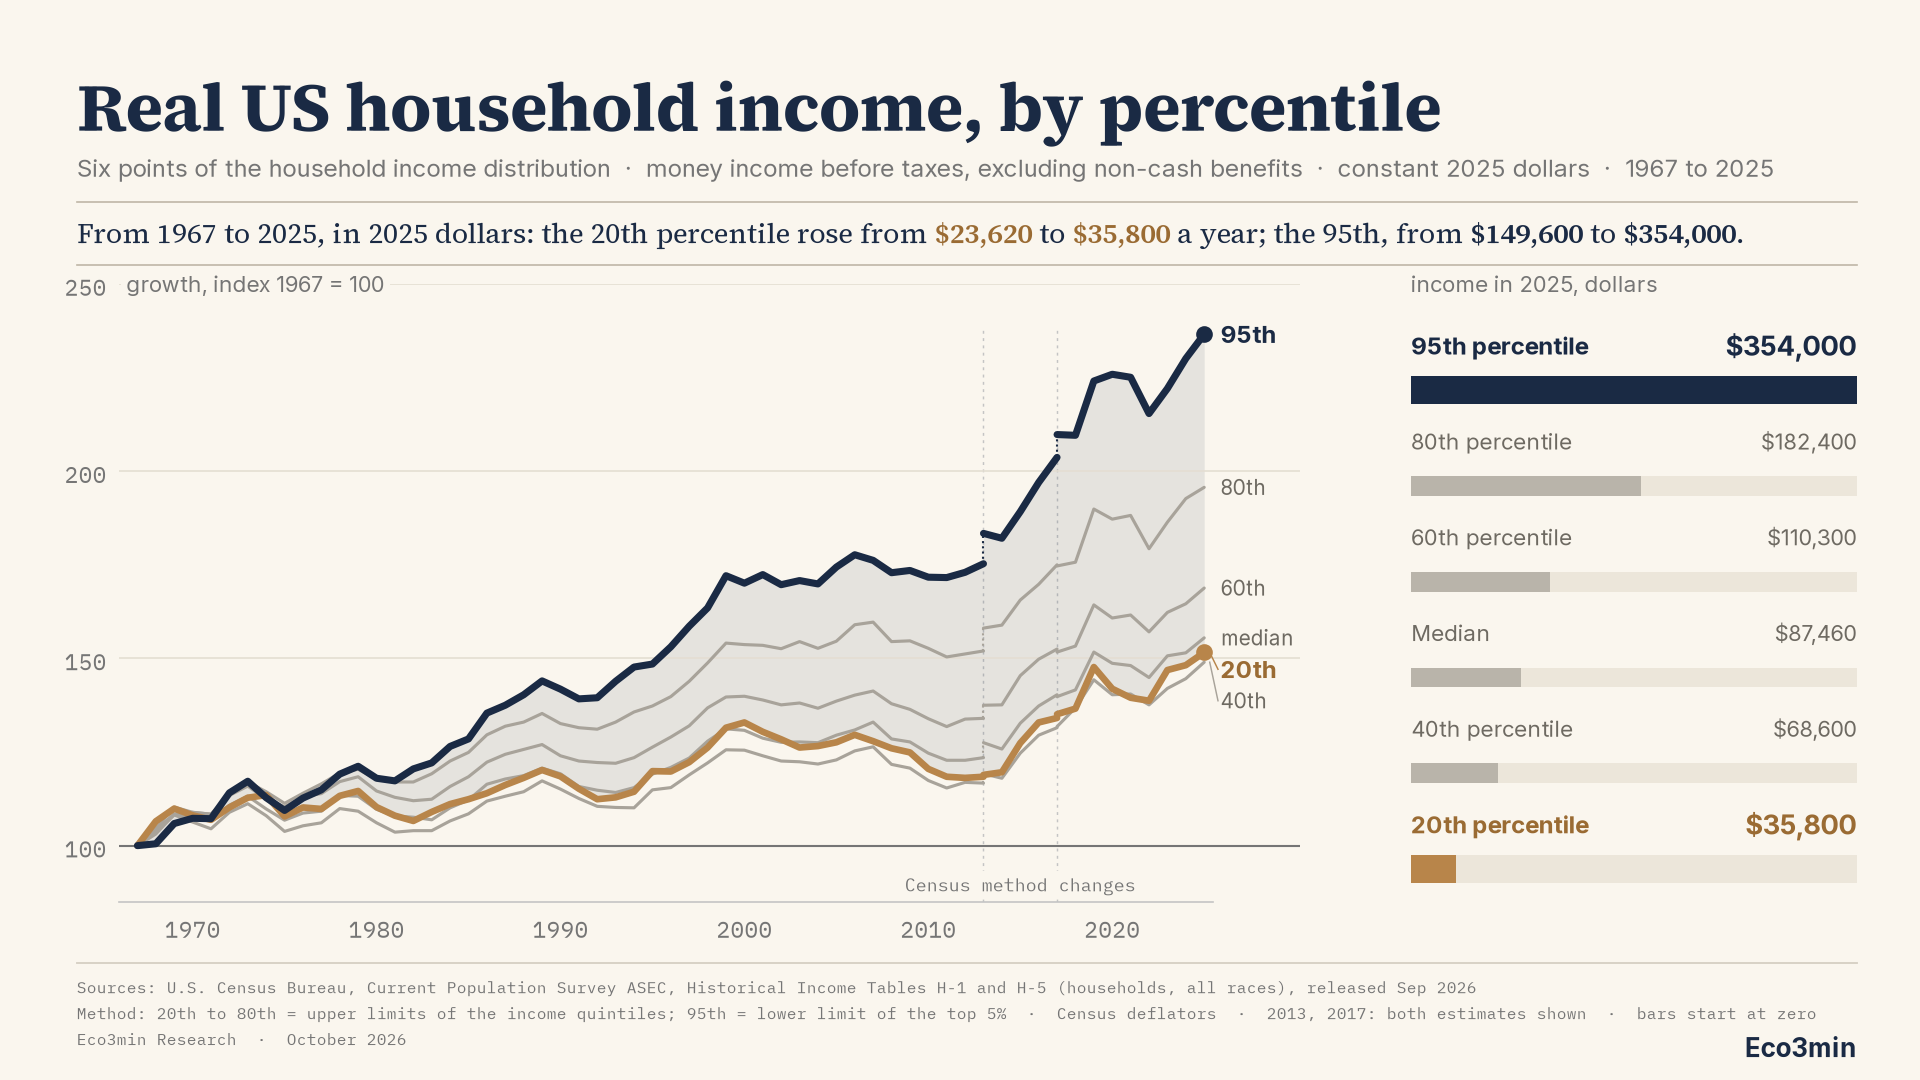
Six points of the household income distribution, 1967 to 2025, in constant 2025 dollars. Switch the view: growth since 1967, income levels, and the gap between the 95th and the 20th percentile.
| Percentile | 1967 | 2025 | Change |
|---|---|---|---|
| 95th | $149,600 | $354,000 | +137% |
| 80th | $93,210 | $182,400 | +96% |
| 60th | $65,360 | $110,300 | +69% |
| Median | $56,230 | $87,460 | +56% |
| 40th | $46,050 | $68,600 | +49% |
| 20th | $23,620 | $35,800 | +52% |
Source: U.S. Census Bureau, Current Population Survey ASEC, Historical Income Tables H-1 and H-5 (households, all races), released Sep 2026.
Method: money income before taxes, excluding non-cash benefits, in constant 2025 dollars (Census deflators). 20th to 80th = upper limits of the income quintiles; 95th = lower limit of the top 5%. Census changed its method in 2013 and 2017 and publishes two estimates for those years: both are shown, the line steps from the old estimate to the new one.
Find the percentile of an income in any year: US household income percentile history.
TL;DR. The Census Bureau’s 2025 income tables, published on 15 September 2026, put real household income at its highest on record at all six points of the distribution they report. Since 1967 the 20th percentile has risen 52 percent and the 95th percentile 137 percent.
- In 2025 dollars, the household at the 20th percentile had $35,800 in 2025, against $23,620 in 1967. The household at the 95th percentile had $354,000, against $149,600.
- From 1967 to 1979 the six points grew at comparable rates, between 9 and 21 percent. Since 1979 the 95th percentile has gained 95 percent and the 20th 32 percent.
- The 95th percentile was 6.33 times the 20th in 1967 and 9.89 times in 2025. The highest ratio in the series is 10.22, in 2021.
Median household income in the United States was $87,460 in 2025, the highest on record since the series began in 1967, according to the Census Bureau’s annual income report published on 15 September 2026. The median is one point of the distribution. The same Census tables publish five others: the incomes that mark the 20th, 40th, 60th and 80th percentiles, and the threshold of the top 5 percent. All five were also at their highest on record in 2025. This page follows the six of them from 1967 to 2025, in constant 2025 dollars, on the same chart.
The chart shows the growth of each point on the left and its 2025 level on the right. The dataset behind it, 59 years of the six values with their index and the Census method notes, is available for download below. The point it establishes is narrow: every one of the six points is higher in real terms than in 1967, and they have not risen at the same pace since about 1980.
Key figures at a glance
Scope: all US households (137.1 million in 2025), annual, 1967 to 2025
Metric: household money income before taxes, excluding non-cash benefits, in 2025 dollars (Census deflators)
2025 levels: 20th percentile $35,800 · 40th $68,600 · median $87,460 · 60th $110,300 · 80th $182,400 · 95th $354,000
Change since 1967: 20th +52% · 40th +49% · median +56% · 60th +69% · 80th +96% · 95th +137%
Change since 1979: 20th +32% · 40th +36% · median +37% · 60th +43% · 80th +63% · 95th +95%
Ratio of the 95th to the 20th percentile: 6.33 in 1967, 6.69 in 1979, 9.89 in 2025, highest 10.22 in 2021
Sources: U.S. Census Bureau, Current Population Survey, Annual Social and Economic Supplement, Historical Income Tables H-1 and H-5, released September 2026. Eco3min calculation of the index and the ratio.
Six points of one distribution
A percentile is a position, not a group of people. In 2025, 20 percent of US households had an income below $35,800 and 80 percent above it; that cut-off is the 20th percentile. The 95th percentile, $354,000, is the income above which the top 5 percent of households sit. The median, $87,460, splits households into two halves. The Census Bureau publishes these thresholds every year from the same survey, the Annual Social and Economic Supplement of the Current Population Survey, and expresses all past years in the dollars of the latest one.
The chart indexes each threshold to its 1967 value, so that a household income of $23,620 and one of $149,600 both start at 100. An index of 152 for the 20th percentile in 2025 means 52 percent more real income than in 1967; an index of 237 for the 95th percentile means 137 percent more. On an annual basis, that is 0.72 percent a year at the 20th percentile, 0.76 percent at the median and 1.50 percent at the 95th.
Together until 1979, apart since
The six lines start at the same point and stay close for twelve years. Between 1967 and 1979 the 40th percentile gained 9 percent, the 20th 15 percent, the median 13 percent and the 95th 21 percent. The 95th percentile first sits ten index points above the 20th in 1982.
From 1979 to 2025 the order is clear and it follows the distribution. The 20th percentile gained 32 percent, the 40th 36 percent, the median 37 percent, the 60th 43 percent, the 80th 63 percent and the 95th 95 percent. The two highest points account for nearly all of the visible opening of the fan. The four lower points end within 20 index points of one another, and the 40th percentile ends slightly below the 20th because it grew less over the whole period, 49 percent against 52. Both percentiles double as cut points, the upper limits of the bottom and second fifths in the Census split of US households into five income quintiles.
The years after the 2008 recession show how differently the points can move in a downturn. Between 2007 and 2012 the 20th percentile fell 7.7 percent in real terms and the 95th 1.8 percent. Since 2019 the four lower points and the 80th have gained between 2.5 and 3.3 percent, the 95th 5.6 percent.
Growth on the left, level on the right
The two panels answer two different questions. The left one compares rates: how much did each point grow from where it started. The right one compares amounts: where each point stands in 2025. In 2025 dollars, the 20th percentile gained $12,180 a year of income since 1967 and the 95th percentile $204,400. The bar of the 20th percentile is 10 percent of the bar of the 95th in 2025; in 1967, with a ratio of 6.33, it would have been 16 percent. Dollar gaps that wide at the upper end are what pull average US household income so far above the median, since a mean counts every extra dollar at the top and a midpoint does not.
Neither panel is the “true” one. A rate comparison can hide that a modest percentage of a large income is a large sum. An amount comparison can hide that a small sum is a large change for a household near the bottom. Shown together, they carry the same data without choosing between the two readings below.
Two readings of the same tables
One reading puts the weight on the floor. Every point of the distribution is at its highest on record, and the 20th percentile has half again the real income it had in 1967. The measure also understates the lower half: it counts income before taxes and leaves out non-cash benefits such as food assistance and Medicaid, as well as refundable tax credits, which are concentrated there. On that view, the chart is a story of broad gains measured with a yardstick that undercounts the bottom.
The other reading puts the weight on the spread. Since 1979 the threshold of the top 5 percent has gained about three times as much as the 20th percentile in percentage terms, 95 percent against 32, and the ratio between them has gone from 6.7 to 9.9. The Census Bureau’s own summary for 2025 notes that the 90th percentile rose while the change at the 10th was not statistically significant. On that view, the chart shows a distribution that stretched, with gains concentrated at the top.
Three points apply to both readings. First, these are households, and households changed: more people live alone, and more couples have two earners, which pulls household incomes apart even when individual pay does not move. Second, part of the opening is a survey change. The 2013 redesign of the income questions raised the 95th percentile estimate by 4.7 percent and the 20th by 0.5 percent; both 2013 estimates are shown on the chart, as are the two 2017 estimates. Third, a percentile is not a cohort. The household at the 20th percentile in 2025 is not the one that was there in 1967, and the chart says nothing about how households move up or down the distribution over their lives. Part of that movement follows the life cycle, and where a household income ranks within its own age group can sit far from its national percentile.
Methodology and sources
Percentiles. U.S. Census Bureau, Historical Income Table H-1, “Limits for Household Income Quintiles and Top 5 Percent of All Households: 1967 to 2025”, all races. The upper limits of the lowest four quintiles are the 20th, 40th, 60th and 80th percentiles; the lower limit of the top 5 percent is the 95th percentile.
Median. U.S. Census Bureau, Historical Income Table H-5, median household income, all races.
Income concept. Money income before taxes: earnings, Social Security, pensions, interest, dividends, cash assistance and other regular cash income. It excludes capital gains, non-cash benefits (food assistance, housing assistance, Medicaid, employer-provided health insurance) and the effect of taxes and tax credits.
Inflation adjustment. As published by the Census Bureau in 2025 dollars: R-CPI-U-RS before 2000 and C-CPI-U from 2000 (Census footnote 28). Eco3min does not re-deflate any value.
Index. Each value divided by its 1967 value, times 100. Ratio = 95th percentile divided by 20th percentile, same year.
Method breaks. The Census Bureau publishes two estimates for 2013 (old and redesigned income questions, footnotes 38 and 39) and for 2017 (old and updated processing system, footnote 40). Both are kept in the CSV. The chart ends the earlier segment on the old estimate and starts the next one on the new estimate, joined by a dotted step; nothing is spliced or chained. The new estimates are the ones used for every figure quoted on this page.
Limitations. (1) Households, not persons, and no adjustment for household size. (2) Before taxes and transfers. (3) Survey data, with sampling error. The Census Bureau tests year-to-year changes for significance, and single-year moves of one or two percent may not be significant. (4) Percentiles are cross-sections, not the same households over time.
Reproducibility. The CSV below carries every year’s six values in 2025 dollars, their index, the 95th to 20th ratio, the Census row label with its footnotes, and a flag on the two superseded method rows. It is built by script from the Census xlsx files; no value is typed in. The chart is produced with Python (matplotlib). To find the percentile of a given household income in any year since 1967, see the household income percentile tool.
Common misinterpretations
Reading the lines as the same households. The 20th percentile line follows a position in the distribution. The households at that position change from year to year, through age, earnings and household formation.
Reading the index as dollars. The 40th percentile ends below the 20th on the left panel and far above it on the right. The left panel compares growth since 1967; the right panel compares levels in 2025.
Reading money income as disposable income. Taxes, tax credits and non-cash benefits are outside the measure. They change the level of each point, most at the bottom and at the top, and they would change the gap between them.
Frequently asked questions
What household income puts a household in the top 5 percent in the United States?
$354,000 in 2025, according to the Census Bureau’s Table H-1. In 1967 the same threshold was $149,600 in 2025 dollars.
What was the median household income in 2025?
$87,460, the highest on record since 1967, up 2.6 percent from $85,210 in 2024 in 2025 dollars. Measured against the national median and adjusted for household size, the income range that counts as middle class in the US sits higher for a family of four than for a single person.
Is the gap between the 95th and the 20th percentile the widest on record?
Not in 2025. The ratio was 9.89 in 2025 and reached its highest value, 10.22, in 2021, when the 20th percentile was at $32,950 and the 95th at $336,800 in 2025 dollars. It was 6.33 in 1967.
Why are there two values for 2013 and 2017?
Because the Census Bureau changed its method in those years and published the year under both methods, so that users can see the size of the change. In 2013 the redesign of the income questions raised the estimates, most at the top. Both values are in the CSV and on the chart.
Why does the chart stop at the 95th percentile?
Because the Current Population Survey tables publish the thresholds of the quintiles and of the top 5 percent. Higher points of the distribution, such as the top 1 percent, come from tax data and other sources, with a different income concept, and are not mixed into this series. One step below the 95th, other Census income tables report the 90th percentile, and together the two lines mark the household income it takes to enter the top 10 or the top 5 percent.
Download the complete dataset
59 years, 1967 to 2025, plus the two superseded method rows: household income at the 20th, 40th, 60th, 80th and 95th percentiles and the median in 2025 dollars, the index 1967 = 100, the 95th to 20th ratio, and the Census row label and footnotes of each value.
Data: U.S. Census Bureau (U.S. government work, public domain). Compilation: eco3min.fr, CC BY 4.0.
Conclusion
The 2025 Census tables give a record at every point of the household income distribution they publish, from the 20th percentile to the threshold of the top 5 percent. Over 58 years the gains range from 49 percent to 137 percent in real terms, and the range opened after 1979, when the six points stopped moving together.
The chart does not say which of the two readings is right. It shows the floor rising and the spread widening on the same data, and the two panels, growth and level, are there so that each reading can be checked against the other.
Last updated — 1 October 2026
Disclaimer – Financial and Legal Information: The analyses, commentary, and content published on eco3min.fr are provided for informational and educational purposes only. They do not constitute investment advice or a solicitation to buy or sell financial instruments. Past performance is not indicative of future results. All investment decisions involve risk and are the sole responsibility of the reader. Data, charts and calculated series are provided as is and may contain errors or lag behind their source: check any figure against the primary source cited before relying on it. Content describing laws, regulations or contracts reflects the law as of its publication date and does not constitute legal or tax advice; applying it to a specific situation requires a qualified legal or tax professional.
Regulated and tax values: the rates, indices, caps and brackets with legal effect cited on this page are set by official decision, change over time and apply according to individual circumstances. Only the official publication in force on the relevant date is authoritative (for example the Journal officiel, INSEE, Banque de France, the IRS or the Social Security Administration). To revise a rent, sign or challenge a contract, or file a return, check the value at the source or with a professional.