
Why is average household income in the US so far above the median?
Average US household income was $126,700 in 2025, against a median of $87,460. Why the mean runs 45% higher, and what the gap says about the distribution.
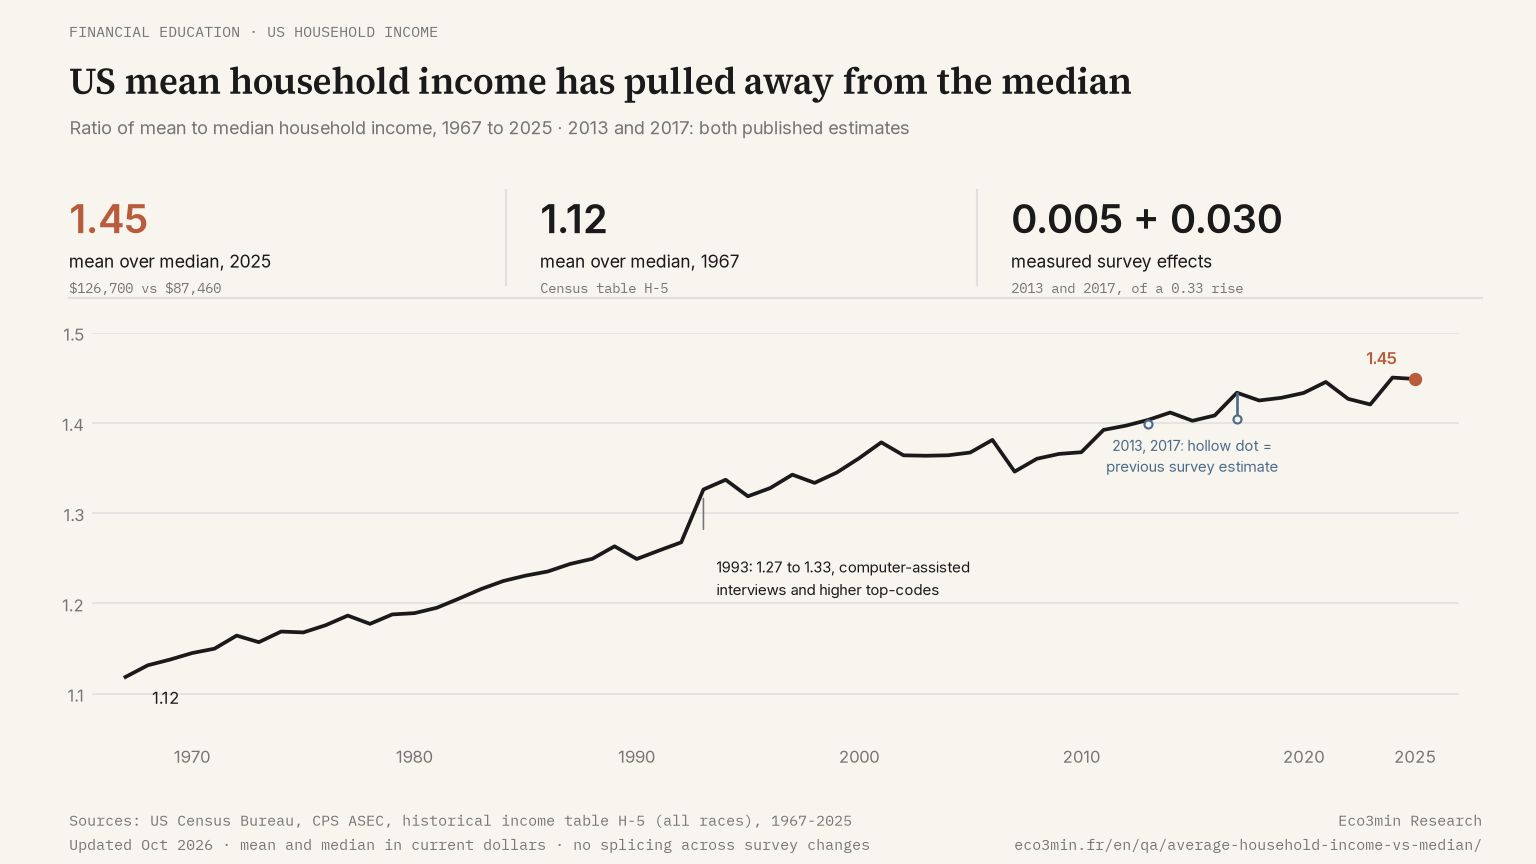
Average household income in the US was $126,700 in 2025, 45% above the median of $87,460, according to the Census Bureau. The mean divides total income by the number of households, so each dollar earned at the top lifts it, while the median, the income of the household in the middle, stays put when the top pulls away. About two households in three earn less than the average, and the gap has widened from 12% in 1967, at least a tenth of that widening coming from survey changes the Census Bureau has measured.
In this article
The short answer
The median and the mean answer two different questions. The median, $87,460 in 2025 in the Census Bureau’s annual income report, is the income of the household in the middle, with half of US households above it and half below. The mean, $126,700, is total household income divided by the number of households.
The two figures would match if incomes were spread evenly on both sides of the middle. They are not. Income cannot fall below zero but can run into the millions, and every dollar at the top enters the mean in full while leaving the median where it is.
In the Census microdata, 65.8% of households had an income below the mean in 2025, which puts the average near the 66th percentile of the distribution. The gap reflects first how far the top pulls away from the middle. It has widened from 12% in 1967 to 45% in 2025, survey changes included.
→ The same distinction for prices: why the Fed tracks a median CPI
What the data shows
Census Bureau historical table H-5 carries both measures, updated each September and drawn from the Annual Social and Economic Supplement of the Current Population Survey (CPS ASEC). Income is money income before taxes. It leaves out noncash benefits such as food assistance and Medicaid, and employer-provided health insurance.
In 2025 dollars (Census Bureau, historical table H-5 and table 6 of the income report for 2025):
- Median $87,460, mean $126,700 in 2025, or about $7,290 and $10,560 a month before taxes.
- A ratio of mean to median of 1.12 in 1967, 1.19 in 1979, 1.36 in 2000, 1.43 in 2019 and 1.45 in 2025.
- From 1967 to 2025, real growth of 101.5% for the mean, from $62,890, against 55.5% for the median, from $56,230.
- The top 5% of households received 23.5% of all household income in 2025, against 17.2% in 1967; their average income was $594,500.
- A Gini index of household income up from 0.397 in 1967 to 0.490 in 2025.
The ratio was the same in 2019 and 2022, at 1.43, and reached 1.45 in 2025. Its largest one-year move, from 1.27 to 1.33 in 1993, coincides with a change in the survey itself, discussed below.
→ Data by percentile: household income percentiles year by year
Why the gap exists
The published gap reflects the shape of the distribution and, to a lesser degree, the way the survey captures it.
A distribution stretched at the top. A few households earn many times the median, and every one of their dollars counts in the mean. Set aside the top 5% of households, whose average income was $594,500 in 2025 (Census table 6), and the mean of the other 95% falls to about $102,000: the top 5% alone lift the mean by $24,700, close to two thirds of its lead over the median. The upper percentiles have also grown faster than the middle, a divergence traced in how the percentiles drifted apart after 1979.
Changes in measurement. For 2013 and 2017, the Census Bureau published two estimates, one under the old method and one under the new. The redesigned income questions of 2013 and the updated processing system of 2017 raised the ratio by 0.005 and 0.030, together at least a tenth of its 0.33 rise since 1967. The jump of 1993 coincides with the move to computer-assisted interviews and with higher caps on reported amounts (top-coding), earnings being coded up to $999,999. The same year the Gini index rose from 0.433 to 0.454.
Census does not splice the series: any comparison across 1993, 2013 or 2017 includes these breaks.
By regime, the ratio rose in each period, at speeds that follow the inflation cycle only loosely. From 1967 to 1979, years of rising inflation, it gained 0.07 while the top fifth’s share of income barely moved (43.6%, then 44.2%); the middle fifth lost ground instead, from 17.3% to 16.8%. From 1979 to 2000, years of disinflation in which labor economists document a rising pay premium for skills, it gained 0.17, a third of it in 1993 alone, and the top fifth’s share reached 49.8%. Since 2000 it has gained 0.09, of which 0.035 comes from the method changes of 2013 and 2017. Set the identified survey changes aside and the pace of widening separates the regimes: about 0.006 a year before 1979, 0.005 from 1979 to 2000 without the 1993 jump, 0.002 since 2000.
Two households in three earn less than the average, and at least a tenth of the gap’s widening since 1967 is a matter of measurement.
→ Framework: financial trade-offs in everyday life
What it means for different economic actors
Households. A household that compares itself with the average American household measures itself against a level that only about a third of households reach. It is the median that places a household among the others. The mean spreads total income evenly across all households.
Investors and analysts. Personal income in the national accounts is a total: divided by the number of households, it gives a mean, on a broader definition of income than the Census survey. In table H-5 the real mean has risen almost twice as much as the median since 1967, 101.5% against 55.5%, so a per-household aggregate says little about what the household in the middle gained.
Public programmes. US housing assistance sets its income limits as a share of area median family income, 50% and 80% for the main categories, in figures published each year by the Department of Housing and Urban Development (HUD). Anchoring on the median ties the thresholds to the family in the middle of each area, whatever happens at the top.
A common error is to read average household income as the income of a typical household. On 2025 figures, that reading places the typical household about $39,200 above the actual middle of the distribution.
Practical observation
What the data suggests for understanding your situation:
- Question to ask yourself: when a figure is quoted as household income, is it a mean or a median, for households or for individuals, before or after taxes?
- Data to monitor: the ratio of mean to median in Census table H-5, released each September, 1.45 for 2025. A rise means upper incomes are moving away from the middle; a change of method, flagged in the footnotes, can move it as well.
- Historical parallel: from 2000 to 2019, the ratio rose from 1.36 to 1.43, and about half of that rise came from the method changes of 2013 and 2017.
- What the literature documents: Autor, Dube and McGrew (NBER, 2023) find that the wage gains at the bottom after the pandemic reversed about a third of the four-decade rise in the 90/10 gap of hourly wages, a measure distinct from household income. Piketty and Saez (2003), working from tax returns, trace the rise of top income shares since the 1970s.
This is descriptive information to help you frame your own analysis. Eco3min does not provide investment advice.
Go deeper
📊 Comparison: nominal versus real wages
📁 Dataset: how US household wealth splits across generations
📖 Related analysis: why inflation weighs more on lower incomes
Related questions
Frequently asked questions
Is median household income the same as median pay?
No: household income adds the money income of every member of the household, from wages and self-employment to Social Security, pensions, interest and dividends. A household with two earners counts both salaries, and a retired household with no earnings counts its pension. The median household income of $87,460 in 2025 therefore ranks households, while a median wage ranks individual workers. The Census Bureau publishes the earnings of full-time, year-round workers in separate tables.
How much of the widening gap comes from changes in the survey?
At least a tenth, and possibly close to three tenths. In 2013 the ratio was 1.399 under the old method and 1.404 under the new; in 2017, 1.404 and 1.434. Together the two breaks add 0.035, a tenth of the 0.33 rise since 1967. The 1993 jump of 0.06 has no double estimate; if it were entirely due to the survey, measurement would account for 28% of the rise.
Can the average rise while the median household gains nothing?
Yes, and the arithmetic is short. With the top 5% of households holding 23.5% of all income in 2025, a 10% rise in their average income lifts the overall mean by about 2.35% and leaves the median unchanged. The ratio can also fall: in 2022, the real mean dropped 3.5% and the median 2.2%, taking the ratio from 1.45 in 2021 to 1.43.
Last updated — 1 October 2026
Disclaimer – Financial and Legal Information: The analyses, commentary, and content published on eco3min.fr are provided for informational and educational purposes only. They do not constitute investment advice or a solicitation to buy or sell financial instruments. Past performance is not indicative of future results. All investment decisions involve risk and are the sole responsibility of the reader. Data, charts and calculated series are provided as is and may contain errors or lag behind their source: check any figure against the primary source cited before relying on it. Content describing laws, regulations or contracts reflects the law as of its publication date and does not constitute legal or tax advice; applying it to a specific situation requires a qualified legal or tax professional.
Regulated and tax values: the rates, indices, caps and brackets with legal effect cited on this page are set by official decision, change over time and apply according to individual circumstances. Only the official publication in force on the relevant date is authoritative (for example the Journal officiel, INSEE, Banque de France, the IRS or the Social Security Administration). To revise a rent, sign or challenge a contract, or file a return, check the value at the source or with a professional.