Real Rates: The True Cost of Capital Is Repricing
Why real rates are reasserting themselves as markets' anchor and how to recalibrate investment and financing decisions facing this regime shift.

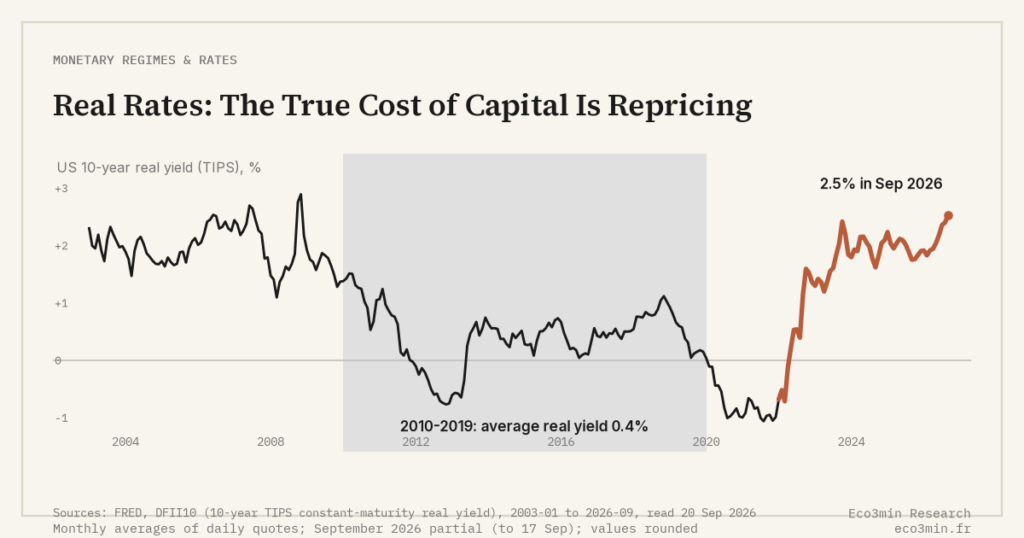
Why real rates are returning as the central indicator for steering investments and financing decisions in 2026.
TL;DR
Ten-year US real rates near 1 to 1.5% have climbed back toward the historical 1 to 3% norm that the 2010-2019 zero-rate decade had suspended, resetting the cost of capital.
- A move from 0% to 1.5% in the real rate materially lowers the present value of distant cash flows, weighing more on long-duration growth models than on already cash-generative firms.
- Positive real rates restore a structural yield to sovereign and investment-grade bonds, which function as a portfolio building block again rather than a purely defensive one.
Real Rates: The True Price of Capital
In 2026, public debate remains focused on policy rates and the next central bank decision. Yet the decisive parameter lies elsewhere: the level of real rates, that is, the nominal rate adjusted for expected inflation.
In the United States, 10-year real rates hover around ≈1–1.5%. In the euro area, they oscillate between 0–0.5%. These are not historically extreme levels. Yet compared with the 2010–2019 decade, marked by zero or negative real rates, they profoundly redefine the system’s “financial gravity.”
To grasp this shift, the analysis must be placed within the broader context of monetary policy and rate regimes. What matters is not the next 25 basis-point cut but the new floor around which real rates are anchoring.
Why Real Rates Matter More Than Policy Rates
Policy rates steer the short end. Long-term real rates drive:
- equity valuations (the discounting of future cash flows);
- the profitability of investment projects;
- the real cost of public and private debt;
- the trade-off between saving and risk-taking.
A real rate moving from 0% to 1.5% materially alters the present value of distant cash flows. Growth models heavily dependent on profits expected 5–10 years out are mechanically more sensitive than firms already profitable and cash-generative. Related work: Our account of the rate-cycle imprint on corporate profitability. This sensitivity of long-duration growth models sits within what holding a defence beyond its cycle actually costs.
The Regime Shift: A Return Toward Historical Norms
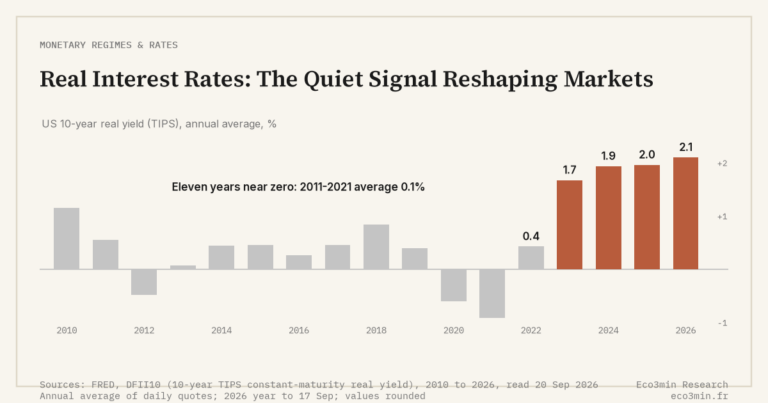
The 2010–2019 decade was atypical: negative real rates, massive quantitative easing, very low inflation. Historically, positive real rates of 1–3% have been the norm.
In 2026, several structural forces support a higher floor:
- reindustrialization and infrastructure investment;
- increased defense spending;
- energy transition;
- fiscal constraints and sovereign risk premia.
Even if nominal rates ease slightly, inflation stabilized around 2% can keep real rates in positive territory. This point remains underappreciated in many allocation models.
Direct Impact on Asset Classes
1. Equities
- Multiple compression for stocks with distant cash flows.
- A premium for solid balance sheets and immediate cash flow.
- Repricing of highly leveraged firms.
2. Bonds
Positive real rates restore a structural yield to sovereign and investment grade bonds. They become a strategic component again, no longer merely defensive.
3. Real Estate
A positive real rate raises the real cost of credit over time. Even where prices stabilize, financial leverage becomes less generous. Recent experience with the new real estate cycle shows that adjustment often occurs through volumes before prices.
Common Reading Errors
Error 1: looking solely at the nominal policy rate. A 4% rate with 3% inflation does not produce the same effect as a 4% rate with 1.5% inflation. This nuance between nominal and real signal is precisely what informs our reading of rising markets despite an inverted yield curve.
Error 2: treating the 2010–2019 decade as the long-term norm.
Error 3: reading real rates as a binary signal for equities. They act as a filter, not a switch.
Three Possible Three-Year Trajectories
1. Moderately Positive Plateau (Central Scenario)
Real rates around 0–0.5% in the euro area, 1–1.5% in the United States. A demanding but stable environment. Bonds regain a structural role.
2. Return Toward 0%
A pronounced economic slowdown, a sharper drop in policy rates. Support for valuations, but a more fragile macro backdrop.
3. Persistently Elevated Real Rates
Higher sovereign risk premia, moderate but persistent inflation. Real rates at 1.5–2% in the United States. Prolonged adjustment for segments sensitive to the cost of capital.
This third scenario remains poorly priced in.
Allocation Reference Points in a Positive Real Rate World
In environments where real rates remain durably above 1%, historically observed structures have combined three building blocks: risk assets prioritizing profitable, cash-generative names; quality bonds; and a liquidity reserve to capture dislocations. The relative weighting observed across mandates has varied, with risk-asset shares typically positioned around half of the portfolio, quality fixed income forming the bulk of the remainder, and a residual cash buffer.
The objective in such configurations is not to eliminate risk but to align portfolio sensitivity with the cost of capital.
KPIs to Track Regularly
- 10-year yield minus expected inflation: a direct measure of the real rate.
- Equity risk premium: the spread between earnings yield and real rate.
- Weight of financial expenses in corporate accounts.
A stable but elevated real rate acts slowly. Its impact is gradual, yet durable.
Conclusion
A world of positive real rates is not hostile to investors. It is simply less permissive. It rewards capital discipline, robust balance sheets, and tangible cash flows.
For investors, the challenge is not anticipating every central bank decision but calibrating exposure to the cost of capital. For companies, the task is selecting projects able to generate returns above this new real threshold.
The regime is less spectacular than inflation shocks or banking crises. Yet it will silently shape the trajectory of returns over the next decade.
Frequently Asked Questions
Do high real rates automatically imply falling equities?
No. They raise the bar for required returns. Solid companies can continue to perform.
How can portfolio exposure be measured?
By identifying assets dependent on distant cash flows or heavily leveraged. The higher their share, the greater the sensitivity to real rates.
Do inflation-linked bonds offer full protection?
They protect against inflation surprises but not against a rise in the real rate itself.
Three Takeaways
- Real rates set the true price of capital, more than nominal policy rates.
- A durably positive plateau filters business models and reduces tolerance for excessive leverage.
- Adjusting allocation to this regime matters more than speculating on the next monetary policy decision.
Last updated — 20 September 2026
Disclaimer – Financial Information: The analyses, commentary, and content published on eco3min.fr are provided for informational and educational purposes only. They do not constitute investment advice or a solicitation to buy or sell financial instruments. Past performance is not indicative of future results. All investment decisions involve risk and are the sole responsibility of the reader.
Read next
Full pillar →Real Interest Rates: The Quiet Signal Reshaping Markets
Real interest rates: why their persistence in positive territory in 2026 is reshaping the rules for bonds, equities,…
OAT-Bund Spread: A Quiet Gauge of French Sovereign Risk
OAT-Bund spread: how this yield gap has become a key signal on French sovereign risk, fiscal policy and…
Inverted Yield Curve: Reading a Regime Signal Without Immediate Effect
The inverted yield curve operates as a regime signal, not a timing tool. Its lagged effects are constitutive…