Yield Curve Signals: What the 2026 Configuration Reveals
The US yield curve is dis-inverting but credit conditions remain tight heading into 2026. Mid-duration has reemerged as a central reference as markets reprice the cost of time.

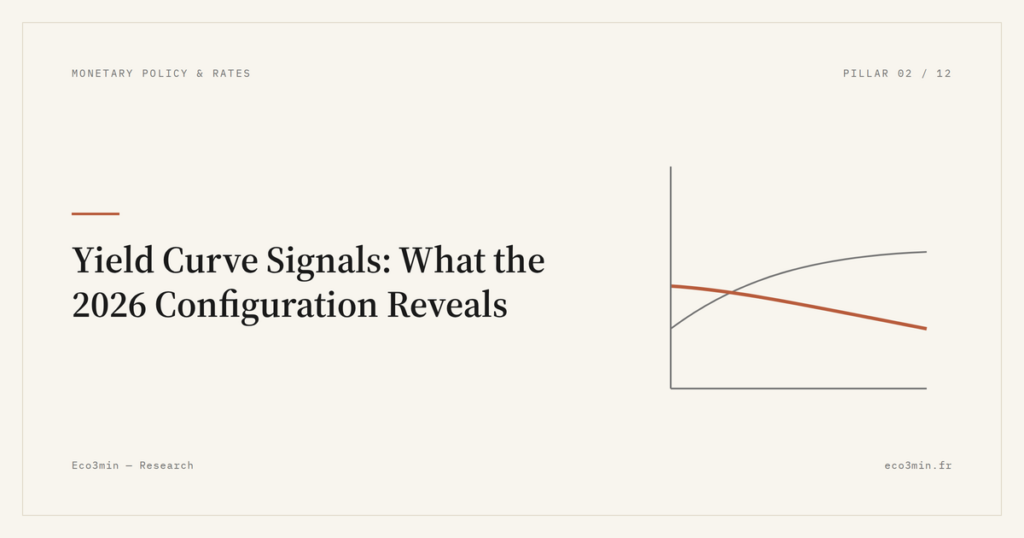
The yield curve has steepened, but credit has not yet followed: a key signal for investors and corporates entering 2026.
TL;DR
The U.S. yield curve has partially dis-inverted since August 2025, but corporate borrowing costs have not followed — the central risk is no longer recession but tighter, more rationed credit.
- Long rates stay anchored around 3.8–4.1% in early December 2025, with the 10-year near 4.0% (down from a ~5% peak in October 2024) and the 2-year easing toward ~3.7%.
- Central banks are signaling possible 2026 rate cuts, even as the gap between policy and corporate funding stays wide for fragile borrowers.
- Duration is back as a variable: historically, 5–7 year bonds offered a more balanced yield-to-risk profile than the very short or very long ends.
Major trends to watch this week
- United States: the 10-year Treasury yield hovered around ≈4.0% as of December 9, 2025, against a peak near 5% in October 2024, while the 2-year eased toward ≈3.7%. The 2s10s spread has turned slightly positive: markets are pricing a “long landing” rather than a sharp recession.
- Euro area: the 10-year Bund trades around 2.3–2.5%, while the ECB has held its deposit rate at 3.75% since September 2025. The curve remains flat — a sign that potential growth is judged subdued.
- China: the PBoC keeps its 1-year lending rate near 3.35% and is pushing banks to extend credit maturities, an attempt to revive investment without triggering a bond bubble.
- Credit spreads: US investment-grade spreads sit around ≈120 bps over Treasuries (late November 2025 levels), well below the 200+ bps typical of stress periods. Markets are not yet pricing a default wave.
Detailed analysis: what the data actually reveal
The yield curve is no longer the binary “inversion = recession” signal repeated since 2022. In early December 2025, the historical 2s10s inversion that lasted more than 600 days between 2022 and 2024 is fading, but without genuine relief on the overall cost of capital. Markets are accepting durably elevated policy rates without pricing a near-term growth collapse. This dissociation is documented in our framework on equity markets and the inverted yield curve, which explains why index gains can coexist with restrictive monetary conditions.
Macroeconomically, this is consistent with US GDP still expanding around ≈1.5–1.8% annualized in Q3 2025, core inflation back near 2.4–2.6%, and wages still growing above 3%. The Fed can therefore signal initial cuts in 2026 without urgency. Long rates, meanwhile, embed three components: elevated public debt (federal debt above 120% of GDP), reset term premia, and political uncertainty heading into 2026.
At the micro level, US investment-grade corporates can still refinance at 5–10 years near 5% (Bund 4% plus ≈100 bps in the euro area). High-yield issuers, by contrast, face coupons of 8–10% on new issuance in late 2025 — three to four points more than between 2015 and 2019. Capital-intensive sectors — listed real estate, telecoms, utilities, infrastructure — have already seen ROE compressed: incremental capex must clear a net return above 8–9% to justify the investment.
This reading of the yield curve takes its full meaning when integrated into the broader transmission mechanism from interest rates to financial markets: asset valuations, cost of capital, equity-bond arbitrage, and sector hierarchy. This analytical framework is detailed in the major article on the impact of interest rates on financial markets.
Immediate consequences for portfolios and balance sheets
The current yield curve configuration changes the rules compared with 2020–2021. Empirically:
- Bond exposure: in regimes combining an upward-sloping curve with elevated short rates, mid-duration profiles have historically captured most of the term premium with less volatility than long maturities. The 3–7 year segment has typically been the focal area in such configurations, with reference yield-to-maturity points appearing above ≈3.8% in the euro area and ≈4.5% in USD on investment-grade names. These are observed conditions, not allocation guidance.
- Equities: heavily leveraged small caps have historically shown the highest sensitivity to a sustained rate plateau. Sector behavior since 2022 confirms this pattern, particularly when corporate debt resets at coupons above 8%. Issuers whose debt is fixed-rate beyond 2028 have shown comparatively lower sensitivity.
- Corporate balance sheets: issuers that refinanced when their specific credit spread sat below the 2015–2019 average have historically locked in better effective costs. A spread of less than 150 bps over a top-rated national peer at a 5-year tenor is observed as one such reference window.
- Households: in mortgage decisions, debt-service-to-income ratios at or below 30%, stress-tested at +200 bps, reflect prudential thresholds documented by national supervisors. Fixed 20-year offers below 3% in the euro area or 5% in the United States have historically been observed as defensible reference points despite the elevated rate plateau.
Weak signals worth tracking
- US 5s30s spread: a durable move above 70 bps would indicate that markets are pricing higher long-run inflation, which has historically penalized unprofitable growth equities.
- High-yield issuance volumes: a drop of more than 30% over six months relative to 2023–2024 would signal credit rationing — historically a precursor of higher defaults at a 12–18 month horizon.
- Variable-rate loan share in euro-area SME balance sheets: exceeding 60% increases the risk of cascading insolvencies if the ECB delays rate cuts.
- Bank lending conditions index: if it stays in restrictive territory for more than three consecutive quarters, euro-area GDP growth has historically come in below 1% even as policy rates ease.
Outlook: 3–12 months
Scenario 1 – Controlled landing (probability ≈50%)
Policy rates begin a cautious decline from H2 2026, while long rates remain around 3.5–4% in the United States and 2–2.5% in the euro area. Historical reference balances under this scenario have tilted toward a mix of equities, mid-duration bonds and a residual cash buffer. KPI to track: US core inflation durably below 2.5% over three quarters.
Scenario 2 – Inflation rebound and steeper curve (probability ≈30%)
A cost shock (wages, commodities) lifts inflation toward 3–3.5% in 2026. US long rates rise toward 4.5–5%, and the curve steepens sharply. Historical pattern: shorter duration (3–5 years maximum) and pricing-power equities have outperformed in such regimes. KPI: 5-year inflation expectations crossing back above 2.8%.
Scenario 3 – Marked slowdown and renewed inversion (probability ≈20%)
Credit conditions tighten, high-yield defaults rise by 2–3 points year-on-year, and US growth approaches zero. The Fed has to cut faster: short rates fall, long rates decline more slowly, and the curve re-inverts. Historical pattern: quality fixed income with longer duration (7–10 years) has outperformed in such regimes, while cyclical exposure has compressed.
Conclusion
The 2025 yield curve is sending a less spectacular message than “imminent recession,” but a more demanding one: the price of time has changed. Duration is no longer a technical detail; it has become the core driver of fixed-income performance over 3–5 years. For corporates, every basis point matters in the profitability calculation. Reading these signals early is what separates a cycle of advantage from a cycle of catch-up. A companion piece: The Eco3min study of how monetary policy reaches corporate earnings.
- The yield curve is no longer just a recession indicator: it is redrawing the cost of capital and the asset hierarchy for 2026.
- With the US 10-year near 4% and high-yield credit at 8–10%, mid-duration has reemerged as a central observation point for fixed-income performance.
- Three plausible scenarios for the curve over the next 12 months suggest distinct configurations of duration, credit and equity sensitivity.
Last updated — 4 August 2026
Disclaimer – Financial Information: The analyses, commentary, and content published on eco3min.fr are provided for informational and educational purposes only. They do not constitute investment advice or a solicitation to buy or sell financial instruments. Past performance is not indicative of future results. All investment decisions involve risk and are the sole responsibility of the reader.
Read next
Full pillar →Real Interest Rates: The Quiet Signal Reshaping Markets
Real interest rates: why their persistence in positive territory in 2026 is reshaping the rules for bonds, equities,…
OAT-Bund Spread: A Quiet Gauge of French Sovereign Risk
OAT-Bund spread: how this yield gap has become a key signal on French sovereign risk, fiscal policy and…
Inverted Yield Curve: Reading a Regime Signal Without Immediate Effect
The inverted yield curve operates as a regime signal, not a timing tool. Its lagged effects are constitutive…