Inverted Yield Curve: Reading a Regime Signal Without Immediate Effect
The inverted yield curve operates as a regime signal, not a timing tool. Its lagged effects are constitutive of the indicator, not a flaw — and explain why intermediate phases are often the longest and most misread.

The inverted yield curve is a macroeconomic indicator drawn from the bond market, frequently used to characterise the state of the financial and economic cycle. It reflects an intertemporal tension between the cost of short-term financing and long-term expectations, revealing a gradual weakening of the prevailing regime. This imbalance acts primarily on the structure of the financial system, well before any visible manifestation in real activity. A common misunderstanding is to expect a quick effect or an event-driven trigger from this signal, when it was never designed as a timing tool. This page explains why yield curve inversion should be read as a regime signal, characterised by lagged and often silent effects.
This reading does not point to a weakness in the indicator, but to a confusion about its nature. The yield curve was never designed as an instant trigger. It belongs to a different category: that of regime signals, whose function is to characterise an environment, not to synchronise events.
A Signal of Imbalance, Not an Event Indicator
In its fundamental logic, the yield curve compares the remuneration of short time horizons with that of long horizons. An inversion reflects an intertemporal tension: the present becomes more costly to finance than the anticipated future. This configuration points to a growing inconsistency between immediate constraints and the perceived long-term trajectory.
This message is not directional in the conventional sense. It says neither when nor how an adjustment will occur. It simply indicates that the equilibrium on which the economic and financial regime rests is becoming more fragile. It is precisely for this reason that its effect cannot be immediate: it addresses the structure of the system, not its surface.
Why the Absence of a Quick Effect Does Not Contradict the Signal
A common error is to judge the relevance of the yield curve by visible short-term reactions. This expectation implicitly turns a regime indicator into a timing tool, which it has never been. When no immediate rupture appears, the signal is then perceived as faulty.
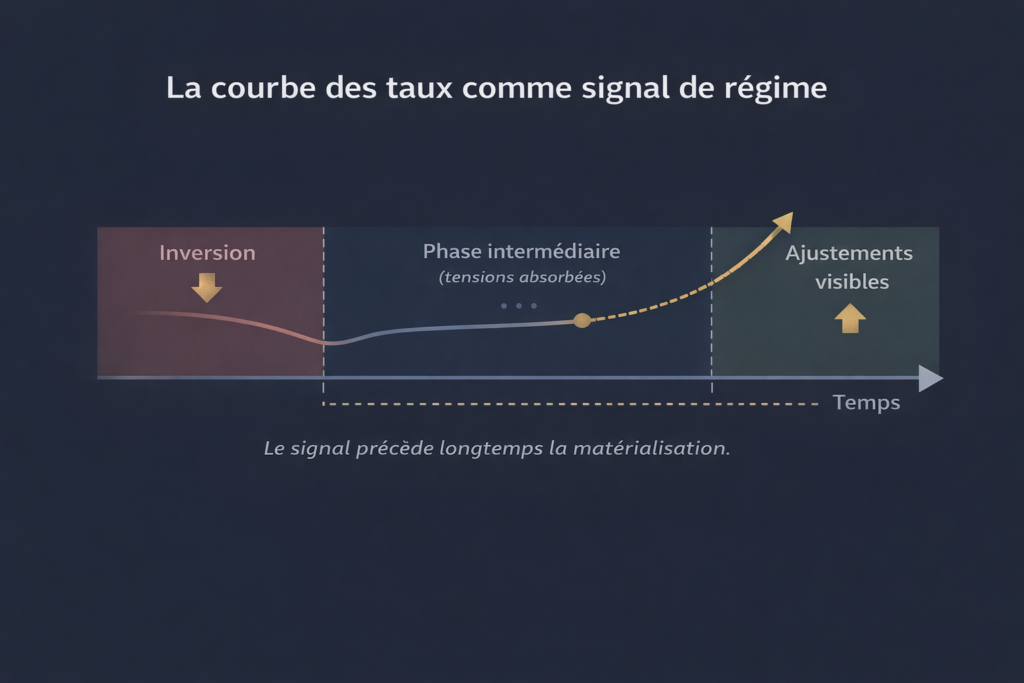
In reality, the absence of rapid materialisation often constitutes information in itself. It indicates that the system still operates under constraint, without having absorbed the tensions revealed. This intermediate phase can last a long time: it corresponds to a regime that is still functional, but increasingly unsustainable.
The Time Lag as a Structural Property
The yield curve operates on a different timescale from that of markets or cyclical indicators. It informs on the global consistency between financing, expectations and future growth, while asset prices first reflect current flows and inherited equilibria.
This lag is neither an anomaly nor an exception: it is constitutive of the signal. Between the appearance of inversion and the visible adjustments, there is often a prolonged phase during which traditional indicators remain compatible with a reassuring reading, without invalidating the underlying message.
This delayed functioning can only be understood by placing the yield curve within a global reading of arbitrage mechanisms — a reading structured in our sub-pillar on cross-asset correlations under macro regimes, financing and transmission that shape the functioning of financial markets, beyond signals taken in isolation.
- The yield curve is a regime indicator, not a timing tool.
- The absence of an immediate effect does not contradict the signal: it is part of it.
- Intermediate phases are often the longest and the most misread.
The Most Common Reading Errors
The first error is to expect a direct causal link between inversion and a visible slowdown. The yield curve does not “cause” an event; it signals a growing incompatibility between the financial framework and the economic trajectory.
The second is to mistake apparent stability for regime normality. An environment can remain functional while becoming progressively more constrained — this is precisely the signature of the hidden tensions that shape markets, particularly when adjustments are delayed by the inertia of existing structures.
Finally, a binary reading — signal valid or invalid — prevents understanding of the intermediate phases, often the longest, during which imbalances accumulate without visible rupture.
Judging the validity of the yield curve from the absence of an immediate slowdown amounts to confusing a regime indicator with an event-driven trigger.
Reading the Yield Curve as a Regime Indicator
Interpreting the yield curve correctly means placing it within a regime reading. It does not answer the question “what will happen?”, but a more fundamental one: in what type of environment is the financial system operating?
From this perspective, inversion signals the moment when expansion ceases to be spontaneously facilitated by financial conditions and becomes conditional. This shift is gradual, often invisible at first, but structural over time.
In economies marked by strong financial inertia, regime imbalances appear well before visible adjustments. Understanding this lag helps avoid premature readings and hasty conclusions.
Going Further in the Analysis
The way this regime imbalance gradually transmits to the economy and the cycle constitutes a distinct level of analysis. This articulation is complemented by our study on the impact of rising rates on financial markets. It is also examined more closely in the analysis dedicated to the relationship between the yield curve and recession, which explores why the most binding effects appear well before any visible rupture.
Conclusion
The inverted yield curve does not promise an event, it describes an imbalance. Its message is measured neither by the speed of its materialisation nor by the immediate reaction of markets, but by the consistency of what it reveals about the prevailing regime.
In economic cycles, the most structural signals are often those that remain silent the longest. Their role is not to herald a spectacular rupture, but to flag, upstream, that the equilibrium is becoming progressively more fragile.
Last updated — 4 June 2026
Disclaimer – Financial Information: The analyses, commentary, and content published on eco3min.fr are provided for informational and educational purposes only. They do not constitute investment advice or a solicitation to buy or sell financial instruments. Past performance is not indicative of future results. All investment decisions involve risk and are the sole responsibility of the reader.