Russell 1000 Index: A Quiet X-Ray of US Equity Risk
The Russell 1000 reveals the actual distribution of US equity risk, beyond the megacaps that dominate the S&P 500 — dispersion, concentration and real rates as keys.

Russell 1000 Index: how it reveals the real distribution of US equity risk, beyond the megacaps that dominate the S&P 500.
TL;DR
The Russell 1000 covers about 92% of U.S. market cap and exposes the internal dispersion the S&P 500 smooths over — a market increasingly running at two speeds.
- Since early December 2025 the Russell 1000 has gained roughly 9% on the year against about 13% for the S&P 500, as tech megacaps pulled the headline index while the rest hesitated.
- The widening gap signals that the U.S. rally rests on a narrower base than the headline indices suggest.
- Real-rate levels and the slope of the yield curve shape how performance splits between large- and mid-caps; dispersion, top-10 concentration and mid-cap participation track it.
The Trigger Event: When the Russell 1000 Decouples From the S&P 500
Since early December 2025, the Russell 1000 has gained roughly ≈9% on the year, against ≈13% for the S&P 500 (US equity market data, index aggregates). The gap widened in a few weeks as tech megacaps pulled the S&P 500 higher, while the rest of the market stayed visibly more hesitant.
This divergence, still little discussed, signals that the US equity rally rests on a narrower base than it appears. The Russell 1000, which combines the 1,000 largest US listed companies, offers a far finer view of risk distribution than the S&P, limited to 500 names and heavily concentrated on a handful of tech giants. Also relevant: the Eco3min framework on financial innovation, market infrastructure and systemic risk.
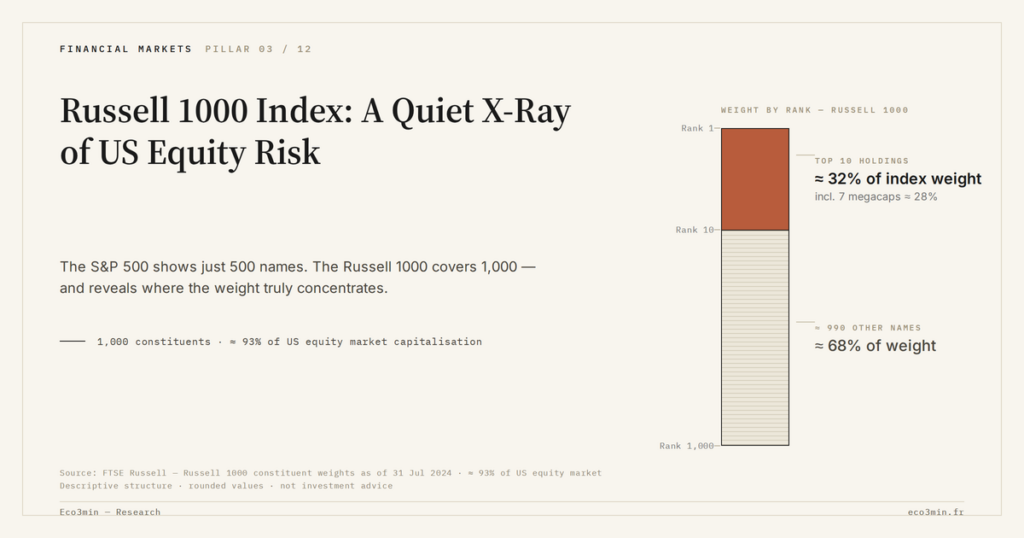
What is shifting quietly is the way the weight of winners and losers is being redistributed inside the US market: the Russell 1000 is starting to reflect a two-speed market, far from the smoothed image given by the headline indices.
What the Russell 1000 Actually Measures
The Russell 1000 groups the 1,000 largest US listed companies (large & upper mid caps). In practice, it represents ≈92–93% of total US equity market capitalization (order of magnitude from broad market aggregates). It therefore sits between:
- the S&P 500, more concentrated and dominated by around ten names,
- and the Russell 2000, focused on more volatile small caps.
Structurally, the Russell 1000 answers three questions:
- How much of the rally is genuinely shared between large and mid caps?
- Does performance come from a concentrated core of names or from a broader set?
- How is the heart of the US market evolving, beyond emblematic single names?
To place this signal within a broader rate and risk premium frame, the Russell 1000 reads usefully alongside indicators such as real policy rates and the yield curve, addressed in the general framework on monetary policy and risk assets.
Macro Backdrop: Rates, Inflation, Valuations and the Russell 1000
Between 2022 and 2024, central banks raised policy rates from near 0% to zones of 4–5% in advanced economies, to counter inflation that had exceeded 8% year-over-year in some countries in 2022 (central bank and official statistics). In 2025, headline inflation fell back to around 2–3% in most advanced economies, while nominal rates remained elevated, keeping real rates moderately positive.
This regime of moderately positive real rates has two key consequences for the Russell 1000:
- Pressure on valuation multiples: future cash flows are discounted at a higher rate, weighing on valuations in principle, especially for long-duration growth names.
- Sharper selection between winners and losers: companies able to maintain margins despite a higher cost of capital and rising wages are rewarded; others are penalized.
Concretely, this translates within the Russell 1000 into greater performance dispersion across sectors and capitalization sizes. Where the S&P 500 masks part of this dispersion by overweighting a few groups, the Russell 1000 lets pockets of fragility appear more clearly.
Why the Consensus Is Looking Elsewhere
The dominant market scenarios remain centered on the «soft landing» question: moderate growth (around 1.5–2% for US real GDP in 2025 according to standard macro projections) with contained inflation and rates falling slowly. Within this frame, much of the consensus focuses primarily on tech megacaps and their quarterly results. Our note on the soft landing explains the idea in plain terms.
This focus leaves an essential point in the shadows: how the rest of the market absorbs this durable rate regime. The analysis offered here diverges from consensus by treating the internal dynamics of the Russell 1000 — not just those of the headline indices — as a potential leading indicator of the actual health of the US equity cycle.
What the Russell 1000 Says About US Equity Risk Today
Over the trailing 12 months, the cap-weighted average performance of the Russell 1000 remains positive, but a widening gap between the top decile (the 10% largest capitalizations) and the rest of the index is observable. On a simple estimate: the top 100 capitalizations often explain ≈65–70% of total index capitalization; their outperformance is enough to mask softer performance in the lower part of the index.
This suggests that:
- Concentration risk is intensifying: a significant share of valuation depends on a limited number of companies.
- The market is pricing a relatively benign macro scenario for large groups, but a more uncertain one for mid caps exposed to domestic demand and financing costs.
- Sensitivity to the credit cycle is rising: companies in the lower part of the Russell 1000, more reliant on bank or high yield bond financing, are more vulnerable to prolonged tightening.
What Readers Really Want to Know
The real question is less about whether the Russell 1000 will rise or fall in the coming months, and more about whether US equity risk today is more concentrated or more diffuse. Behind that question lies a simple concern: does the current rally rest on a healthy base, or on a small number of stocks that have become unavoidable but more fragile in the event of a shock?
Concrete Indicators to Track on the Russell 1000
To avoid getting lost in details, a few simple indicators allow tracking the state of this US «market core.»
1. Intra-Index Performance Dispersion
Primary KPI: the gap between the average performance of the top 100 Russell 1000 capitalizations and that of the remaining 900 over 6 to 12 months.
- How is it measured? By comparing the trajectories of ETFs or sub-indices that replicate large versus mid-cap segments, or via dispersion statistics published by index providers.
- Possible reading: the wider the gap, the more the market relies on a narrow base of winners, which can make broad indices more sensitive to a sector or regulatory reversal.
2. Real Rate Levels and the Yield Curve
Real policy rates — nominal rates minus observed or expected inflation — remain a pivot for interpreting Russell 1000 valuations. Between 2023 and 2025, they moved from clearly negative territory to slightly positive levels, fundamentally altering the cost of capital for companies.
- To track: the spread between 10-year government bond yields and 10-year inflation expectations (a proxy for real rates), as well as the 2s10s slope.
- Why it matters: a gradual normalization of these rates can support reallocation toward more cyclical names and Russell 1000 mid caps, while a durable maintenance of high real rates tends to favor a narrower set of highly profitable companies.
3. Participation in the Rally
Another useful indicator is the share of Russell 1000 names trading above their 200-day moving average, or up on a rolling 12-month basis.
- Reading: if the number of names in uptrend declines while the overall index stays near its highs, the rally is likely held by a small group of names.
- Weak signal: a gradual improvement in this participation can signal a broadening rally, often unnoticed while the headline indices are already setting records.
Common Reading Errors on the Russell 1000
Confusing the Russell 1000 with a simple «extended S&P 500.» The weighting structure and the meaningful presence of mid caps make its dynamics sometimes very different. Treating it as an S&P 500 duplicate misses signals on market breadth.
Overinterpreting a one-off outperformance. A quarter of better Russell 1000 performance versus the S&P can simply reflect sector rotation or a technical rebound. The indicator gains reliability over 6–12 months, in connection with broad rate and credit trends.
Ignoring the cost-of-capital dimension. Reading the index purely through a «growth vs value» lens without integrating real rate moves and credit spreads leads to incomplete analysis. It is the aggregate financing cost of US corporates that fundamentally shapes the internal hierarchy of the Russell 1000.
Considerations for Allocation and Management Decisions
The broader reference frame on the mechanisms of financial markets reminds that an index is not a verdict, but a sophisticated thermometer of risk perception. The Russell 1000 illuminates a specific zone: the part of the US market that combines dominant large caps and a broad spectrum of mid caps.
3 Concrete Reference Points for Investors
- Observational allocation framework: across diversified equity portfolios, allocations of approximately 60% global large caps, 30% broader US exposure such as Russell 1000 or equivalent, and 10% specialized segments have historically been observed as anchor points adjusted to constraints and objectives.
- Concentration monitoring: regularly tracking the top 10 names’ share of Russell 1000 capitalization. A prolonged rise in that share has historically suggested heightened concentration risk.
- Reading market phases: a gradual broadening of performance toward Russell 1000 mid caps has historically signaled a more constructive and robust market phase than a rally carried only by a few giants.
Implications for Companies and Decision-Makers
For US mid-sized companies, their place in the Russell 1000 can influence the cost and availability of capital: inclusion, weight in the index and sector perception affect equity demand and issuance conditions. For executives and CFOs, monitoring the relative dynamics of their segment within the index helps anticipate cost of capital and investor expectations.
For households and professionals managing wealth, the focus is less about anticipating each index move and more about understanding when the market becomes too dependent on a small number of stories — and when, conversely, gains diffuse across a broader set of companies.
Possible Scenarios Around the Russell 1000
Scenario 1 – Soft Normalization and Broadening Rally
If global growth holds around 2–3% in real terms in 2026 and inflation stays close to central bank targets, a gradual but limited rate-cutting cycle could begin. In this scenario, the cost of capital eases without returning to free-money territory, which could favor a reconvergence between megacaps and the rest of the Russell 1000. Directly related: Comparing US equities and international equities across regimes.
The market does not fully price this possibility, given that part of the flows remains concentrated on segments perceived as «guaranteed quality.» A broadening of performance could surprise to the upside.
Scenario 2 – Durably High Rates and a Two-Speed Market
If inflation proves more persistent, pushing central banks to keep real rates higher for longer, the risk of a durably polarized market increases. Companies in the lower part of the Russell 1000, more leveraged or more cyclical, could suffer more, while highly profitable large names continue to concentrate the bulk of flows.
In that case, internal dispersion within the Russell 1000 would widen further, reinforcing the sensitivity of broad indices to a targeted shock on a few leaders (regulation, taxation, technological disruption, etc.).
Scenario 3 – Macro or Credit Shock and Brutal Re-pricing
A more marked reversal — growth shock, credit crisis, major geopolitical event — could trigger a broad correction in the Russell 1000, with simultaneous declines in large and mid caps. In such an episode, the key question would be how quickly policy rates and the cost of capital adjust to stabilize the system.
This is not the central scenario embedded in most current projections, but it remains a risk that is not fully integrated in current valuations. Credit spreads and the shape of the yield curve would then be the priority indicators to watch.
Counter-Arguments and What Could Invalidate This Reading
Several factors could limit the reach of signals given by the Russell 1000. A faster rate-cutting cycle than currently anticipated could, for instance, simultaneously support megacaps and mid caps, making dispersion analysis less discriminating. Likewise, a durable AI-driven productivity shock across a broad range of sectors could redistribute the cards within the index in ways hard to read through historical patterns.
Finally, the role of passive flows and index products themselves should not be underestimated: a massive reallocation toward thematic or sector strategies could modulate the Russell 1000’s role as an aggregate barometer.
Final Perspective
The Russell 1000 does not say whether US equities are «cheap» or «expensive» in absolute terms. It mainly illuminates how risk is distributed inside the US market, between structural leaders and more cyclical or credit-sensitive companies. In an environment where positive real rates and monetary policy remain decisive parameters, the index becomes a useful tool for assessing the robustness of a rally or the fragility of a correction.
For investors, companies and households following markets, the essential is less to guess the next high than to understand where risk is concentrated, and how that risk is shifting. The market is starting to integrate, in touches, the idea that megacaps cannot indefinitely carry performance alone. This gradual integration intersects another angle examined in our study on AI and structural risk for financial stability. The Russell 1000 offers a privileged window onto this gradual shift.
To follow this type of signal within a broader macro frame (growth, inflation, monetary policy, geopolitical risk), the weekly macroeconomic bulletin provides a regular roadmap.
Reader Questions
- Is the Russell 1000 less risky than the Russell 2000?
Generally yes, since it groups mainly large and mid caps, often more mature than Russell 2000 small caps. But its risk depends primarily on the macro context (rates, credit, growth) and on sector concentration at any given time. - Why can the Russell 1000 underperform the S&P 500?
When a few megacaps pull the S&P 500 sharply higher, the Russell 1000 can underperform if the rest of the market is less dynamic. This underperformance has historically signaled a narrow rally, resting on few names, rather than a broad and generalized rise. - How can the Russell 1000 inform US equity exposure decisions?
It can serve as a reference for measuring the participation of mid caps in the rally. An improvement in that participation has historically been associated with broader market phases, while extreme polarization has historically called for closer monitoring of concentration risk. - Is the Russell 1000 suited to a long-term horizon?
Over long periods, it offers broad exposure to the fabric of US large and mid-sized companies. Its primary interest lies in this extensive coverage, with the standard caveat that past results do not predict future performance and that rate and credit cycles regularly reshape the internal hierarchy.
3 takeaways
- The Russell 1000 covers most of the US equity market and reveals the actual breadth of the rally, beyond S&P 500 megacaps.
- Performance dispersion, top-10 concentration and real rates are three keys to reading risk distribution within the Russell 1000.
- The market does not fully price the risk of a too-narrow rally: the Russell 1000 helps detect when gains are diffusing or, on the contrary, becoming fragile.
Last updated — 12 July 2026
Disclaimer – Financial Information: The analyses, commentary, and content published on eco3min.fr are provided for informational and educational purposes only. They do not constitute investment advice or a solicitation to buy or sell financial instruments. Past performance is not indicative of future results. All investment decisions involve risk and are the sole responsibility of the reader.
Read next
Full pillar →Euro Below Parity in 2022: What Parity Means
In September 2022, the euro fell below parity with the dollar, to around 0.95, a low not seen…
Eurozone Fragmentation: Sovereign Spreads and the Euro
The euro is issued by a monetary union without a complete fiscal union: nineteen sovereign debts coexist under…
The Euro’s Energy Import Bill: the Gas Shock and the Currency
In 2022, the surge in gas prices turned the euro area's historic current-account surplus into a deficit and…