
Topic
Global Liquidity
The Fed’s balance sheet is not market liquidity, even though the two are often treated as one. The liquidity that carries asset prices also depends on the Treasury General Account, reverse repo and bank reserves; it tracks equities in levels but barely in weekly changes. The Fed balance sheet since 2002, net liquidity since 2003, M2-to-GDP since 1959 and ECB datasets help separate the real effect from the narrative.
Where to start
Three reads, in order: the basics, the full mechanism, then what the data says.
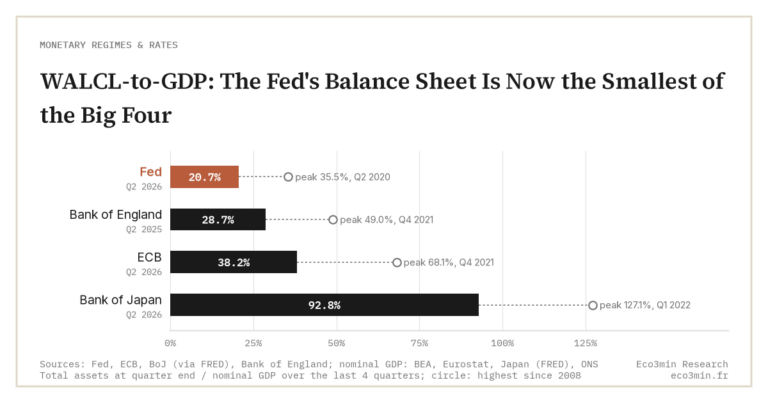 01The basics WALCL-to-GDP: The Fed’s Balance Sheet Is Now the Smallest of the Big Four Measured against GDP, the Fed's balance sheet stood at 20.7% in the second quarter of 2026, against 28.7% for the Bank of England, 38.2% for the ECB and 92.8% for the BoJ. AnalysisRead →
 02The full mechanism WALCL: Fed Balance Sheet, Monetary Signal and Systemic Liquidity Indicator WALCL (FRED) measures the Fed's total balance sheet. In-depth analysisRead →
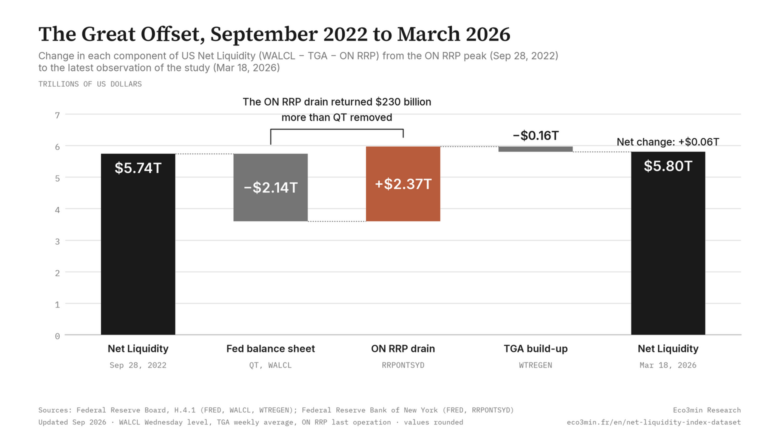 03The evidence The Liquidity Illusion: Why the Fed’s Balance Sheet Is Not the Market’s Liquidity, and What Actually Is The Fed drained $2.14T via QT. The ON RRP returned $2.37T. StudyRead →
Research and data
Our in-depth research and the downloadable series on the subject.
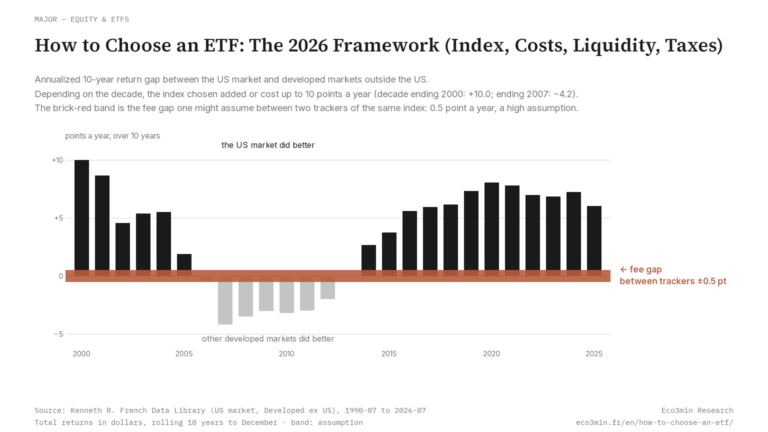 StudyHow to Choose an ETF: The 2026 Framework (Index, Costs, Liquidity, Taxes) StudyM2 and US Inflation, 1960–2026: A Three-Regime Empirical Test of the Monetarist Lag At the conventionally cited 15-month lag, M2 growth explains 4% of US inflation variance during the monetarist era and 7% from 1990 to 2019.
All analyses, by angle
Grouped by sub-topic rather than by date. Filter to get straight to the point.
Liquidity and Financial Conditions6
The sub-pillar →- CoreNet liquidity and US equities: a 0.84 correlation in levels, −0.03 in weekly changes, 2003–2026 US net liquidity and US equities correlate at 0.84 in levels since 2003 and at −0.03 in weekly changes. Sep 16, 2026
- CoreWhere the M2-to-GDP Ratio Stands: U.S. Percentiles Since 1959 US M2 equals 71.2% of annual GDP, down 21.9% from its 2020 peak and above every quarter recorded between 1959 and 2007. Sep 8, 2026
- CoreThe Federal Reserve’s Balance Sheet (2002–2026): Three Episodes That Required New Operational Tools Complete weekly Fed balance sheet (WALCL) dataset, 2002–2026, with phase classification and three episodes that required tools not in the pre-2008 FRBNY toolkit. May 12, 2026
- CoreUS Debt Ceiling: How TGA Drawdowns Inject Trillions in Liquidity Weekly Treasury General Account data with quantified drawdowns for every debt ceiling episode since 2011: methodology, regime classification and QE comparison. May 8, 2026
- CoreFed ON RRP Drain and Quantitative Tightening Offset (2013–2026) Between 2022 and 2026, $2.55 trillion drained from the Fed's reverse repo facility, closely tracking the $2.26T in simultaneous QT (correlation: 0.96). Apr 18, 2026
- WALCL: Meaning of the Fed Balance Sheet, FRED Calculation, Assets and Liabilities What does WALCL actually measure? Decoding the FRED ticker: asset side, H.4.1 scope, weekly frequency, common reading errors. May 19, 2026
Inflation Explained3
The sub-pillar →- The Cantillon Effect: Who Benefits First From Money Creation The Cantillon effect explained: how new money never reaches the economy uniformly, why first recipients capture real value, and what QE 2009-2021 revealed. May 1, 2026
- Net Liquidity Index: Weekly CSV Download (WALCL minus TGA minus RRP) US net liquidity index, weekly since 2003: Fed total assets (WALCL) minus the Treasury General Account and ON RRP. Mar 17, 2026
- M2SL: US Money Supply M2 Monthly Data from FRED (1959–2026) M2SL monthly US M2 money supply from FRED since January 1959: more than 60 years of broad-money data with pre-calculated YoY growth. Mar 17, 2026
Other angles16
- CoreCrypto Cycles: Why Their Amplitude Dwarfs Equity Swings Leverage, programmed supply and global liquidity explain why crypto cycles run far more extreme than equity cycles. Jul 19, 2026
- CoreETF Liquidity and Credit: Understanding Where Hidden Fragilities Emerge ETFs look simple, liquid and transparent, and in normal conditions they are. Jul 8, 2026
- CoreArtificial Intelligence ETFs: The Risks Investors Tend to Overlook Artificial intelligence ETFs draw heavy flows but conceal concentration, real-rate and volatility risks that often remain underestimated by investors. Jun 8, 2026
- Gold to M2 Money Supply Ratio: Gold Price Divided by US Money Stock, Monthly Since 1960 Gold to M2 money supply ratio: the gold price divided by US M2, monthly since 1960. Sep 10, 2026
- Effective Fed Funds vs Target Rate Corridor: The IORB / ON RRP Band Mechanics and FOMC FOMC target band, IORB ceiling, ON RRP floor: how the system keeps the effective Fed Funds within the announced range. May 19, 2026
- Japan’s Deflation: 30 Years in the Liquidity Trap From 1.4% inflation in 1991 to roughly 0% averaged across 1995-2020, Japan ran the longest deflationary regime of any advanced economy, and the most… May 1, 2026
- Beyond ETFs: What Passive Investing Really Changes in Financial Markets From replication mechanics to concentration risk, understand how passive investing reshapes price formation, liquidity, and correlations in financial markets. Mar 30, 2026
- What Is Liquidity and Why It Drives Financial Markets Understand what liquidity really means, from market trading to central bank balance sheets, and why it is the key driver of financial market trends. Mar 30, 2026
- Euro Area M3 Money Supply: Monthly Data Since 1980 Euro area M3 monetary aggregate, outstanding amounts, seasonally adjusted, monthly since January 1980 from the ECB Data Portal (BSI). Mar 24, 2026
- Euro Area M3 Growth Rate: Monthly Year-on-Year Data Since 1981 Euro area M3 annual growth rate, index of notional stocks, seasonally adjusted, monthly since January 1981 from the ECB Data Portal (BSI). Mar 24, 2026
- ECB Eurosystem Total Assets: Balance Sheet Dataset (1999–2026) Download ECB balance sheet data (Eurosystem total assets). Mar 23, 2026
- M2 Growth Rate: Monthly CSV Download (Money Supply YoY Change, Since 1960) US M2 money supply growth, year over year, monthly since 1960, computed from the Federal Reserve H.6 series M2SL. Mar 22, 2026
- TOTRESNS: US Bank Reserves at the Federal Reserve, Monthly Data (1959-2026) TOTRESNS monthly US bank reserves held at the Federal Reserve, from FRED, with data since 1959. Mar 22, 2026
- M2 to GDP Ratio: US Money Supply as Share of GDP Quarterly Since 1959 M2 to GDP Ratio quarterly: US broad money supply (M2SL) divided by nominal GDP. Mar 22, 2026
- Fed Balance Sheet to GDP Ratio: US Central Bank Assets as Share of GDP Quarterly Since 2003 Fed Balance Sheet to GDP Ratio quarterly: WALCL divided by US nominal GDP. Mar 22, 2026
- RRPONTSYD: Overnight Reverse Repo Facility Daily Take-Up Data Since 2003 (FRED) RRPONTSYD daily Overnight Reverse Repo Facility take-up from FRED since 2003. Mar 17, 2026
Quick reads
Comparisons and common misconceptions: the essentials in a few minutes.
Related topics
The subjects that most often intersect with this topic in our analyses.