Crypto Seasonality: Why the Signal Is Weaker Than It Looks

Crypto’s cyclical regularities, monthly seasonality or the four-year cycle, rest on a very small number of observations. That scarcity of data undermines their predictive reach far more than a convincing chart suggests.
Telling a flattering backward-looking pattern from a signal usable in advance is the crux. On samples this thin, the line blurs fast, and the story overtakes the evidence.
Crypto cyclical patterns, seasonality and the “halving cycle,” rest on too few observations to be reliable signals. Survivorship bias and data-mining explain most of their apparent regularity.
- Bitcoin has been through only three complete halvings (2012, 2016, 2020) and a handful of traded years: too small a sample to establish a law.
- Survivorship bias keeps only the regularities that “worked,” quietly dropping those that failed.
- Each cycle unfolded in a different macro regime (rates, liquidity, the 2024 arrival of ETFs), which confounds the pattern with its real causes.
“Uptober,” the year-end rally, the summer lull, the four-year cycle keyed to the halving: crypto is rich in regularities marketed as dependable. Each rests on a persuasive chart and a tidy story. The trouble lies in what the chart leaves out: the number of observations. Bitcoin has been through only three complete halvings, a handful of traded autumns, a single major monetary-tightening cycle in the ETF era. On samples this thin, almost any pattern eventually surfaces, and survivorship bias finishes the job by keeping only the regularities that “worked.” The point that follows is not to deny that markets have seasons; it is to test how well those seasons hold up statistically. The distinction matters for anyone tempted to mistake a flattering backward-looking pattern for a signal usable in advance. It sits within a wider effort to understanding crypto cycles, of which the mechanics of amplitude form the base.
A convincing chart, too few points
Every cyclical regularity starts with a strong image. A curve that climbs each autumn, a peak that trails each halving by a few months, a summer lull that keeps returning: the eye spots the pattern, the mind invents a cause for it. Conviction is born of the drawing before any reasoning.
The human brain excels at spotting shapes, including where there are none. That reflex, precious for survival, turns misleading against noisy financial series: it recasts a run of chance as a coherent story. Crypto seasonality leans on this bent, offering a clean narrative where the data offer only noise.
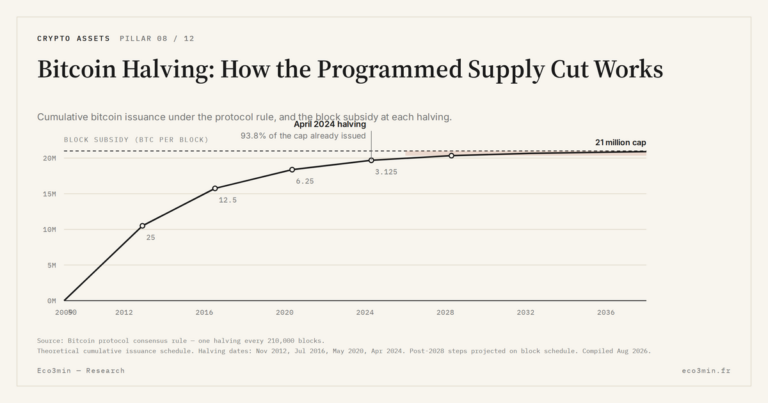
What the drawing hides is its own raw material. Bitcoin has traded for barely fifteen years. Three complete halvings occurred, in 2012, 2016 and 2020, with the fourth in April 2024 opening a cycle still unfinished. Monthly seasonality offers only about a dozen repetitions per calendar month. None of these counts reaches the threshold where a regularity stops being a coincidence and becomes an established fact.
Statistics is unforgiving here. With three or four points, you can always draw a trend; you never demonstrate a law. The band of uncertainty around a regularity measured on so few cases is wide enough to contain both the pattern and its opposite. Three halvings do not make a law. They make an anecdote repeated three times, which is not the same thing.
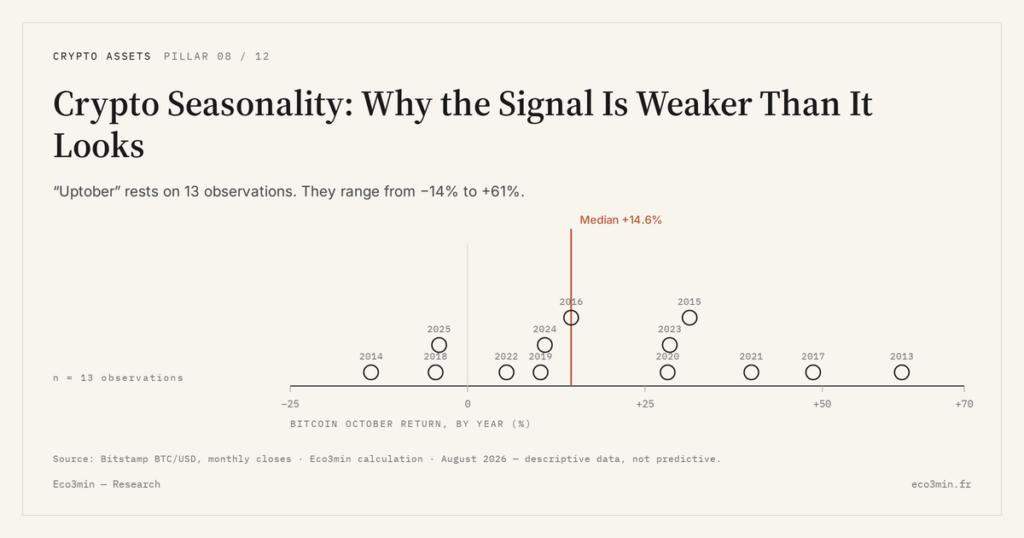
Take “Uptober,” the bullish reputation pinned on the month of October. It rests on about a dozen traded Octobers, several of them down months. Two or three striking gains are enough to create a flattering average and a legend. The average hides the dispersion; the legend hides the average.
These stories also endure because they are convenient. A simple rule states itself in one sentence and sticks without effort; the statistical caveat, by contrast, demands reservations, intervals, “ifs.” In the competition of ideas, the punchy formula often beats the accurate one, and the legend beats the measure.
The nuance looks subtle, it is fundamental. Describing what happened costs nothing: the data are there, the curve draws itself. Predicting what will happen makes a wholly different promise, that of a regularity stable enough to survive conditions never seen before. The first is an observation, the second a bet.
The chart, in that sense, is not evidence; it is the question. It shows what happened, then quietly invites you to assume it will happen again.
The statistical traps of small samples
The first trap has a name: survivorship bias. The seasonality stories you hear are the ones that worked recently. The ones that failed are not told, they vanish from the debate. The surviving pattern therefore looks far more reliable than it is, because the failed attempts are never counted.
The second trap is data-mining. Test twelve months, several weekdays, a few assets, a handful of indicators, and you will mechanically obtain “regularities” that look statistically remarkable, by chance alone. Multiplying comparisons guarantees finding coincidences; presenting them afterward as a signal is reconstruction after the fact.
The arithmetic is unforgiving. Test twenty rules at the usual 5 % threshold and you expect one to “succeed” by pure chance, even if none has any basis. The crypto market, with its hundreds of assets and countless time slices, is an ideal ground for this fishing for coincidences.
Add a regression-to-the-mean effect. After an extreme drop, a rebound becomes likely for purely statistical reasons, independent of any calendar. A pattern that announces “a rise after a trough” often merely redescribes that ordinary mechanic in cyclical dress.
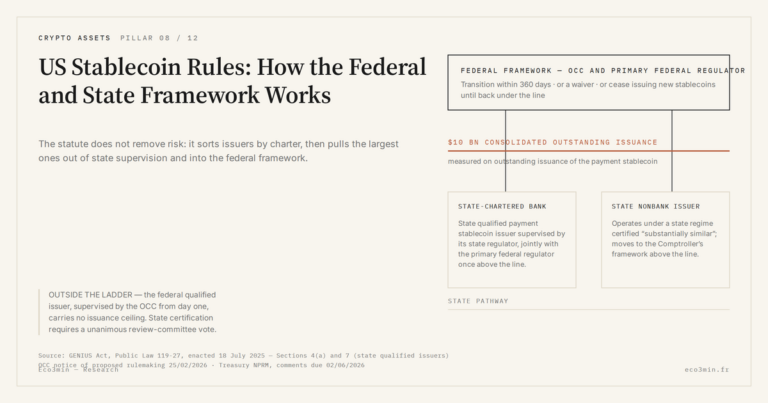
The third comes from the absence of out-of-sample testing. A pattern fitted on the past always describes that past perfectly: that is a tautology, not a prediction. Its only honest test would be to hold on data it was not built from, which crypto cyclical patterns have, for the most part, never had the chance to face. The “halving cycle” is the emblematic case: its supply mechanics, described by the halving schedule, are a fact; its ability to predict prices is an untested inference.
Overfitting lurks the moment a pattern carries several free parameters. Choosing the right window, the right lag, the right threshold amounts to cutting the key after seeing the lock. The result fits the past perfectly and falls apart on the first new data point, having never captured anything but fitted noise.
Worse, the three cycles are not even independent. Each inherits the participants, narratives and positions of the previous one; belief in the “cycle” shapes behavior, which in turn seems to validate the cycle. That loop, as long as it lasts, does not prove a law: it proves that many people believe it at once.
The problem runs deeper than deliberate cherry-picking. Even an honest observer, choosing in good faith which window to look at and which asset to include, walks a garden of forking paths where some route eventually lands on an impressive result. No bad faith is needed; the sheer number of reasonable choices does the work.
These three flaws compound rather than offset. A tiny sample makes each coincidence more visible; data-mining manufactures them at will; survivorship bias keeps only the most flattering; and the absence of out-of-sample testing forbids telling them apart. The result is not a weak signal, it is an absent one dressed as a certainty.
Each cycle in a different regime
A final difficulty disarms the pattern for good: the cycles being compared are not comparable. The 2012 halving happened on a tiny, confidential market. The 2016 one preceded a retail speculative wave. The 2020 one coincided with an unprecedented global monetary expansion. The 2024 one sat in a partly institutionalized market, open to listed exchange-traded funds. Four events, four worlds.
The consequence is an attribution problem that so few cases cannot solve. What drove prices up after 2020 was first a tide of liquidity, not the issuance cut that occurred at the same moment. To credit the rise to the halving is to confuse the clock with the cause. The pattern in fact captures the macro regime of each era, rates and liquidity foremost, and relabels it the “halving cycle.”
One tell gives the pattern away: the size of the gains that followed each halving has shrunk from one cycle to the next, as the market grew. A genuine mechanical law would produce a stable effect; a regime artifact erodes when the context changes. The instability of the pattern is, in itself, a confession.
The numbers bear it out. The 2020-2021 surge accompanied the swelling of the Federal Reserve balance sheet and the collapse of real rates; the 2022 reversal followed monetary tightening, not any calendar signal. The presumed “cycle” aligns far better with global liquidity than with the halving date.
The 2024 arrival of listed exchange-traded funds shows how fragile the frame is. It introduced a category of buyers and a flow channel absent from the three previous cycles. A pattern fitted to the old regime has no mechanical reason to survive that change in structure; testing it on the future will amount to testing it for the first time.
The distinction separates two registers. A concrete, dated change, such as a concrete supply inflection, can shift a dynamic in a verifiable way. A backward-looking pattern fitted on three heterogeneous cycles cannot: it describes a story, it announces nothing.
Faced with the future, the pattern has shown its limits. The amplitude of the 2020-2022 cycle broke with its predecessors, and the depth of the decline tracked the monetary calendar far more than the protocol’s. A pattern that must be reinterpreted every cycle is no longer a rule: it is a flexible grid adjusted after the fact.
What a real test would require
Seriously testing a cyclical pattern takes four conditions rarely met in crypto. Enough independent observations, first, which three or four cycles do not provide. Out-of-sample validation, next, on data not used to build the pattern. A control for the macro regime, too, to separate the calendar’s own effect from liquidity’s. And a hypothesis fixed in advance, finally, rather than forged after digging through the data.
None of this forbids observing the patterns; it invites treating them for what they are. A seasonality chart is a starting point for inquiry, not a conclusion. The useful question is not what the pattern “says,” but how many times it has been wrong, and whether anyone counted.
None of these requirements is out of reach; they are simply absent from most seasonality stories. The pattern is asserted there, never tested. Rigor does not mean rejecting every cycle on principle, but demanding of it the same proof required of any empirical claim.
Reading a chart where three peaks follow three halvings and concluding a causal link. The error: three aligned coincidences cannot separate causation from chance on so small a sample. The corrected reading treats these alignments as leads to test, never as an established rule.
This is why a pattern that impresses on a chart deserves suspicion in proportion to how neatly it fits. Real relationships in noisy data are usually messy, partial, hedged. A regularity that looks too clean on fifteen years of a young market is, more often than not, telling you about the sample rather than about the world.
Caution is not scepticism on principle. It means granting a pattern the confidence its sample deserves, no more and no less. Three cycles license a working hypothesis, not a conviction. The whole difference fits in one word: tested.
Market seasons may well exist; crypto has simply not lived long enough to know. Until then, a seasonality chart remains a hypothesis dressed as a certainty. Telling it from a signal means refusing to take the repetition of a story for the proof of a law.
Last updated — 3 August 2026
Disclaimer – Financial Information: The analyses, commentary, and content published on eco3min.fr are provided for informational and educational purposes only. They do not constitute investment advice or a solicitation to buy or sell financial instruments. Past performance is not indicative of future results. All investment decisions involve risk and are the sole responsibility of the reader.
Read next
Full pillar →Bitcoin Halving: How the Programmed Supply Cut Works
The halving writes bitcoin’s scarcity into an immutable rule, applied without exception since 2012. It shapes the pace…
Bitcoin Cycle: A Quiet Inflection the Market Is Still Ignoring
A quiet on-chain indicator points to a different Bitcoin market regime, with material implications for allocation framing and…
Bitcoin ETFs: The Quiet Shift Reshaping the Crypto Market
Bitcoin ETFs: how the rapid arrival of listed vehicles is reshaping liquidity, flows and risk management for investors.…