Crypto Cycles: Why Their Amplitude Dwarfs Equity Swings

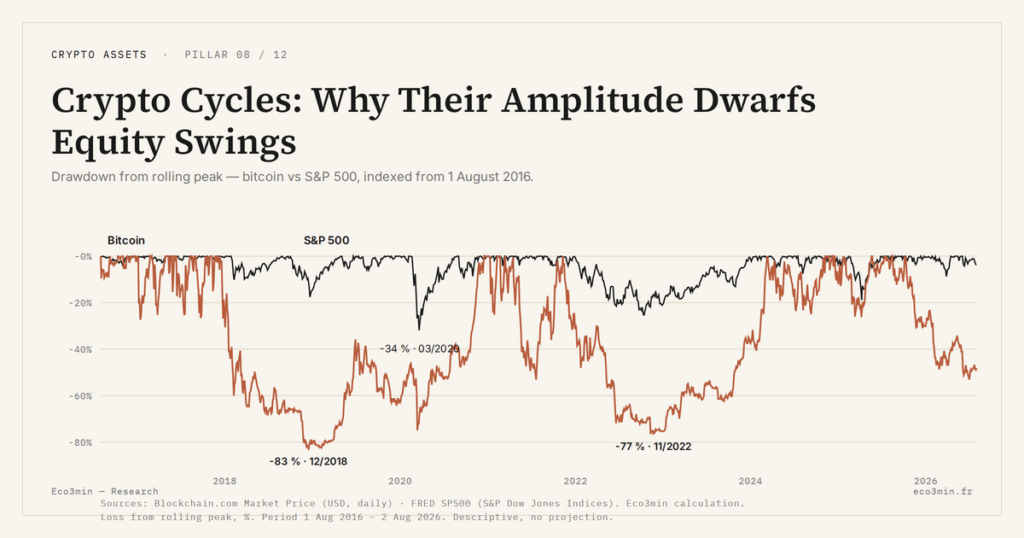
Crypto cycles post drawdowns two to four times deeper than equity markets. The asymmetry stems from market microstructure, not from a speculative temperament peculiar to the sector.
Three mechanics stack to explain it: pervasive leverage, a programmed supply with no adjustment valve, and global liquidity with no institutional shock absorber.
Crypto cycle amplitude comes from market structure, not irrationality: capital flows through a pipe that is narrower and less buffered than the one equities use.
- The 2021–2022 cycle erased roughly 77 % of bitcoin’s price (a November 2021 peak near 69,000 dollars, a November 2022 trough), against about 25 % for the S&P 500 across 2022.
- The Bitcoin protocol caps supply at 21 million units and halves the block reward roughly every four years (6.25 to 3.125 bitcoin in April 2024): no fresh issuance absorbs a demand shock.
- Crypto markets trade around the clock, often with heavy leverage: an ordinary price move triggers cascades of forced liquidations with no counterpart in regulated equity markets.
A 20 % equity drawdown makes headlines. An 80 % crypto drawdown is a statistical formality. That gap in amplitude is no accident of temperament: it stacks from three mechanics. Leverage first, pervasive across venues that trade continuously with thin collateral, turns ordinary moves into liquidation cascades. Programmed supply next strips the market of the adjustment valve that share issuance provides. Global liquidity last floods or drains these assets with no institutional shock absorber. The common reading pins the swings on speculation alone, or on a young industry still finding its feet. The angle here shifts the focus to structure. This framework sets out the mechanics; each part then points to its own treatment, starting with crypto cycles and volatility, structurally at the sub-pillar level.
An amplitude gap, measured before it is explained
Start with the fact, before the interpretation. Between its December 2017 peak near 19,800 dollars and its December 2018 trough around 3,200 dollars, bitcoin lost close to 84 % of its value. The next cycle replayed the same score: a peak near 69,000 dollars in November 2021, a trough close to 15,500 dollars a year later, a decline of roughly 77 %. Two cycles, two erasures of more than three quarters of the price. Nor is this new: the 2013–2015 cycle had already wiped out close to 85 %, from a late-2013 peak above 1,100 dollars to an early-2015 trough under 200 dollars. Three cycles, one order of magnitude.
Set those numbers beside equities. Across 2022, a year of abrupt monetary tightening, the S&P 500 shed about 25 % from peak to trough. During the 2007–2009 financial crisis, the reference episode for a generation of investors, the US index fell roughly 57 % between October 2007 and March 2009. Put plainly: the worst equity drawdown in a generation stays milder than an ordinary crypto correction.
The starkest episode fits into a single day. On 12 March 2020, at the height of the pandemic shock, bitcoin lost close to half its value in twenty-four hours, sliding from around 8,000 to under 4,000 dollars. On the same day, US equity markets tripped their circuit breakers repeatedly, halting trading once the S&P 500 fell 7 %. Two markets, one macro shock, two amplitudes an order of magnitude apart, and an immediate difference in handling: one stops, the other keeps falling.
Recent institutionalization does not erase the picture; it qualifies it. The arrival of US spot bitcoin exchange-traded funds, approved in early 2024, widened the buyer base and introduced steadier flows. The amplitude of moves may gradually compress as a result. Yet the three structural parts described below remain in place: the vehicle changes, the pipe stays narrow. Compression is not elimination, and the drivers that make crypto swing wider than equities are mechanical, not sentimental.
An arithmetic property adds to the bill. The deeper the fall, the more disproportionate the rebound needed to get back to the starting point: erasing 80 % then requires a fivefold gain, whereas a 25 % decline is undone by a one-third rise. Amplitude does not merely dig deeper, it lengthens the road back.
A word on the measurement itself. Comparing bitcoin, a single asset, with a diversified equity index understates the gap further: an index absorbs the dispersion of its components by construction. At the level of individual tokens, beyond bitcoin, erasures of 90 % or more within a cycle are the norm, not the exception. The fact is stubborn. What remains is to locate the gap. The tempting answer invokes participant psychology: retail-dominated venues, an immature sector, unchecked speculation. That reading is not wrong; it is incomplete. It explains the noise, not the amplitude. Crypto is not more irrational; its pipe is narrower and less buffered. Capital moves through a conduit that is less wide, less regulated, less cushioned, and it is that geometry which magnifies every impulse. What follows describes the pipe, part by part, and the amplitude gap with equities then reads as a property of structure, not of temperament.
Leverage: continuous markets, thinly buffered
First part, the most immediate: leverage. Crypto markets never close. No closing bell, no weekend, no institutional circuit breaker. On centralized venues, a large share of volume runs through perpetual futures, often at high multiples on thin margin. In that setting, a moderate price move suffices to push thousands of positions past their liquidation threshold.
This leverage builds quietly. In euphoria, the funding rate on perpetuals, the price paid to hold a long position, drifts higher: the market will pay dearly to stay exposed to the upside. Open interest swells alongside. None of it shows up in price while the trend holds. Then the mechanism reverses. A decline triggers forced liquidations; those liquidations sell into the market; that selling deepens the decline; the decline triggers fresh liquidations. The cascade feeds on itself. During the sharpest breaks, aggregated venue data recorded several billion dollars of positions liquidated within twenty-four hours, the May 2022 collapse of the Terra ecosystem offering one of the best-documented cases.
Decentralized finance adds a layer of automation. On lending protocols, an under-collateralized position is liquidated by code, with no human discretion, the moment the price oracle crosses a threshold. Under stress, the simultaneous rush of these liquidations congests the network, spikes transaction fees, and can delay the very collateral top-up meant to save a position. The infrastructure itself turns procyclical.
The collateral itself can become a fault line. Much crypto leverage is posted in stablecoins, dollar proxies assumed to hold their peg. When that assumption cracks, as it did around the Terra episode, the value of the collateral and the value of the positions it backs fall together, and margin calls multiply on both sides at once. A shock absorber that wobbles in the same direction as the shock is no absorber at all.
Compare with equities. A regulated exchange runs circuit breakers: in the United States, limit up-limit down mechanisms halt a stock whose price moves too far too fast from a recent reference. Constraints on short selling during sharp declines add another brake. Those devices break the reflexive loop, force a pause, let buyers return. Crypto has no generalized equivalent. The market keeps trading, and so does the cascade. Where the stock absorbs the shock in steps, the token absorbs it in one stroke.
Market depth: an order book that empties under stress
One factor deepens the cascade further: the depth of the order book. In normal times, market makers post closely spaced bids and offers, absorbing flow without moving the price much. When volatility jumps, those same participants widen their spreads, cut their displayed size, or step away entirely. The book thins precisely when thickness would matter most.
Displayed liquidity therefore evaporates when the demand for liquidity peaks. A sell order that, in calm conditions, would barely have nudged the price can, under stress, sweep through several near-empty book levels. This evaporation is not unique to crypto, but it runs deeper here: fragmentation across dozens of venues, no market-making obligation, and makers that are often less capitalized than on regulated equity markets.
Venues try to contain the spiral with auto-deleveraging mechanisms, which forcibly close the riskiest positions once the insurance fund runs dry. The cure mirrors the disease: it purges leverage, but by accelerating sales at the worst moment. Stabilization comes through faster liquidation, not a pause.
Leverage does not create the underlying trend. It amplifies its speed and depth. Two markets facing the same demand shock will diverge in amplitude if one is heavily and continuously collateralized and the other is not. That is the first third of the explanation.
Programmed supply: the valve crypto lacks
Second part, less visible but decisive: supply. In an equity market, the supply of shares is not fixed. In euphoria, firms issue stock, listings multiply, capital raises soak up part of the demand. In drought, buybacks retire shares: according to S&P Dow Jones Indices, S&P 500 companies executed close to 900 billion dollars of them in 2022 alone. Supply breathes with the cycle. It works as a valve: it modulates pressure instead of letting it bear fully on price.
Bitcoin has no such valve. Its supply is written into the code: an absolute cap of 21 million units and a declining issuance on a fixed schedule. Every 210,000 blocks, about four years, the reward paid to miners is cut in half. It went from 50 to 25 bitcoin in 2012, from 25 to 12.5 in 2016, from 12.5 to 6.25 in 2020, then from 6.25 to 3.125 in April 2024. That schedule is superbly indifferent to the state of demand.
One nuance matters, to avoid over-reading the flow. More than 19 million bitcoin already circulate, above 90 % of the cap: fresh issuance is a marginal fraction of the existing stock. What counts is therefore not the volume issued but its inelasticity. Where a commodity’s price eventually calls forth a supply response, new mines, recycling, destocking, bitcoin’s supply stays deaf to the price signal. No extra quantity appears when demand flares; none disappears when it collapses.
The deepest contrast is not with equities but with money itself. A central bank adjusts the supply of money at will, expands it in crisis, tightens it in overheating: an active, steered valve. Bitcoin embodies the exact opposite, a supply rule indifferent to any conditions. This radical inelasticity is a design choice, not a flaw; but it carries a price, paid in amplitude.
The consequence is structural. The demand shock passes almost fully into price, for want of an adjusting variable on the supply side. A rigid supply against a volatile demand: the mechanical recipe for wider amplitude. The programmed supply mechanics deserve a closer look, since they are also the most often misread.
One caution here separates description from prediction. Noting that a rigid supply amplifies moves says nothing about their direction. Scarcity is programmed; the price path depends on a demand that no schedule fixes.
Global liquidity: an asset with no institutional shock absorber
Third part: global liquidity. Crypto assets behave like highly sensitive sensors of global financial conditions. When central banks add liquidity and real rates collapse, capital reaches for yield and extreme duration; crypto captures a share of it. When liquidity withdraws, the move reverses with the same force.
The channel runs through two macro variables analysts watch closely. Real rates first: a negative real yield lowers the opportunity cost of holding an asset with no income, which long favored bitcoin as it did gold. The dollar next: a strong greenback tightens global financial conditions and weighs on dollar-denominated risk assets. Over the recent cycle, crypto’s correlation with technology indices, the Nasdaq in particular, strengthened as institutional players entered the sector, a sign that these assets were increasingly treated as the riskiest end of the risk-on spectrum.
The 2020–2022 cycle illustrates it cleanly. The vast monetary expansion of 2020–2021, driven by the swelling of the Federal Reserve balance sheet, coincided with the surge in crypto valuations. The 2022 tightening, rate hikes and balance-sheet runoff, coincided with their collapse. Over that window, the correlation with global liquidity gauges proved tighter than with most sector-specific variables. Liquidity first, sector story second: that ordering is the premise of the liquidity-cycle reading of crypto-assets.
The dependence runs both ways, and that is what makes it violent. An abundant-liquidity regime draws in high-leverage participants, who amplify the rise; the same leverage, once liquidity withdraws, amplifies the fall. Macro fuel and micro leverage reinforce each other rather than cancel out. Amplitude is not the sum of two effects, it is their product.
The analogy with gold has limits, and they are instructive. Gold enjoys safe-haven status and a deep base of institutional buyers, central banks included, that cushion its declines. Bitcoin shares the supply inelasticity, but not yet that base of countercyclical buyers. Same macro channel, far thinner shock absorber.
The 2022 reset put the real-rate channel on full display. As US Treasury yields climbed and real yields, read through inflation-protected securities, swung back into clearly positive territory for the first time in years, the opportunity cost of holding a non-yielding asset rose sharply. Long-duration risk assets repriced hardest, and crypto, sitting at the far end of that spectrum, repriced hardest of all. The move was not sentiment turning; it was discount rates resetting.
What sets crypto apart here is not the sensitivity itself, shared by many risk assets. It is the absence of a shock absorber. A systemic equity market has, in the last resort, an institutional net: central-bank intervention, liquidity facilities, deposit insurance, implicit backstops on critical infrastructure. Crypto operates largely outside that perimeter. The November 2022 failure of the FTX exchange made the point bluntly: no deposit insurance, no lender of last resort stood ready to absorb the shock. The tide rises and falls with no seawall. Reading crypto cycles as a liquidity regime illuminates this dependence, as does the link between global liquidity and bitcoin.
What amplitude does not tell you: apparent regularities and small samples
Amplitude breeds a temptation: to read exploitable regularities into it. A four-year cycle keyed to the halving, “Uptober,” the year-end rally, summer lulls: seasonality narratives thrive on striking charts. The trouble is not in the chart, it is in the number of observations behind it. Three complete halvings, a handful of traded autumns, a single major monetary-tightening cycle in the era of listed exchange-traded products: on samples this thin, almost any pattern eventually surfaces, and survivorship bias finishes the job by keeping only the regularities that “worked.”
The distinction is methodological, and it is decisive. Describing a past amplitude is an observation. Inferring a signal usable in advance is a fragile statistical bet. That is precisely the line drawn by why these regularities are fragile, while a quiet supply inflection discussed elsewhere shows, by contrast, what a concrete change, rather than a backward-looking pattern, can shift in the dynamic.
An 80 % erasure is often read as proof of an irrational market, or one bound to disappear. That reading conflates amplitude with fragility: a deep drawdown signals a narrow, heavily collateralized pipe first, not a defect of intrinsic value. Amplitude measures the structure of the market; it does not judge the asset.
A reading frame: what amplitude makes observable
Because amplitude arises from structure, it leaves measurable traces. The funding rate on perpetual contracts and the level of open interest report on the leverage accumulated; high leverage precedes the deepest cascades. Realized volatility, set against the implied volatility priced into options, places the market between complacency and stress. Token reserves held on exchanges and the supply of available stablecoins give a rough gauge of the fuel on hand. Global liquidity proxies, from major central-bank balance sheets to aggregate financial conditions, frame the underlying tide.
Each gauge reads a different part of the pipe. Funding and open interest read the leverage layer. Realized and implied volatility read the stress already in the price. Exchange reserves and stablecoin supply read the dry powder available. Liquidity proxies read the tide. Taken singly, any one of them misleads; taken together, they sketch how loaded the structure is.
None of these gauges delivers an entry or exit signal; together, they describe the state of the pipe at a given moment. This is where macro and micro meet: the liquidity tide set by central banks determines the volume of capital available, while the leverage stacked on venues determines the violence with which that capital enters and exits. One sets the potential amplitude, the other the speed of its release.
A concrete example of cross-reading: a persistently high funding rate combined with open interest at a record signals stretched leverage, hence cascade potential; if global liquidity proxies contract at the same time, the terrain gathers its conditions for maximum amplitude. None of these observations says when or in which direction the move will come. They say only that, if it comes, it will be wide.
These markers do not forecast direction. They qualify the terrain. A heavily collateralized market, backed by a rigid supply, in a liquidity regime that is withdrawing, gathers the conditions for high amplitude, up as much as down. The direction of the move depends on a demand that escapes any mechanics.
The amplitude of crypto cycles is a property of market microstructure, not a measure of participant irrationality.
One frame, three parts, no fate in direction
The amplitude gap between crypto and equities stops being a mystery once it is traced to market plumbing: continuous leverage with no circuit breaker, programmed supply with no valve, global liquidity with no net. Three parts, one consequence: a narrow conduit that magnifies every impulse. This frame announces no price and schedules no turn. It offers a grid: when the three conditions tighten together, coming amplitude is likely to be high, whatever its direction. The rest, meaning the direction and the timing, stays the province of demand, the one variable that neither the code nor the structure fixes. Structure sets the size of the swing; demand chooses its sign.
Last updated — 15 September 2026
Disclaimer – Financial Information: The analyses, commentary, and content published on eco3min.fr are provided for informational and educational purposes only. They do not constitute investment advice or a solicitation to buy or sell financial instruments. Past performance is not indicative of future results. All investment decisions involve risk and are the sole responsibility of the reader.
Read next
Full pillar →Bitcoin Halving: How the Programmed Supply Cut Works
The halving writes bitcoin’s scarcity into an immutable rule, applied without exception since 2012. It shapes the pace…
Bitcoin Cycle: A Quiet Inflection the Market Is Still Ignoring
A quiet on-chain indicator points to a different Bitcoin market regime, with material implications for allocation framing and…
Bitcoin ETFs: The Quiet Shift Reshaping the Crypto Market
Bitcoin ETFs: how the rapid arrival of listed vehicles is reshaping liquidity, flows and risk management for investors.…