
Bitcoin and Liquidity Cycles: Real Rates, Macro Regimes, and Market Behavior
Bitcoin behaves as a macro-sensitive digital monetary asset whose valuation primarily depends on liquidity cycles, real interest rates, and risk appetite, not on blockchain technology or the “digital gold” narrative. Understanding Bitcoin means understanding its dependence on the macroeconomic regime.
On November 10, 2021, Bitcoin set the high of its cycle. The Fed’s balance sheet stood at $8.66 trillion and was still growing; it peaked at $8.97 trillion on April 13, 2022 (Federal Reserve, H.4.1). Taken from the weekly H.4.1 release on the Federal Reserve balance sheet. 10-year TIPS real yields were at -1.19% (Fed). US M2 had increased by 40% in 18 months (Federal Reserve, FRED). The Nasdaq 100 was at record highs. A year later, in November 2022, Bitcoin had lost most of its value. The Fed’s balance sheet had begun to contract (QT). 10-year TIPS real yields had moved from -1.19% to +1.72%. The Fed funds rate rose from 0.25% to 4.00%. The Nasdaq had fallen 33%. In March 2024, Bitcoin set a new all-time high. The Fed balance sheet was still contracting, but net liquidity (Fed balance sheet − Treasury General Account − reverse repo) had risen from $5.90 trillion on October 12, 2022 to $6.16 trillion on March 27, 2024, a gain of $261 billion (Federal Reserve, H.4.1). US spot Bitcoin ETFs, approved by the SEC in January 2024, had started drawing net inflows.
These figures are not coincidences: they reveal Bitcoin’s dominant driver: global liquidity and the cost of capital. For a deeper macro analysis, see Bitcoin and global liquidity. Bitcoin is an infinite-duration asset (no cash flow, entirely speculative valuation) → its sensitivity to real rates and liquidity is maximal. When liquidity expands and real rates are negative → Bitcoin rises. When liquidity contracts and real rates turn positive → Bitcoin falls. Everything else (halving, adoption, technology) is secondary to this dominant mechanism.
Bitcoin: a digital monetary asset, not a currency, not gold
Bitcoin only marginally fulfills the three classic monetary functions. Store of value: price swings several times wider than those of the S&P 500 or gold disqualify Bitcoin as a reliable short-term store of value. An asset that can lose a large share of its value within a few months is not a store of value in the classical sense. Medium of exchange: the Bitcoin base layer settles a limited number of transactions per block, far below the capacity of card networks, and its fees rise with network congestion. Unit of account: virtually nonexistent in the real economy, no meaningful pricing, salaries, or leases are denominated in BTC. Related coverage: our guide to frequent errors about Bitcoin and crypto.
Bitcoin behaves as a capped-supply digital monetary asset. Its programmed scarcity, a cap of 21 million units written into the protocol, is real and verifiable. But scarcity alone does not create value: it is a necessary condition (fixed supply) but not sufficient (demand determines price). Scarce cryptocurrencies without demand are worthless, and Bitcoin itself, under the same issuance rule, went through a deep slump in 2018 before reaching new highs in 2021: identical scarcity, vastly different prices.
The gold comparison is frequent but imperfect. Gold benefits from 5,000 years of institutional recognition, jewelry and industrial demand, a place in central bank reserves, and far lower volatility than Bitcoin. Bitcoin shares scarcity and censorship resistance, but its tendency to move with equity indices, visible in 2022 and 2023, makes it a risk-on asset, not a safe haven. Gold is counter-cyclical (negative equity correlation in stress); Bitcoin is pro-cyclical (positive equity correlation both ways). They are fundamentally different assets despite the “digital gold” narrative. The study of the link between programmed scarcity and value deconstructs this distinction.
Bitcoin and net liquidity: the dominant macro link
The correlation between Bitcoin and global liquidity (proxied by Fed net liquidity: total balance sheet − Treasury account − reverse repo) shows up in the direction of the major phases rather than in a single coefficient. Over 2020–2024, Bitcoin’s large rises and drawdowns came while this aggregate was expanding or contracting, as the sequence below documents. How this maps onto realised behaviour by regime is documented in the asset-by-regime grid, which records how Bitcoin and other classes moved under each configuration.
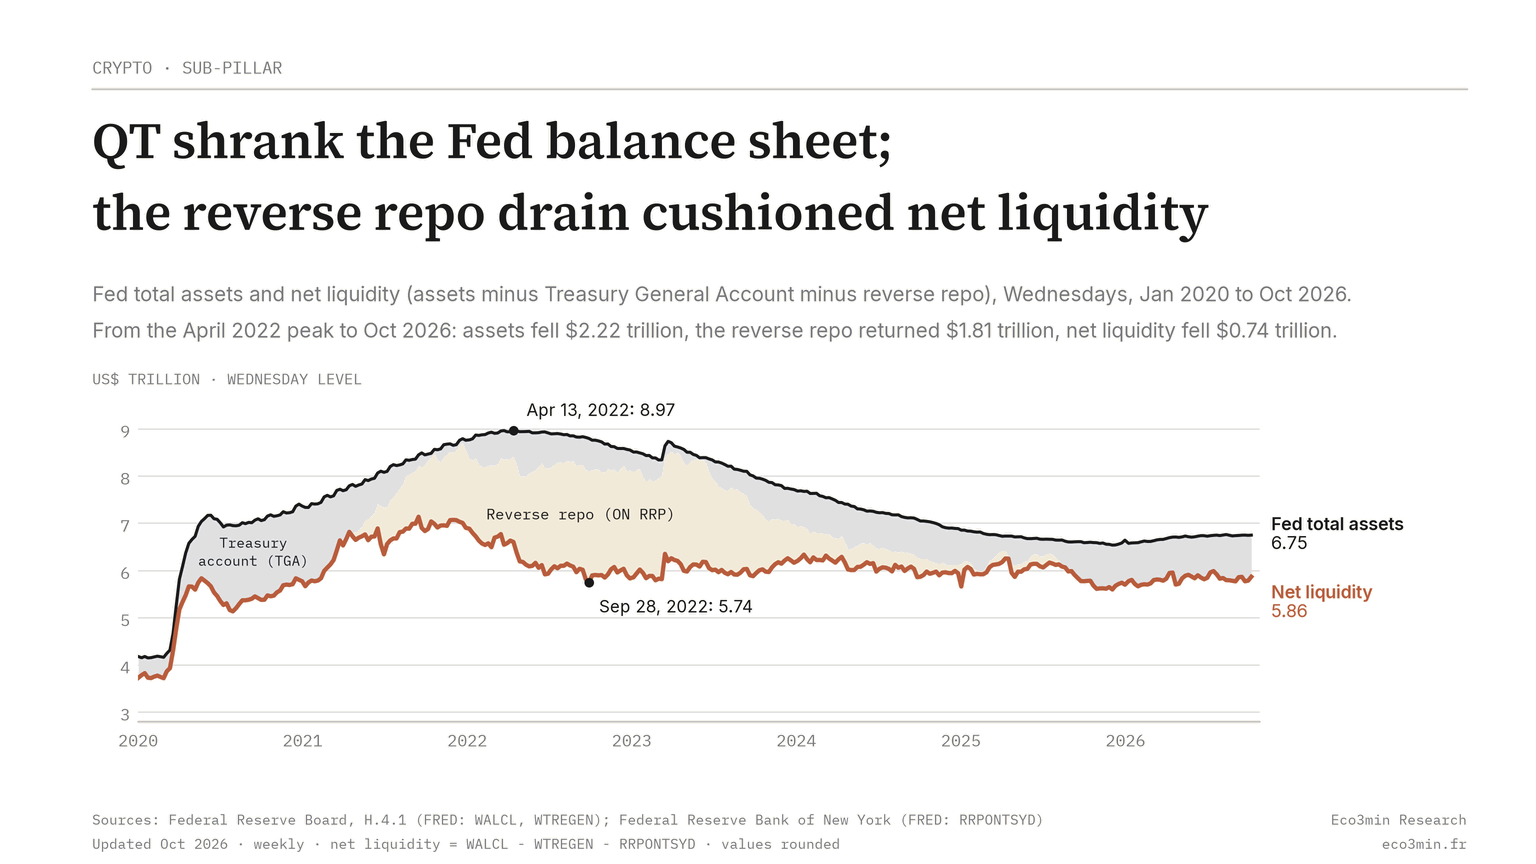
Documented sequence: March 2020 → Fed launches unlimited QE (March 23) → balance sheet expands from $4.2T to $7.2T in 3 months → Bitcoin rises steeply over the next nine months. January 2021 → $1.9T stimulus + ongoing QE → balance sheet reaches $8.965T (April 2022) → Bitcoin sets its cycle high (November 2021). June 2022 → Fed launches QT ($95B/month balance sheet runoff) + fastest rate hikes since 1980 (0% → 5.25% in 16 months) → Bitcoin reaches its cycle low (November 2022). October 2022 → net liquidity resumes rising (to March 27, 2024 the reverse repo releases $1,729 billion, but QT removes $1,274 billion and the Treasury account absorbs $194 billion, so net liquidity gains only $261 billion) → Bitcoin sets a new all-time high (March 2024). In the Fed’s H.4.1 data read on Wednesdays (Federal Reserve Board and Federal Reserve Bank of New York, via FRED), total assets fell from $8.97 trillion on April 13, 2022 to $6.75 trillion on October 7, 2026. Over the same span the reverse repo drain returned $1.81 trillion, so net liquidity fell by only $0.74 trillion, to $5.86 trillion, after a low of $5.74 trillion on September 28, 2022. The wider context: The case for bitcoin or Nasdaq.
The mechanism is that of an infinite-duration asset. Bitcoin generates no cash flows: its valuation rests entirely on expectations of future demand. Those expectations are directly affected by the discount rate. When real rates rise from -1% to +2.5% (as between 2021 and 2023), the present value of all future promises declines, a regime shift framed in the complete guide to inflation, and Bitcoin, whose “promise” is entirely future and non-cash-flow-backed, faces maximal impact. Bitcoin’s sensitivity to real policy rates is detailed in our dedicated analysis. The Liquidity & Financial Conditions sub-pillar provides the framework to interpret the net liquidity flows governing crypto-assets. A complementary angle: our analysis of crypto assets under monetary regimes.
The halving: supply mechanics, but the macro regime determines effectiveness
Roughly every four years (210,000 blocks), miners’ rewards are cut in half. Daily new BTC issuance drops from ~900 BTC/day before the April 2024 halving to ~450 BTC/day after. Set against daily spot trading volumes, this cut in new supply is small. The halving is a supply event whose mechanical price impact is arithmetically small.
Halving history: each of the first three halvings (November 2012, July 2016, May 2020) was followed, within 12 to 18 months, by a steep rise in price. The pattern is striking, but attributing gains solely to halvings is reductive. The 2016 halving coincided with 0.50% Fed funds and massive European/Japanese QE. The 2020 halving coincided with unlimited Fed QE, 0% rates, and the largest fiscal stimulus in US history ($5T in 2020–2021). The 2024 halving occurs under high rates (Fed funds 5.25–5.50%), positive real yields (+2.0–2.5% TIPS), and ongoing QT: a fundamentally different macro environment.
The halving is a necessary but insufficient condition. It reduces new supply, but price depends on demand, which depends on liquidity and the cost of capital. A halving under abundant liquidity and negative rates (2020) produces radically different outcomes from a halving under constrained liquidity and positive rates (2024). Programmed scarcity does not immunize against financial cycles: it alters their amplitude.
Spot Bitcoin ETFs: new inflows and a structural reconfiguration
SEC approval of 11 spot Bitcoin ETFs on January 10, 2024 marks the most important structural turning point in Bitcoin’s history. This integration subjects spot Bitcoin ETFs to the same conditional intermediation chain as other ETFs, analyzed in our study on hidden ETF liquidity risk. For the first time, institutional investors (pension funds, endowments, family offices, RIAs, registered investment advisors) can gain exposure through regulated vehicles in standard brokerage accounts without handling direct custody complexity.
The flows: in the first months, inflows went mostly to three new funds, IBIT (BlackRock), FBTC (Fidelity) and ARKB (Ark Invest). GBTC (Grayscale), converted from a closed-end trust to an ETF, recorded heavy outflows as holders exited positions long locked in at a discount. Inflows into the new funds more than offset them.
The price transmission mechanism is direct: spot ETFs hold physical Bitcoin. Each dollar of net inflow → BTC purchased on the market → buying pressure on a fixed-supply asset. Sustained net inflows meet a supply schedule that does not respond to price → upward pressure on the price. But institutionalization has a downside: in market stress, ETFs create a contagion channel between traditional finance and crypto markets. A hedge fund margin call → forced IBIT selling → physical BTC selling → on-chain liquidation cascade. The analysis of Bitcoin ETFs and liquidity risk explores these implications. The study on adoption and price increases formalizes the mechanical link between investor base expansion and valuation.
Reading Bitcoin cycle inflections: on-chain + macro
Bitcoin cycle analysis requires two overlapping lenses: on-chain indicators (protocol-native transparency) and macroeconomic indicators (which determine the regime).
On-chain indicators: the MVRV ratio (Market Value / Realized Value, market cap vs average acquisition cost of all BTC) signals overvaluation zones (high readings, historically associated with distribution phases) and undervaluation zones (a ratio below 1, when the market values the stock of bitcoin below what holders paid for it, historically associated with accumulation). Net Unrealized Profit/Loss (NUPL) measures holders’ latent profit/loss. Exchange flows (BTC moving in/out of exchanges) signal intent: outflows → accumulation (BTC moved to cold storage); inflows → distribution (BTC deposited for sale).
Macro overlay is what differentiates Eco3min analysis. On-chain indicators describe participant positioning: they do not predict the macro regime. An MVRV below 1 (on-chain undervaluation) combined with accelerated QT and rising rates (unfavorable regime) can remain depressed for months. The same MVRV combined with a Fed pivot (rate cuts begin) can trigger rapid repricing. The current cycle differs from prior ones through deeper institutionalization (spot ETFs), closer co-movement with equity indices, and heightened sensitivity to monetary policy, suggesting future cycles will align more with the global financial cycle than with halving schedules. The analysis of the current cycle identifies structural inflection drivers.
Dormant supply: the share of circulating bitcoin that has not moved on the blockchain for at least a year (Glassnode’s definition) is often read as a coiled spring, a reading its construction does not support. Any transfer resets a coin’s age, so the share falls when long-standing holders sell into a rally and climbs a year after a peak, as buyers from the top keep their coins. It is a twelve-month rear-view mirror: it describes who is holding, and says nothing about what the next buyers will pay. Three blind spots limit it. Lost coins stay dormant forever. A custodian moving its holdings to new addresses resets their age without any sale. And ETF shares can change hands all day while the underlying coins sit still, since only share creations and redemptions move them on-chain. Participants watch other measures more closely than theoretical supply: holder concentration, volume turnover and the ratio of transaction volume to market capitalisation. When that ratio contracts durably, a growing user base loses its power to explain prices.
2025–2026: rate cuts, a falling price and contracting liquidity
The cycle that followed the 2024 halving puts the liquidity reading to the test. Bitcoin peaked in October 2025 and fell sharply until the end of June 2026. Over the same stretch the Fed cut its target range from 4.25–4.50% to 3.50–3.75% between September and December 2025, and the ECB lowered its deposit rate from 3% to 2% over the year. The policy rate alone would have sent the wrong signal. Net liquidity did contract: in the Fed’s H.4.1 data, the balance sheet minus the Treasury General Account and reverse repos fell between late July and late October 2025, as the Treasury rebuilt its cash balance after the July 2025 debt-ceiling increase. A partial rebound in that aggregate in the first half of 2026 did not prevent the late-June low. One reading is that the lag between liquidity and price can stretch to several months.
ETF flows were the most visible channel. US spot funds recorded net outflows in November 2025 and heavy outflows in June 2026, before net inflows returned in August and September. Price is set on the coins that change hands, and nothing in the construction of dormant supply could have anticipated that sequence. By early October 2026 the monetary backdrop had turned again: the Fed raised the target range to 3.75–4.00%, effective September 17 (federal funds target range bounds, Fed via FRED), and the 10-year TIPS yield stood at 2.91% on October 6, 2026.
The record also carries an exception. In 2014 the Fed’s balance sheet still grew, from $4.02 trillion to $4.50 trillion, with only the pace of purchases slowing, while bitcoin slid from December 2013 in a decline compounded by the collapse of the Mt. Gox exchange. Liquidity is therefore not the only factor, and its link with Bitcoin holds over multi-month phases rather than day to day, when sentiment and crypto-specific flows dominate the tape.
Bitcoin as a barometer of global liquidity
Bitcoin has emerged as a leading indicator of global liquidity conditions: possibly the most sensitive in the financial system. Its volatility, often viewed as a flaw, is actually a feature: Bitcoin amplifies net liquidity moves. Across the phases traced above, its declines and rebounds were much wider than those of the S&P 500. It is an amplifier, and thus an early barometer of liquidity regime shifts.
This framework does not prejudge Bitcoin’s future: it encourages moving beyond simplistic narratives (“digital gold,” “money of the future,” “speculative bubble”) to understand the real mechanisms governing valuation. Bitcoin will not eliminate economic cycles, central banks, or financial risk. But it is a macroeconomic object of analysis in its own right: an asset whose behavior informs on the state of the global financial system much like credit spreads or the yield curve. Analytical competence is not about predicting Bitcoin’s price: it is about identifying the liquidity and real-rate regime in which it operates and drawing allocation implications. The empirical record is assembled in our register of systemic crises. A companion question: why Bitcoin has behaved as a liquidity play rather than digital gold.
The analysis of the current Bitcoin cycle identifies structural inflection signals. The Bitcoin ETF study examines liquidity and risk reconfiguration. The programmed scarcity analysis deconstructs the link between fixed supply and price formation. The real rates study formalizes Bitcoin’s sensitivity to the cost of capital.
← Back to pillar page Crypto-assets
Last updated — 20 October 2026
Disclaimer – Financial and Legal Information: The analyses, commentary, and content published on eco3min.fr are provided for informational and educational purposes only. They do not constitute investment advice or a solicitation to buy or sell financial instruments. Past performance is not indicative of future results. All investment decisions involve risk and are the sole responsibility of the reader. Data, charts and calculated series are provided as is and may contain errors or lag behind their source: check any figure against the primary source cited before relying on it. Content describing laws, regulations or contracts reflects the law as of its publication date and does not constitute legal or tax advice; applying it to a specific situation requires a qualified legal or tax professional.
Read next
Full pillar →Crypto Airdrops: Mechanisms, Dilution and Selection Risk
Crypto airdrops have shifted from free token distributions to dilutive financing tools. This analysis details the mechanisms, selection…
Crypto Assets and Monetary Regimes: A Macro-Financial Framework
Crypto assets do not live in a parallel universe detached from the global financial system. Their valuation is…
Ethereum, Stablecoins and Digital Dollarization: Architecture, Risks, Power
Decentralized finance did not eliminate intermediaries: it redefined their nature. Ethereum replaced banks with protocols and legal contracts…