Why Financial Leverage Weakens the System Late in the Cycle
Financial leverage amplifies returns during expansion but produces non-linear effects during reversals. Forced deleveraging generates feedback loops that turn modest shocks into systemic stress.

TL;DR
Leverage multiplies losses as sharply as gains: alternative-fund leverage reached 3.2x at end-2025 against 2.4x in 2015, and thin safety margins now convert small shocks into forced selling.
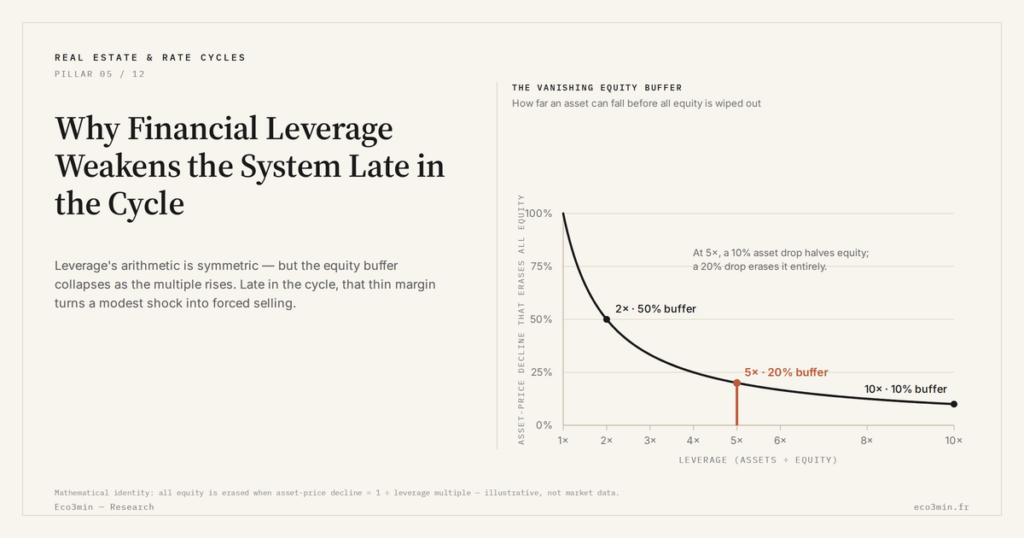
- Leverage's symmetric arithmetic produces asymmetric stability effects: a 10% drop on a 5x position erases half the equity; IMF data show alternative-fund leverage at about 3.2x at end-2025, up from 2.4x in 2015.
- Forced selling feeds a margin-call-to-price-decline loop that hits the most leveraged segments, commercial real estate above 60% debt and leveraged buyouts at 5 to 6 times debt-to-EBITDA, as in March 2020, when leveraged funds dislocated even liquid bond markets.
The amplification mechanics in expansion phases
During expansion periods, leverage allows exposure beyond available capital. An investor with €1 million can control €5 million in assets at 5x leverage. If those assets rise 10%, the gain on equity reaches 50%. This arithmetic draws capital toward leveraged strategies. Apparent returns surpass those of unfunded investments. Competition pushes participants to increase debt to maintain their relative performance. At the system level, aggregate leverage rises gradually. Balance sheets lengthen. Debt-to-equity ratios stretch. Each agent considers its own exposure as controlled. Collective fragility accumulates without being individually perceived. IMF data indicate that average leverage of alternative investment funds in advanced economies reached ≈3.2 at end-2025, up from ≈2.4 in 2015.The shift in reversal phases
When asset prices stop rising, the logic of leverage reverses. A 10% decline on a 5x leveraged portfolio wipes out 50% of equity. Safety margins erode rapidly. It is exactly that erosion of margin that regulatory ratios attempt to bound, through the risk-weighted capital requirements of Basel III. Creditors react by demanding additional collateral (margin calls) or reducing financing lines. The leveraged investor must then sell assets to cut exposure. These forced sales accentuate the price decline. This mechanism creates a negative feedback loop. Falling prices → margin calls → forced sales → further price declines. The structural reading is developed in how real estate absorbs rate shocks with delay. The breakdown of the credit cycle and its reversals shows that this spiral characterizes cycle ends where leverage has accumulated. This configuration ties back to phases of systemic vulnerability.Why deleveraging is rarely orderly
Theory suggests that gradual deleveraging could absorb shocks without rupture. Practice shows that adjustments are generally abrupt. Margin call thresholds create cliff effects. The synchronization of behaviors amplifies movements. Market liquidity contracts precisely as sales accelerate. The March 2020 episode illustrates this dynamic. Within a few sessions, leveraged funds had to liquidate massive positions, causing dislocations even in bond markets reputed for their liquidity.The most exposed sectors
Commercial real estate structurally combines high debt ratios — often above 60% — with assets whose liquidity can evaporate during stress. Private equity rests on heavily leveraged structures. Leveraged buyouts commonly display debt-to-EBITDA ratios of 5 to 6 times. Hedge funds running leveraged strategies form another vulnerability hub, through their interconnection with the banking system. The examination of the non-linear nature of reversals details these mechanisms.- Leverage amplifies gains in expansion and losses in contraction.
- Forced deleveraging generates negative feedback loops.
- Structurally leveraged sectors are the main vectors of systemic fragility.
What consensus tends to underestimate
Risk models underweight forced deleveraging scenarios. Assumptions of normality and stable correlations break down during stress periods. Stress tests struggle to capture second-round effects. The system can appear resilient while accumulating real vulnerabilities.Variables that may alter the trajectory
Monetary policy and prudential regulation shape the evolution of leverage. Risk sometimes shifts toward shadow banking. In early 2026, deleveraging is unfolding gradually in certain segments, without systemic rupture at this stage.Indicator to watch
The aggregate leverage ratio of financial institutions provides a system-wide measure of indebtedness. Spreads on leveraged buyout debt and flows into leveraged funds constitute leading signals of stress.What this fragility implies
Fragility emerges when leverage makes the system vulnerable to modest shocks. Late in the cycle, safety margins are compressed. A minor shock can trigger a deleveraging cascade.Last updated — 28 July 2026
Disclaimer – Financial Information: The analyses, commentary, and content published on eco3min.fr are provided for informational and educational purposes only. They do not constitute investment advice or a solicitation to buy or sell financial instruments. Past performance is not indicative of future results. All investment decisions involve risk and are the sole responsibility of the reader.
Read next
Full pillar →US Rental Property Real Yield: What Cap Rate and NOI Actually Leave You
A rental listing leads with a yield. Divide the annual rent by the price and the number looks…
Cap Rate Spread: What Rental Yield Pays Over the 10-Year Treasury
A 5% cap rate sounds attractive. But 5% against what? A risk-free 10-year Treasury yields near 4.5% in…
Vacancy and Turnover: The Cost That Erodes a Landlord’s Real Return
A listing shows full rent, twelve months a year. The owner knows the gaps between tenants, the make-ready…