Mortgage Credit Cycle: How Monetary Policy Transmits to Housing Prices

Between a rate hike and a housing-price correction sits the link most observers skip: the credit cycle. It is where monetary policy actually transmits to real estate, and its own lags govern both the timing and the depth of any adjustment.
Housing markets do not absorb rates. They absorb the credit that follows from them.
The mortgage credit cycle is the transmission belt between monetary policy and housing-price dynamics. What hits prices is not the policy rate itself but the credit conditions it shapes — volumes granted, lending standards, loan maturities — each operating on its own timetable. The breakdown is provided in the assumptions that mislead investors on real estate.
TL;DR
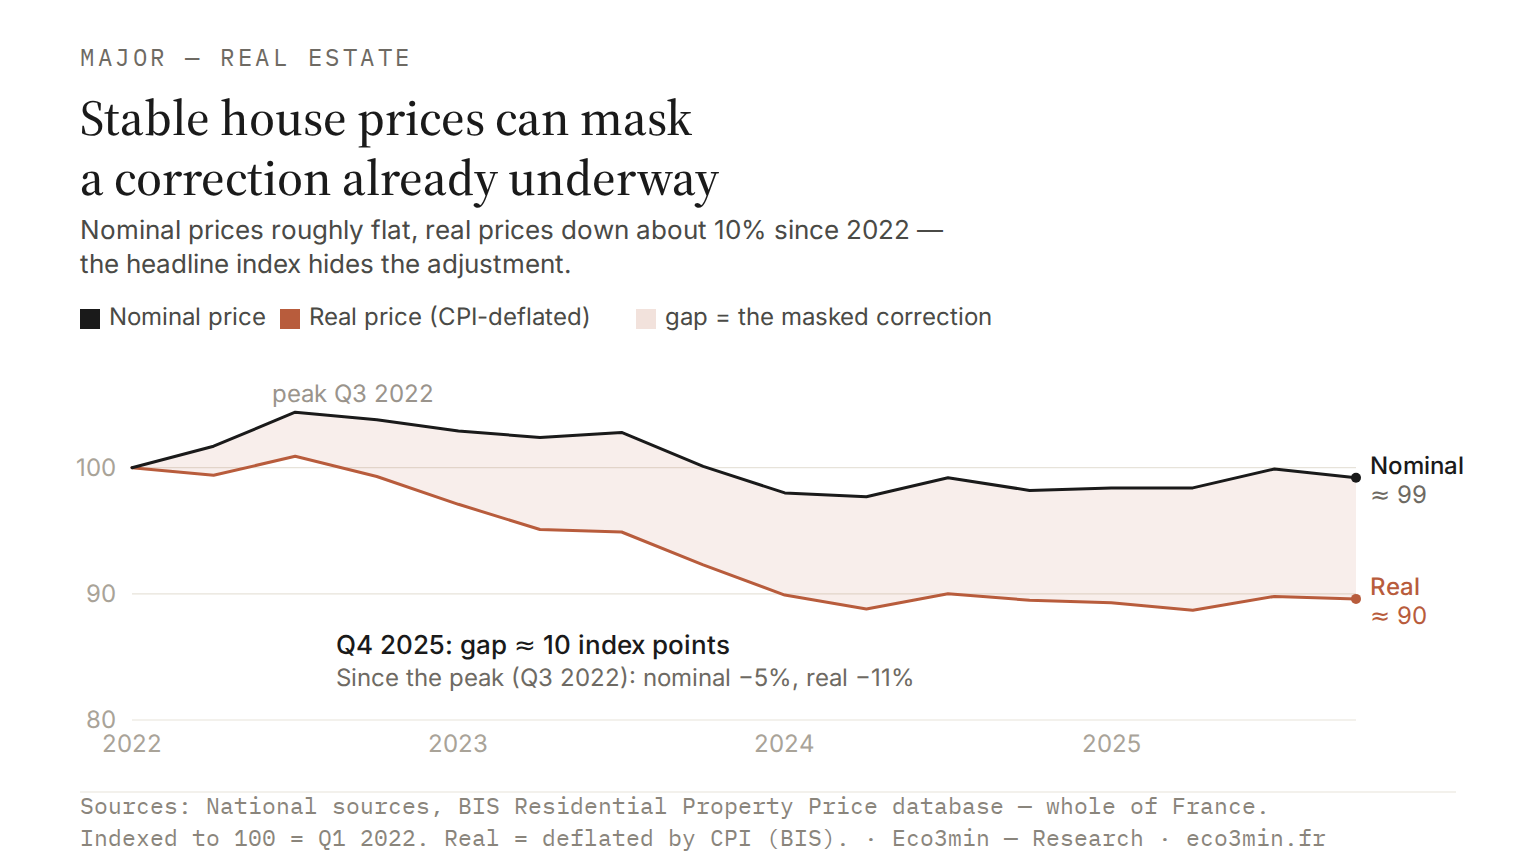
Since 2022, euro-area mortgage rates roughly tripled and volumes fell 20-35% while nominal prices barely moved; most of the correction is a 10-15% real erosion, with prices adjusting last.
- Transmission runs rates to credit to volumes to prices, lagging at every link: euro-area new housing-loan flows fell roughly 35% between their 2022 peak and late 2023, then held at historic lows (ECB, December 2025).
- Volumes collapse before prices move: French notaries' and Eurostat data for 2023-2025 show transaction volumes down 20-35% while nominal prices fell only 3-8% in most large euro-area cities, the downward nominal rigidity documented by Genesove and Mayer (2001).
- The IMF (Global Financial Stability Report, October 2025) notes housing-price corrections historically trail credit contraction by 4-8 quarters, placing any price-correction peak between late 2025 and 2027 in this cycle.
- Regulation locks the cycle in place: France's HCSF caps borrowers' debt-service ratios at 35% and loan maturities at 25 years, while the real cost of homeownership has risen about 30% since 2021.
That distinction explains why prices stay sticky for quarters after a major tightening. The chain is not rates → prices but rates → credit → volumes → prices, with a structural lag at every link — a sequence that disorients observers who read housing through the lens of equity-market reflexes.
Since 2022, borrowing rates have doubled and transaction volumes have fallen 20–30%, yet nominal prices have eased only marginally across most major metro areas. Those magnitudes can be recomputed for any profile in our borrowing-capacity simulator. The paradox is not an anomaly: it is the signature of a market that absorbs the credit shift triggered by rates, not the rates themselves. This dynamic sits inside the broader framework of the credit-driven housing cycle and intersects with the analysis of monetary transmission to the real economy.
Housing markets do not absorb rates. They absorb the credit that follows from them. Monetary policy reaches housing prices through a four-step sequence: rate hikes → higher cost and contraction of credit flows → collapse in transaction volumes → delayed price adjustment. The structural lag at each link explains why prices stay resilient for quarters after a major tightening: volumes adjust first, prices later. The mechanism is documented (BIS, ECB, academic literature); the magnitude of further price adjustment in the current cycle — constrained supply, dominant fixed-rate structures — remains debated.
The core mechanism: how credit shapes housing prices
Monetary transmission to housing follows a causal chain in which every link carries its own lag — and it is the accumulation of those lags that produces the inertia characteristic of real-estate prices.
Trigger: policy-rate hikes and bank funding costs. The starting point is a monetary decision that lifts banks’ funding costs. The signal moves first to interbank rates, then to borrowing conditions, filtered each step of the way by each institution’s funding mix, risk appetite, and prudential constraints. The ECB raised its deposit rate from –0.5% to 4% between July 2022 and September 2023. Euro-area mortgage rates followed, climbing from around 1.3% on average in early 2022 to over 3.8% by late 2023 (ECB Statistical Data Warehouse) — a near-tripling in eighteen months. But the rate move alone does not set the adjustment: what determines housing prices is the volume and quality of credit actually granted.
Transmission channel: contraction in credit flows. The pivotal mechanism is the contraction in new mortgage lending. In the euro area, new housing-loan flows fell roughly 35% between their 2022 peak and late 2023, then stabilized at historically low levels through 2024–2025 (ECB data, December 2025). This channel typically operates with a 3–6 month lag relative to mortgage-rate moves, as tighter standards work their way through banks’ decisions. A 2016 ECB working paper (Kok, Mirza, Móré, Pancaro) formalized the point: lending standards — not rates alone — are the primary monetary-transmission channel into housing markets. The ECB Bank Lending Survey (Q4 2025) confirms continued tightening on mortgage credit, with stricter down-payment thresholds and debt-to-income caps. The mechanics that cap how much a household can finance takes this up from another angle. Related reading: how REIT leverage works through rates.
Amplifier: balance-sheet channel and volume–price asymmetry. Credit contraction triggers a sequence that is asymmetric by construction: transaction volumes collapse before prices move. The lag has a behavioral root documented by the BIS (Annual Report 2024) — sellers adjust price expectations downward with significant inertia, a feature known as downward nominal rigidity. Methodology detailed in the BIS Annual Economic Report 2024. French notaries’ data and Eurostat indices for 2023–2025 illustrate the pattern: volumes fell 20–35% depending on the market while nominal prices declined only 3–8% in most large euro-area cities. Amplification comes from the balance-sheet channel: even modest price declines erode collateral values, which compresses borrowing capacity for prospective buyers, which compresses transactions further — a feedback loop self-sustaining as long as credit stays restrictive.
Macro consequence: slow, cumulative, and structurally incomplete adjustment. The combined channels produce an adjustment profile fundamentally unlike an equity correction: slow (spread over 2–5 years), asymmetric (volumes absorb the initial shock), and often incomplete in nominal terms. Real prices — inflation-adjusted — can fall significantly without large nominal declines, an “invisible” correction documented by the IMF in its financial-stability work. In practice, most of the price adjustment may occur not through abrupt nominal drops but through gradual real erosion over several years.
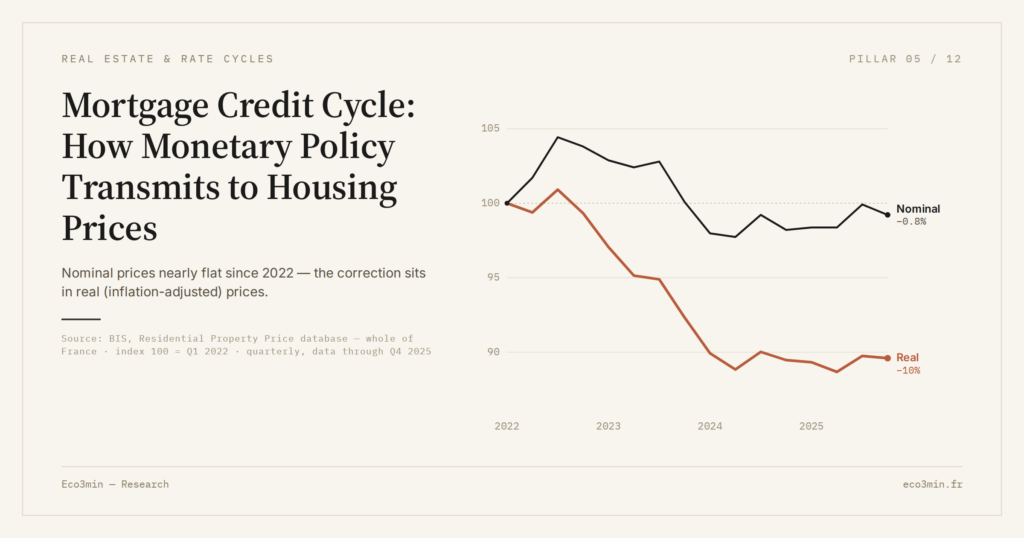
- Euro-area mortgage rates: ×3 in 18 months (~1.3% early 2022 → ~3.8% late 2023). Source: ECB Statistical Data Warehouse.
- New housing-loan flows: –35% between the 2022 peak and late 2023. Source: ECB, December 2025.
- Transaction volumes: –20% to –35% across markets since 2022. Sources: French notaries, Eurostat.
- Nominal prices: –3% to –8% in major euro-area metro areas. Source: Eurostat quarterly indices.
- Real prices (inflation-adjusted): –10% to –15% cumulatively since 2022. Sources: Eurostat, Eco3min calculations.
What the consensus reads correctly — and the correction it understates
The dominant view, carried by most sector analysts and real-estate surveys, rests on a reasonable-looking diagnosis: the worst is behind. Mortgage rates have stabilized, new-loan flows show tentative signs of recovery, and nominal prices are holding — read as a floor. The reading has merit: stable mortgage rates are a necessary condition for any normalization.
Its weakness lies in confusing flow stabilization with cycle normalization. Mortgage credit has stopped contracting, but it remains historically weak. Lending standards remain restrictive. And the volume → price correction is lagged by construction: prices adjust last, not first. The IMF (Global Financial Stability Report, October 2025) notes that housing-price corrections in advanced economies historically trail credit contraction by 4–8 quarters — placing the potential price-correction peak between late 2025 and 2027 in the current cycle. The pattern is what makes housing-price declines, when they finally show up, look “surprisingly slow,” and why “housing crisis” headlines arrive after the fact. Credit stabilized at a restrictive level is not accommodative — it sustains pressure on volumes and, through volumes, on prices, even without further deterioration. The gap between the normalization narrative and a still-constrained credit cycle is where underappreciated correction risk lives.
Reading stabilized mortgage rates as housing-market normalization. Nominal price resilience amid collapsed volumes does not signal a floor — it signals an illiquid market where the marginal transaction sets the printed price. Real adjustment runs through volumes first (collapsed), real prices next (declining once inflation-adjusted), and nominal prices last. The most informative indicators are French notaries’ data, Eurostat volume series, and inflation-adjusted price indices.
| “Floor reached” reading | Credit-cycle reading | |
|---|---|---|
| Core assumption | Rate stabilization marks the end of adjustment | Price adjustment follows credit contraction with a 4–8 quarter lag |
| Invoked signal | Nominal price resilience, mortgage-rate stabilization | Collapsed volumes, restrictive lending standards, credit stabilized at low levels |
| Analysis horizon | 6–12 months (current data) | 12–36 months (full volume → price cycle) |
| Main risk | Missing the rebound if credit restarts | Underestimating further real correction |
| Key variable | Mortgage rates, nominal prices | Credit flows, lending standards, real (inflation-adjusted) prices |
Bank balance sheets, regulation, structural rigidities: why housing never adjusts like financial markets
The transmission framework hides complexities that explain why housing markets follow dynamics fundamentally different from financial markets. Further reading: our buying-versus-renting comparison.
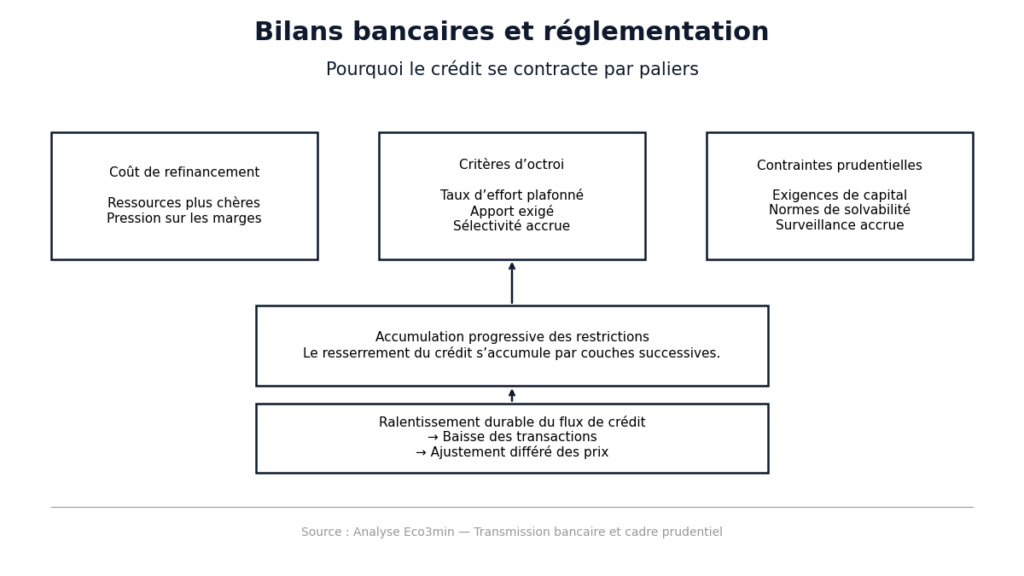
Bank balance sheets as echo chambers. Bank balance-sheet health is an overlooked but decisive transmission link. When rates rise quickly, banks face higher funding costs and tighter trade-offs — interest-rate risk on bond portfolios, default risk on loan books. The adjustment accumulates stepwise. Intermediation margins reshape, lending standards tighten gradually, and certain borrower categories — first-time buyers, low down-payment applicants — are excluded first. ECB data (December 2025) show tightening was more pronounced for mortgage lending than for corporate credit — consistent with real estate’s weight on European bank balance sheets (about 40% of total loans outstanding, Banque de France data). Companion dataset: the mortgage delinquency record since 1991.
Regulation as amplifier or shock absorber. Beyond rates and bank health, the regulatory framework acts as a credit-cycle multiplier. France’s High Council for Financial Stability capped borrowers’ debt-service ratios at 35% and loan maturities at 25 years — constraints that, layered onto high-rate conditions, lock the credit cycle in place for far longer than a simple rate shock would. The interaction between prudential ratios (Basel III) and monetary tightening creates a scissors effect: banks are simultaneously pushed to tighten by monetary policy and constrained by capital requirements that limit their easing capacity once the rate cycle reverses. This regulatory lock-in is specific to housing and has no equivalent in financial markets.
Nominal rigidity and the illusion of stability. Downward nominal rigidity in housing prices — formalized in a 2001 NBER paper (Genesove & Mayer) and confirmed in the current cycle — creates an illusion of stability. Sellers withdraw listings rather than accept discounts, shrinking supply and artificially propping up nominal prices. The result is a market where posted prices hold but liquidity collapses, with printed indices reflecting only marginal transactions. Real adjustment then occurs through two channels invisible in nominal indices: real-price correction via inflation erosion (around 2–4 percentage points per year over 2023–2025) and quality deterioration (units selling at posted prices skew higher-end, biasing indices upward).
Geographic desynchronization. The desynchronization of cycles across major economies is amplified in housing. Debt structures shape transmission speed more than rate levels do: markets where variable-rate lending dominates (Spain, UK, Nordics) absorbed the rate shock faster, with larger nominal corrections (7–15% depending on market, Eurostat data). Markets dominated by fixed-rate lending (France, Germany) are still digesting the shock, with adjustment concentrated in volumes. The same monetary policy therefore produces housing cycles staggered by 12–24 months across euro-area countries. Related analysis: the uneven impact of rate resets on variable-rate mortgages.
Measuring the mortgage credit cycle: beyond the headline rate
The mortgage rate is the most cited indicator but a poor signal of the cycle’s real state. More informative metrics sit downstream: monthly new housing-loan flows measure effective financing dynamics; bank approval rates (share of accepted applications) capture tightening or easing beyond rate moves alone; average loan maturity signals structural inertia (longer maturities offset higher rates, while capped maturities mean adjustment margins are exhausted); the spread between mortgage rates and risk-free rates measures the real cost of housing finance beyond the policy signal.
Long-run Banque de France data on housing-loan flows give the historical perspective: across the four French housing cycles since 1991 (1991, 2001, 2008, 2022), credit-flow contraction preceded price corrections by 4–8 quarters on average. Credit turns ahead of prices — a pattern reinforced by the distinction between nominal and real interest rates: stable borrowing rates combined with falling inflation mean rising real rates, which tightens financing conditions further even without new hikes. The ramifications of this mechanism — credit, prices, signals — continue in the pages below.
Going further
Credit as the engine
Stress and reversals
Housing prices and signals
Each page covers one specific link in the chain and can be consulted on its own.
Implications for reading the current housing market
If the credit-cycle framework holds, it reshapes the reading of several ongoing dynamics. It also reframes the present against the long-run record of mortgage-rate regimes, 1971-2026.
Market diagnosis. Nominal price resilience amid collapsed volumes does not signal market strength — it signals an illiquid market still mid-adjustment. The analytical framework of the real cost of money confirms that the financial constraint on prospective buyers remains high: with mortgage rates around 3.5–4% and falling inflation, the real cost of housing finance is at its highest level since 2008. The real cost of homeownership — mortgage payments relative to disposable income — has risen by roughly 30% since 2021, reflecting both higher rates and resilient nominal prices. Absent a meaningful easing in credit conditions (in volumes and standards, not only rates), downward price pressure persists, with adjustment running mainly through real erosion and progressive deterioration in less liquid segments (commercial real estate, peri-urban areas, energy-inefficient stock).
Monetary policy reading. Potential monetary easing — policy-rate cuts — does not transmit symmetrically to the mortgage credit cycle. Downside transmission is structurally slower than upside transmission, because banks maintain restrictive standards while default risk remains elevated and regulatory frameworks limit flexibility. This asymmetric lag, formalized in ECB pass-through research, implies that a 100-basis-point rate cut would revive the mortgage credit cycle only after 6–12 months, and only if accompanied by easing lending standards. Examined side by side with the timing of the economic cycle to determine the pace of any market normalization.
Structural dynamics. The current cycle overlaps with structural shifts reshaping housing markets: energy transition (devaluing inefficient homes and creating a “green premium”), demographics (aging populations, evolving household structures), and post-pandemic geographic reconfiguration (remote work, migration toward mid-sized cities). These forces create cycle-specific singularities that prevent mechanical extrapolation from past corrections. The analysis sits within the broader perspective of housing cycles, rates, and the economy.
Invalidation condition. This framework loses relevance if rapid, massive monetary easing — combined with regulatory relaxation (higher debt-service caps, longer permitted maturities) — sharply revives credit flows and short-circuits the correction sequence. An exogenous demand shock — large-scale homeownership support, migration surges concentrated in specific areas — could also alter trajectories. Conversely, a deeper-than-expected recession, rising defaults on existing loans, or contagion from commercial real-estate stress would amplify and accelerate residential price adjustment, turning an orderly correction into an outright housing crisis.
Three time horizons to monitor the housing cycle
Short horizon (0–6 months): mortgage credit flows show signs of stabilization at low levels. Transaction volumes remain depressed. Nominal prices appear resilient, but real (inflation-adjusted) prices keep eroding. Priority indicators: Bank Lending Survey (mortgage standards), monthly housing-loan flows (Banque de France, ECB), inflation-adjusted price indices (INSEE, Eurostat). The short-term risk is an accelerated correction in the most fragile segments if labor markets weaken.
Cycle horizon (1–3 years): the decisive question is the pace of credit-flow normalization. If lending standards ease meaningfully — which would require both policy-rate cuts and looser bank criteria — the cycle could turn upward within 18–24 months. Otherwise, real-erosion correction persists, with growing divergence across markets (tight markets more resilient than slack ones, energy-efficient housing outperforming inefficient stock). The structural dynamics of the economic cycle will determine whether the adjustment stays contained or sharpens.
Structural horizon (5+ years): the current cycle tests housing markets’ ability to adapt to interest-rate regimes structurally higher than those of 2010–2020. If the real cost of housing capital stays durably above 2%, valuation multiples (price-to-income, price-to-rent ratios) gradually converge toward lower historical norms — an adjustment that may take 5–10 years and run mainly through real erosion rather than nominal collapse. This outlook raises questions about potential growth and household investment capacity in a normalized cost-of-capital environment.
Housing does not absorb rates — it absorbs the credit those rates produce, with structural lags of several quarters at each transmission step. The sequence rates → credit → volumes → prices is a constant feature of housing cycles, and the current one is no exception. Nominal price resilience masks substantial adjustment already visible in real prices and volumes. The consensus confuses stabilization with normalization: credit stabilized at restrictive levels keeps pressure on the system even without further deterioration. The most likely correction is not a nominal collapse but progressive real erosion — the kind nominal indices detect last.
Robust: The transmission sequence rates → credit → volumes → prices is documented across decades of data and academic literature (BIS, ECB, IMF GFSR). The 4–8 quarter lag between credit contraction and price correction is a convergent estimate. Volume–price asymmetry is a consistent feature of housing cycles. Downward nominal rigidity is well established (Genesove & Mayer, 2001).
Uncertain: The exact magnitude of further price correction remains debated, depending on credit trajectories, regulatory evolution, and local supply-demand balances. The impact of the energy transition on price differentiation (green premium) is materializing but hard to quantify. The speed at which potential monetary easing transmits to the mortgage credit cycle is uncertain: asymmetric lag (slower downside transmission) is documented, but its precise calibration in the current cycle remains open.
Regular monitoring of the weekly macro checkpoint allows the framework to be tested against the latest credit, volume, and price data. Several trajectories remain open, but reading housing through its credit cycle — rather than through policy rates alone — gives a sturdier framework to anticipate the timing and shape of the adjustment ahead. The studies grouped below detail each link of this credit chain.
In this series
Mechanics of the credit cycle
Lags and real-time observation
Credit and financial crises
They extend the framework of this article, one link at a time.
- Housing does not absorb rates — it absorbs the credit those rates produce. The sequence rates → credit → volumes → prices is the structural constant of housing cycles.
- Transaction volumes absorb most of the initial shock (–20% to –35% in the euro area since 2022); nominal prices adjust last, a 4–8 quarter lag that creates an illusion of resilience.
- The real correction is already substantial: inflation-adjusted housing prices in the euro area have declined significantly, even where nominal prices appear stable.
- The credit cycle is amplified by three structural factors — bank balance sheets, the regulatory framework (HCSF, Basel III), downward nominal rigidity — that extend the duration of any adjustment.
- The framework is invalidated if massive monetary easing combined with regulatory relaxation sharply revives credit flows, or if an exogenous demand shock alters the supply-financing balance.
Last updated — 20 September 2026
Disclaimer – Financial Information: The analyses, commentary, and content published on eco3min.fr are provided for informational and educational purposes only. They do not constitute investment advice or a solicitation to buy or sell financial instruments. Past performance is not indicative of future results. All investment decisions involve risk and are the sole responsibility of the reader.
Read next
Full pillar →Cap Rate Spread: What Rental Yield Pays Over the 10-Year Treasury
A 5% cap rate sounds attractive. But 5% against what? A risk-free 10-year Treasury yields near 4.5% in…
Vacancy and Turnover: The Cost That Erodes a Landlord’s Real Return
A listing shows full rent, twelve months a year. The owner knows the gaps between tenants, the make-ready…
US Rental NOI, Line by Line: What Net Operating Income Really Subtracts
A US rental yield is advertised gross: annual rent over price. Between that number and the income an…