US Rental Property Real Yield: What Cap Rate and NOI Actually Leave You

A rental listing leads with a yield. Divide the annual rent by the price and the number looks clean, often 8% or more. What the owner actually keeps, after costs, financing and tax, is a different and smaller number.
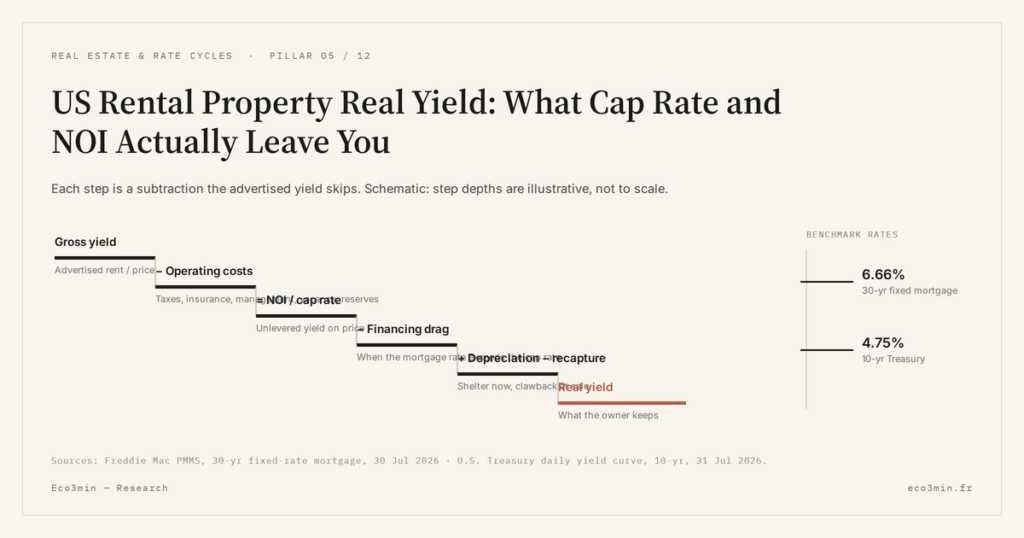
Between the advertised gross and the yield that reaches the owner sits a cascade of subtractions. Reading a rental means following that cascade, not the headline.
US rental yield falls from an advertised gross to a far smaller real return once operating costs, financing and tax are subtracted; NOI is what the owner actually banks.
- Operating costs typically remove 35% to 50% of gross rent before a dollar of NOI appears.
- Multifamily cap rates sat near 5.6% in early 2026, below the roughly 6.5% cost of a 30-year mortgage, so leverage subtracts from the cash return rather than adding to it.
- The 1% rule, monthly rent at 1% of price, implies a 12% gross yield that few 2026 markets deliver.
Gross yield, the advertised number
Gross yield is the simplest figure in real estate and the least informative. It divides annual rent by the purchase price: a property renting for $30,000 a year at a $375,000 price shows an 8% gross yield. The number is clean, quotable and almost always the one a listing leads with, because it flatters the asset before any cost enters. Gross yield is a headline; NOI is the number the owner actually banks.
The figure inverts the way a buyer should read a rental. The instinct is to treat the advertised yield, or the advertised cap rate, as the return. It is not. Gross yield counts every dollar of rent as if it reached the owner untouched, ignoring the taxes, insurance, upkeep, vacancy and management that stand between the tenant’s check and the owner’s account. Every one of those subtractions is real, and together they separate the headline from the yield that matters. The distinction is the spine of the rental profitability sub-pillar.
Gross yield persists because it is easy and flattering, not because it is useful. A broker can compute it from two numbers on the listing, a buyer can compare it across properties in seconds, and it always reads higher than any figure that follows. That is precisely its danger. It sets an anchor near the top of the cascade, and every honest number that follows looks like a disappointment against it, which nudges buyers toward pro formas built on the headline rather than on the property. A yield that ignores costs is not a return; it is a starting point dressed up as one.
The gap between gross and net is not a rounding error but the whole subject. Two properties can advertise the same 8% gross and reach the owner as wildly different returns, one clearing 5% after everything, the other underwater, depending on tax jurisdiction, building age, vacancy and how the purchase was financed. Because gross erases all of that, it is most misleading exactly where it looks most comparable. The work of underwriting a rental is the work of reintroducing everything gross leaves out, one subtraction at a time.
NOI: what operating costs remove
Net operating income is gross rent minus operating expenses, and it is the first honest number in the chain. Operating expenses exclude debt service but include everything needed to run the property: property taxes, insurance, management fees usually running 8% to 10% of collected rent, routine maintenance, and a reserve for capital expenditure, the roof and systems that fail on a long clock. A vacancy allowance belongs here too, because no property collects twelve months of rent every year.
Each line has its own weight and its own volatility. Property taxes vary widely by state and can reset on sale, so the tax a buyer inherits may exceed the seller’s; insurance has climbed sharply in coastal and wildfire-exposed markets, in some cases doubling within a few years; management runs 8% to 10% of collected rent whether an owner hires a firm or values their own time honestly. Maintenance follows a rough rule of thumb of one to two percent of property value a year, and capital reserves, set aside for roofs, heating and plumbing that fail on a decade-long clock, are the line owners most often omit and most reliably regret. Skipping the reserve does not remove the cost; it defers it into a single painful year.
Vacancy is the line that hides the most. It is not only the rent lost while a unit sits empty, but the turnover costs around each gap: cleaning, repainting, repairs, leasing commissions or advertising, and the days on market before a new tenant signs. A single turnover can cost more than a month’s rent even when the vacancy itself is short, which is why a headline yield built on twelve months of collected rent overstates the real figure before any other expense is counted. A stabilized property might budget five percent of gross for vacancy and turnover combined; a high-turnover market or a poorly managed building can run well above that.
Taken together, these costs commonly remove 35% to 50% of gross rent before NOI appears. On the $30,000 gross above, a 40% expense load leaves $18,000 of NOI, which reframes the 8% headline as a 4.8% return on price before financing and tax. Push the expense ratio to 50%, common in older stock or high-tax states, and the same property yields 4% unlevered, half the advertised figure. The exact ratio varies with age, location and property type, but the direction never does: NOI is always well below gross, and a pro forma that assumes otherwise is selling, not analyzing. The line-by-line construction of that number is set out in the NOI breakdown, and the single largest swing factor, empty units, in how vacancy erodes the real return.
Cap rate and the price it implies
The cap rate is NOI divided by value, and it is the market’s price for a dollar of rental income. It strips out financing entirely, describing the unlevered yield the property throws off. In early 2026, US multifamily cap rates sat near 5.6% across classes, according to CBRE data, with the best Class A assets near 4.7% and weaker Class C stock closer to 5.4%. A lower cap rate means a higher price for the same income; a higher one, a cheaper entry and usually more risk.
The cap rate is also a pricing tool that runs both ways. Fix NOI and a cap rate sets the value: $18,000 of NOI at a 5.6% cap implies a price near $321,000, while the same income at a 7% cap prices the asset at $257,000. This is why a change in market cap rates moves values without any change in rent, and why a rising-rate environment compresses prices even for well-run buildings. Appraisers and buyers also distinguish the transaction cap rate on sold assets from the appraisal cap rate on held ones, the former typically running about a point higher, a gap that widens when reported figures lag a moving market.
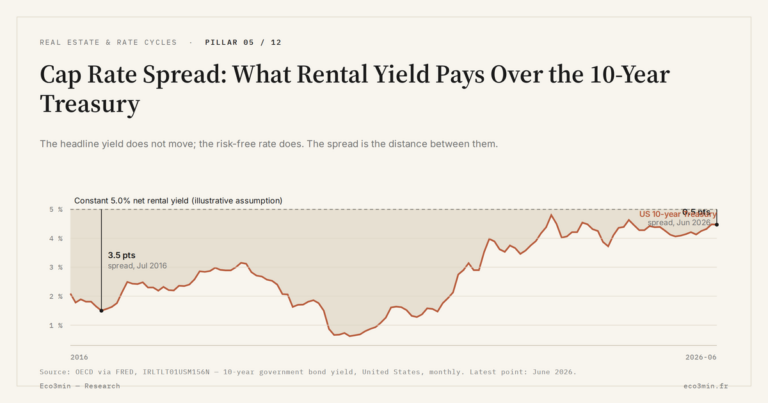
Read against the risk-free rate, the cap rate tells a second story. With the 10-year Treasury near 4.5% in mid-2026, the multifamily cap-rate spread sat close to 110 basis points, well below the long-run average nearer 215 basis points and the post-2008 average nearer 315. A thin spread means investors are accepting a slim premium over a government bond to own and operate real estate, with all the work and illiquidity that entails, a compression that leaves little cushion if rents soften or vacancy climbs, as Fannie Mae expects into late 2026. How that premium behaves against the risk-free benchmark is the subject of the yield spread over the risk-free rate, and the choice between owning buildings directly or through listed vehicles in REITs versus physical real estate.
A thin spread also raises a question the headline never poses: why buy at all when a Treasury pays nearly as much with none of the work. The honest answers are rent growth and inflation protection, a rental’s income can rise while a bond’s coupon is fixed, so buyers accept a slim current spread in exchange for the option on higher future NOI. That bet is reasonable, but it is a bet on growth, not a current return, and confusing the two is how a compressed cap rate gets rationalized. When rents stall, as Fannie Mae’s rising-vacancy outlook suggests they might into late 2026, the thin spread offers little to fall back on, and the property earns its keep only if the growth thesis holds.
Cost of capital and after-tax reality
Financing is where the advertised return often collapses. A cap rate describes the unlevered yield; a mortgage carries its own rate; and in 2026 the two point the wrong way. With 30-year mortgages near 6.5% and multifamily cap rates near 5.6%, the cost of debt sits above the unlevered yield, which means leverage subtracts from the cash return rather than adding to it. This is negative leverage: borrowing to buy an asset that yields less than the loan costs lowers the cash-on-cash return with every additional dollar of debt, the reverse of the amplification investors expect from a mortgage.
The arithmetic is unforgiving. Buy at a 5.6% cap with 25% down and finance the rest at 6.5%, and the mortgage consumes more than the property earns on the borrowed portion, dragging the cash-on-cash return below the unlevered 5.6%. Lenders see the same picture through the debt-service coverage ratio, NOI divided by debt service, which tightens as rates rise and can cap how much a buyer may borrow regardless of the down payment. In this environment, more leverage means less return, which inverts the decade-long instinct that debt is free performance.
Financing is not purely a drag, which is where the after-tax view earns its place. Mortgage interest on a rental is a deductible expense, so part of the financing cost is offset by the tax it saves, softening but not erasing the negative-leverage effect when the mortgage rate sits above the cap rate. The deduction lowers the effective cost of debt; it does not turn a 6.5% loan against a 5.6% asset into positive leverage. The direction still holds, and a buyer who counts the deduction without counting the underlying negative carry has simply moved the optimism one line down the page.
Tax then pulls in the other direction. US owners can depreciate the building, though not the land, over 27.5 years on a straight-line basis, a paper expense that shelters part of the income from tax without costing cash, which lifts the after-tax yield above the pre-tax figure. Cost-segregation studies can accelerate part of that depreciation into the early years, front-loading the shelter. The relief is not permanent: depreciation recapture, taxed up to 25%, claws back part of it at sale, and passive-loss rules limit how much of the shelter many owners can use each year. The real yield an owner banks is therefore the cap rate, minus the drag of financing when debt costs more than the asset yields, plus the lift of depreciation, minus the eventual recapture, a chain that rarely resembles the headline. That financing cost is itself a function of the rate cycle traced in the mortgage credit cycle, and of the real-rate backdrop in the history of real interest rates.
Walk the earlier property through the full chain and the gap becomes concrete. The 8% gross became 4.8% at the NOI line; financing at a rate above the cap rate trims the cash return further; depreciation then adds back a slice by sheltering income from tax; and a future sale hands part of that slice back through recapture. What began as an 8% headline reaches the owner as a low-single-digit real return, and a negative one in the worst mix of high leverage and high vacancy. Some owners defer the recapture indefinitely through a 1031 exchange, rolling gains into a larger property rather than paying tax at sale, which changes the timing of the tax but not the underlying cascade of costs that produced the yield in the first place.
Real yield = (gross rent − operating costs = NOI) / price = cap rate, then − financing drag when the mortgage rate exceeds the cap rate, + depreciation shelter, − recapture at sale. Each arrow is a subtraction the headline skips. Reading a rental means walking the whole chain, not stopping at the first number.
Why headline rules mislead
Shortcuts fill the gap the cascade leaves, and most mislead. The best known is the 1% rule: monthly rent should equal at least 1% of the purchase price. Stated as an annual figure, that is a 12% gross yield, a level few US markets deliver in 2026 and one that says nothing about the costs, financing and tax that follow. A property can clear the 1% rule and still lose money once vacancy and negative leverage are counted; another can miss it and cash-flow well in a low-tax, low-vacancy market.
Other shortcuts share the flaw. The 50% rule assumes operating costs will eat half of gross rent, a useful sanity check but a blunt one that ignores the wide spread between a new build in a low-tax state and aging stock in a high-tax one. The gross rent multiplier, price divided by annual gross rent, repeats gross yield’s blindness in inverse form. Even cash-on-cash return, closer to the truth because it counts financing, still stops short of tax and of the capital reserves that turn a good year into an average one. Each rule captures one slice of the cascade and presents it as the whole.
The deeper problem with headline rules is that they operate at the top of the cascade, on gross, where the least information lives. They are screening tools mistaken for verdicts. The same applies to a quoted cap rate divorced from its inputs: a seller can present a cap rate on optimistic rents and understated expenses, inflating the number the buyer anchors on. The defense is not a better rule but the discipline of the cascade, taking each subtraction in turn, operating costs, then financing, then tax, until the number that survives is the one the owner will actually keep.
None of this makes rental property a poor asset; it makes the headline a poor measure of it. A well-chosen property in a low-tax, low-vacancy market, bought at a cap rate above its financing cost, can deliver a real return that justifies the work and the illiquidity. The point is that the figure supporting that judgment is the one at the bottom of the cascade, not the top. The advertised yield tells a buyer what the seller wants them to see; the real yield tells them what they will live with for years. Between the two lies every cost this cascade names, and the discipline to subtract each one before calling the result a return.
The advertised yield describes the property; the real yield describes the owner’s position. Only the second survives operating costs, the cost of capital and tax.
The number that survives
A rental has many yields, and only one of them is the owner’s. Gross flatters, the cap rate informs, and the real after-financing, after-tax return decides. In a 2026 market where cap rates sit below borrowing costs and the risk premium over Treasuries is thin, the gap between the advertised figure and the banked figure is unusually wide, which is precisely when reading the cascade matters most. An investor who anchors on gross in this environment is not optimistic but mismeasured, mistaking the top of the funnel for its outflow. The owners who fare best are the ones who price the property on what survives every subtraction, then compare that survivor against the risk-free rate they could earn doing nothing. Each subtraction is developed across the wider real estate, credit and rate cycles pillar, alongside the rest of the rental profitability cluster.
Last updated — 3 August 2026
Disclaimer – Financial Information: The analyses, commentary, and content published on eco3min.fr are provided for informational and educational purposes only. They do not constitute investment advice or a solicitation to buy or sell financial instruments. Past performance is not indicative of future results. All investment decisions involve risk and are the sole responsibility of the reader.
Read next
Full pillar →Vacancy and Turnover: The Cost That Erodes a Landlord’s Real Return
A listing shows full rent, twelve months a year. The owner knows the gaps between tenants, the make-ready…
US Rental NOI, Line by Line: What Net Operating Income Really Subtracts
A US rental yield is advertised gross: annual rent over price. Between that number and the income an…
Loan Term Mechanics: How 15-Year vs 30-Year Reshapes the Monthly Payment
Stretching a mortgage’s term lowers the monthly payment, so a given income can carry a larger loan. The…