US Rental NOI, Line by Line: What Net Operating Income Really Subtracts

A US rental yield is advertised gross: annual rent over price. Between that number and the income an owner keeps sits net operating income, the figure that survives every operating cost the listing ignores.
NOI is the first honest number in a rental’s accounts. It strips out nothing that matters to running the property, and adds back nothing that flatters it.
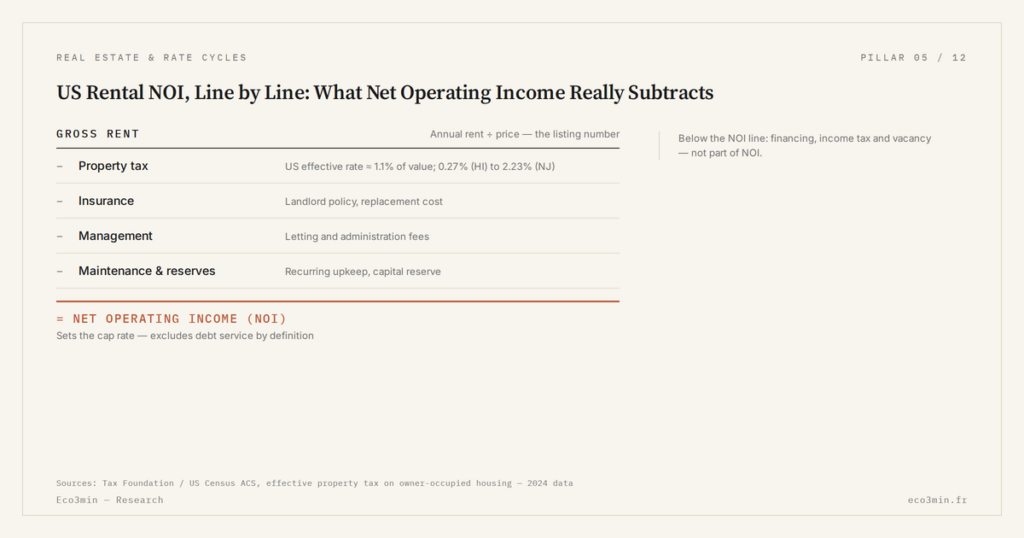
Net operating income subtracts every operating cost from gross rent, property tax, insurance, management, maintenance and reserves, leaving the figure that sets the cap rate before any financing.
- Operating costs commonly remove 35% to 50% of gross rent before NOI appears.
- US property tax averages near 1.1% of value, from 0.28% in Hawaii to above 2% in New Jersey and Illinois.
- NOI excludes debt service by definition, so it measures the property, not the purchase.
Gross rent, the listing number
Gross rent over price is the number a listing leads with, and the one that tells a buyer least. A property renting for $24,000 a year at a $400,000 price shows a 6% gross yield, clean and quotable. It counts every dollar of rent as if it reached the owner untouched, ignoring the taxes, insurance, upkeep and management that stand between the tenant’s check and the owner’s account. NOI is where the advertised yield goes to lose its illusions.
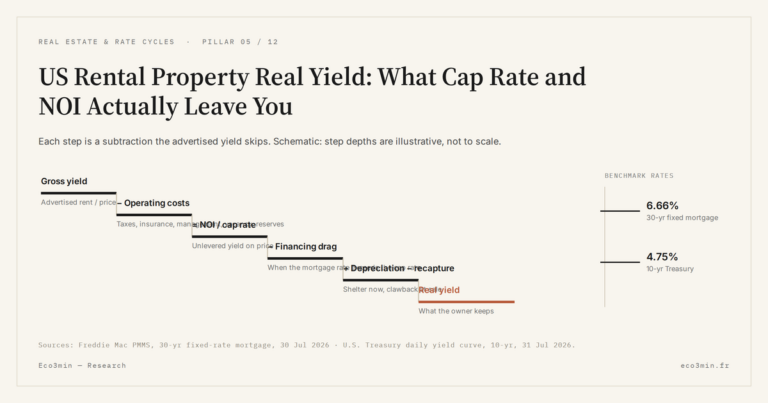
The instinct is to treat gross as close enough, a figure to shave by a few points later. NOI shows why that fails. Operating costs do not trim gross at the margin; they move the decision regime, not just the decimal, turning a headline that looks competitive into a net figure that may not clear the risk-free rate. A property advertised at 6% gross can settle near 3.5% at the NOI line, a gap wide enough to change whether it is worth buying at all. That reversal anchors the full real-yield cascade.
Gross persists because it is easy and flattering, not because it is useful. A broker computes it from two numbers on the listing, a buyer compares it across properties in seconds, and it always reads higher than any figure that follows. That is its danger: it sets an anchor at the top of the cascade, so every honest number below looks like a letdown against it, nudging buyers to reason on the headline rather than on the building. In a market where cap rates sit near borrowing costs, the gap between gross and NOI is exactly where a deal is won or lost, and it is the part gross hides. A yield that ignores costs is not a return; it is a starting point dressed up as one, and NOI is the first number that treats the property honestly.
Operating costs, line by line
NOI is gross rent minus operating expenses, and each expense has its own weight. Property taxes lead the list and vary widely: the national effective rate runs near 1.1% of value, but from roughly 0.28% in Hawaii to above 2% in New Jersey and Illinois, and they can reset on sale, so the tax a buyer inherits may exceed the seller’s. Insurance follows, with landlord policies averaging around $1,500 a year nationally and climbing far higher in coastal and wildfire-exposed markets, where premiums have risen sharply.
The property-tax line hides a trap for buyers in particular. In many jurisdictions the assessed value resets at the sale price, so a building taxed on a decade-old assessment can jump to a far higher bill the year a new owner takes over. A pro forma built on the seller’s current tax figure can therefore understate the buyer’s true cost by thousands of dollars, quietly inflating the NOI and the yield that follow. Reading the actual millage rate against the purchase price, rather than trusting the seller’s line, is the difference between a projection and a guess.
Management runs 8% to 10% of collected rent whether an owner hires a firm or values their own time honestly. Maintenance follows a rough rule of one to two percent of property value a year, and a capital-expenditure reserve, set aside for roofs and systems that fail on a decade-long clock, is the line owners most often omit and most reliably regret. Homeowner-association dues, where they apply, add another fixed monthly cost. Taken together, these lines commonly remove 35% to 50% of gross rent, which is why NOI sits well below the headline, before the largest swing factor, empty units, enters through how empty units cut the yield.
A worked figure shows how fast the headline falls. On $24,000 of gross rent, property tax at a national-average rate might take $4,000 on a $400,000 building, insurance $1,500, management at 9% about $2,160, a maintenance and capex allowance of one-and-a-half percent of value roughly $6,000, and modest HOA dues a few hundred more. Those lines alone approach $14,000, leaving around $10,000 of NOI before vacancy, a 6% gross reduced to a 2.5% unlevered yield on price. Change the state and the tax line swings by thousands; defer the capex reserve and the number flatters until the roof fails. The point is not the exact figure but the size of the gap: operating costs are not a footnote to gross, they are most of the distance between gross and the truth. A buyer who budgets them honestly, line by line, ends with a number they can defend; one who estimates them in a single round percentage usually ends too high.
Why NOI excludes debt service
NOI stops at operating costs by design; it does not subtract the mortgage. That exclusion is deliberate and useful. Debt service depends on how a particular buyer financed the purchase, the down payment, the rate, the term, none of which say anything about the property itself. By leaving financing out, NOI measures the asset rather than the transaction, which lets two buyers with very different loans compare the same building on equal terms.
This is also what makes NOI the input to the cap rate rather than to cash flow. Cash flow after debt service is a personal number; NOI is a property number. The financing layer that NOI omits is added back in the owner’s real yield and in the cost-of-capital analysis, and it moves with the rate cycle traced in the credit cycle behind rates. Keeping the two separate is the discipline that lets a buyer see the property clearly before layering a mortgage on top.
The separation also protects the analysis from a common sleight of hand. A seller can quote a strong cash-on-cash return by assuming a large down payment or a low rate, dressing a mediocre property in favorable financing. NOI resists that, because it fixes the property’s performance independently of any loan. Two buildings with the same NOI throw off the same operating yield regardless of who buys them or how; only after NOI is settled does financing, and the negative leverage that a high-rate environment can bring, enter the picture. Judging the property first and the purchase second is the order the cap rate enforces. It is also what makes NOI portable: the same figure means the same thing to a cash buyer and a leveraged one, which is precisely why the market quotes cap rates rather than cash-on-cash returns.
NOI to cap rate
Divide NOI by price and the result is the cap rate, the market’s price for a dollar of rental income and the unlevered yield the property throws off. On the $400,000 property above, a 6% gross that becomes $14,000 of NOI after operating costs implies a 3.5% cap rate, a very different figure from the headline and the one a market actually prices. A lower cap rate means a higher price for the same income; a higher one, a cheaper entry and usually more risk.
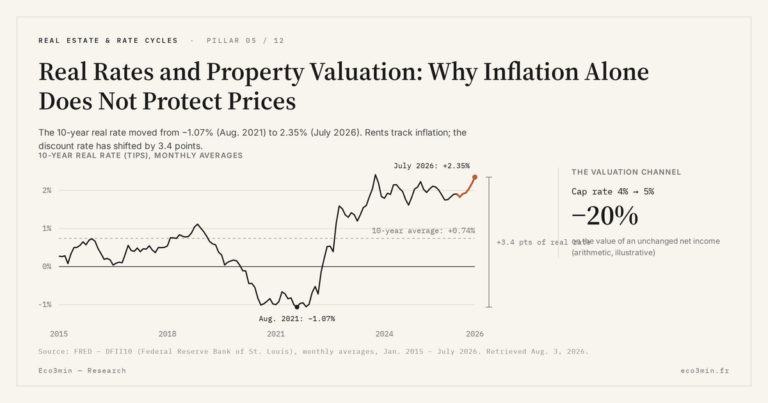
The cap rate also runs backward as a pricing tool. Fix NOI and a cap rate sets the value: $14,000 of NOI at a 5% cap prices the asset at $280,000, while the same income at a 7% cap prices it at $200,000. This is why a shift in market cap rates moves values with no change in rent, and why a rising-rate environment presses prices down even for well-run buildings. A buyer who anchors on gross misses this entirely, because gross carries no information about the price the market will actually pay for the income once costs are stripped out.
Read against the risk-free rate, the cap rate carries a second message. With Treasuries yielding several percent, a low cap rate leaves a thin premium for the work and illiquidity of owning real estate, a spread analyzed in the cap-rate spread over Treasuries and set against the broader the gross-to-net profitability sub-pillar. The cap rate is where the operating cascade lands, and where the pricing conversation begins.
That landing point is only meaningful next to the risk-free rate. A cap rate of 5% means one thing when Treasuries pay 2% and another when they pay 4.5%: the first offers a healthy premium for the work and risk of owning, the second a thin one. Reading the cap rate in isolation, as a seller’s headline invites, hides that comparison. NOI produces the cap rate; the cap rate, set against the risk-free benchmark, produces the judgment. Skipping the operating cascade means never reaching either.
Treating gross yield as close enough to NOI. It is not a rounding difference: operating costs remove a third to a half of gross before NOI appears. A 6% gross can reach the NOI line near 3.5%, a gap that moves the decision to buy, not just the decimal after it.
The number the market prices
Gross rent describes the listing; NOI describes the property. Only the second sets the cap rate, and only the cap rate, read against the risk-free rate, tells a buyer whether the income justifies the price. Building NOI line by line is slower than quoting a gross yield, and it is the whole of the work. A buyer who does it sees the property the market sees; a buyer who skips it is bidding on a number the seller chose, and often paying for the difference for years. Each subtraction is developed across the wider the wider real-estate and credit pillar.
Last updated — 3 August 2026
Disclaimer – Financial Information: The analyses, commentary, and content published on eco3min.fr are provided for informational and educational purposes only. They do not constitute investment advice or a solicitation to buy or sell financial instruments. Past performance is not indicative of future results. All investment decisions involve risk and are the sole responsibility of the reader.
Read next
Full pillar →Cap Rate Spread: What Rental Yield Pays Over the 10-Year Treasury
A 5% cap rate sounds attractive. But 5% against what? A risk-free 10-year Treasury yields near 4.5% in…
Vacancy and Turnover: The Cost That Erodes a Landlord’s Real Return
A listing shows full rent, twelve months a year. The owner knows the gaps between tenants, the make-ready…
Loan Term Mechanics: How 15-Year vs 30-Year Reshapes the Monthly Payment
Stretching a mortgage’s term lowers the monthly payment, so a given income can carry a larger loan. The…