The Credit Cycle: The Hidden Driver Behind Economic Fluctuations and Markets
Credit drives the economic cycle before GDP, inflation, or unemployment register any change. Understanding bank lending dynamics, leverage, and balance sheet expansion reveals where the next inflection is being prepared.

Credit is the primary causal variable behind economic fluctuations. Activity indicators measure its delayed consequences, not its impulse.
TL;DR
Credit creation is the leading impulse of the cycle: bank lending standards and loan volumes turn several quarters before GDP, inflation and unemployment register it. Further reading: how monetary policy reaches housing prices.
- The ECB Bank Lending Survey (January 2025) shows a net 7% of euro-area banks tightening corporate lending standards in Q4 2024; the Fed's Senior Loan Officer survey (January 2025) reports a parallel move.
- BIS long-run data put the advanced-economy credit-to-GDP ratio at roughly 165% in Q1 2010, rising to nearly 180% by end-2021, an expansion that powered the post-2008 recovery rather than merely tracking it.
- Leverage links credit to valuations: the Fed balance sheet swelled from $4.2tn in January 2020 to about $8.9tn at its early-2022 peak, then fell back near $6.5–6.9tn by early 2026 as asset prices followed financing conditions.
- Transmission speed is structural: euro-area fixed-rate mortgages slow it versus the US variable-rate market, with lag estimates running from Friedman's 12–18 months to Waller's 9–12 (January 2023).
Economic turning points do not surface first in the indicators that attract the most attention. GDP, inflation, and unemployment all measure outcomes — they do not anticipate them. The leading signal sits upstream, in a quieter dynamic that very few cyclical dashboards put at the center: credit.
Bank lending expansion and contraction set the boundary of what economic agents can actually invest, consume, and underwrite as risk. The mechanism is cumulative, and it usually fires several quarters before any meaningful slowdown shows up in official statistics. A cyclical reading centered on growth and prices therefore systematically mistakes symptoms for causes. Placing the credit cycle back at the start of the chain restores a coherent causal sequence between financing, real activity, and markets. Related Q&A: reading the credit and business cycles together.
A mechanism that fires before the visible symptoms
The current cycle illustrates the point with unusual clarity. After several quarters of policy rates held high by the Federal Reserve and the European Central Bank, financing conditions have tightened well before activity has fully responded. The lag between monetary tightening and the observable slowdown is not an anomaly — it is the credit cycle running its normal course.
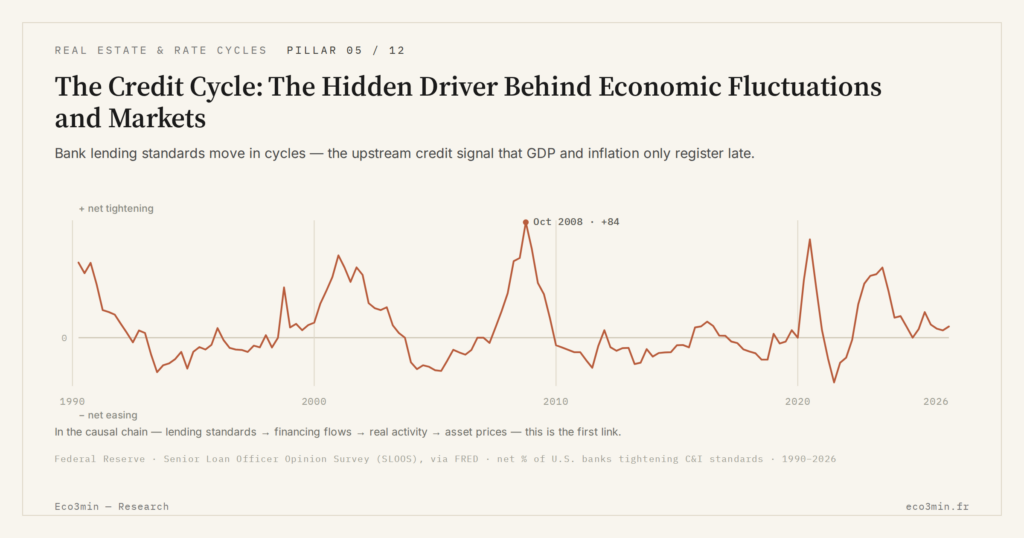
Bank surveys confirm the tightening already in place. According to the ECB’s Bank Lending Survey (January 2025), euro area banks continued to tighten standards on corporate loans in the fourth quarter of 2024, with a net 7% of institutions reporting tighter conditions. The Federal Reserve’s Senior Loan Officer Opinion Survey (January 2025) reports a similar dynamic in the United States: moderate to modest net shares of banks tightened standards on commercial and industrial loans.
The credit cycle is read through volumes, lending standards, and balance sheet composition — not through policy rates alone or published activity indicators.
Credit as the initial impulse
Credit creation does not accompany activity. It precedes it and makes it possible. When a bank grants a loan, it simultaneously creates a deposit in the borrower’s account — endogenous money creation in its operational form. That capacity allows agents to spend ahead of current income, invest before saving the amount required, or bring future resources forward into current consumption.
The resulting impulse propagates through the economy. Corporate investment picks up, durable goods demand rises, and asset prices appreciate. According to the BIS long-run series on credit to the non-financial private sector, the credit-to-GDP ratio in advanced economies (United States, euro area, Japan, United Kingdom, Canada, Australia, Switzerland, Nordic countries) moved from roughly 165% in Q1 2010 to nearly 180% at the end of 2021. That expansion preceded and supported the recovery that followed the 2008 financial crisis — it did not merely accompany it.
The credit cycle and its propagation to housing works as an amplifier of expectations. In expansionary phases, optimism converts into higher financing demand, validated by banks whose balance sheets improve and whose risk appetite rises. In contractionary phases, the mechanism reverses — often with a brutality past observations make foreseeable, but that consensus consistently underweights. The real-rate channel behind property valuation takes this up from another angle. The dynamic is most visible in residential markets, where lending conditions drive price formation directly, as detailed in why real estate prices rise and fall with credit.
The causal sequence: from financing to prices
Credit does not react passively to activity. It conditions activity through an identifiable four-step sequence. Lending standards shift first: eligibility criteria, spreads over benchmark rates, and collateral requirements. Financing flows follow, affecting productive, real estate, and financial investment with a lag of several quarters. Real activity reacts in the third stage, before asset prices absorb the dynamic — sometimes with delay, sometimes through excessive anticipation.
That sequence is why the standard cyclical indicators — GDP, inflation, unemployment — behave as lagging variables. They measure consequences, not causes. The leading signal sits in the credit dynamic itself: in the shifts of bank lending surveys on credit conditions (Bank Lending Survey from the ECB, Senior Loan Officer Survey from the Fed), in new loan volumes, and in portfolio quality as measured by non-performing loan ratios.
Reading GDP growth as a sign of underlying strength without checking whether it rests on a sustainable credit expansion or on debt accumulation. Distinguishing nominal momentum from genuine value creation is the entry point of any reliable forecast.
Why consensus underestimates the lag
A large share of mainstream macro forecasts assumes a rapid and broadly linear transmission of monetary policy. Standard models expect a policy rate hike to slow activity within 12 to 18 months — an estimate that dates back to Milton Friedman’s 1960s work on “long and variable lags.” That range remains the reference point for central bankers themselves: Atlanta Fed President Raphael Bostic said in November 2022 that it could take “18 months to two years or more” for monetary tightening to bite on inflation, while Governor Christopher Waller estimated in January 2023 that the lag could compress to 9 to 12 months.
That historical average masks a far more granular reality. The actual transmission speed depends on several structural variables: household and corporate balance sheet composition, the maturity of outstanding debt, the share of fixed-rate versus variable-rate borrowing, and banks’ capacity to absorb shocks without sharply restricting credit supply. In the euro area, where fixed-rate mortgages dominate, tightening takes longer to surface than in the United States, where variable rates and mortgage refinancing transmit policy changes more quickly. The long-run evolution is traced in our US consumer loan delinquency dataset. Related analysis: ETF liquidity and the hidden credit fragilities it masks.
That asymmetry produces a recurring misreading: the economy looks resilient while financing conditions deteriorate underneath. The eventual reversal looks abrupt at the surface, but it is the closing chapter of a process that began several quarters earlier. The way banks amplify the credit cycle clarifies this procyclical dynamic and the destabilising sequence it can trigger.
Leverage and the transmission to valuations
Financial and real estate asset prices reflect more than expected future income. They also reflect — and at times primarily reflect — investors’ capacity to borrow in order to acquire those assets. The link between credit and asset prices runs through financial leverage, which amplifies exposure to risk assets when financing is cheap and abundant.
Between March 2020 and the end of 2021, central bank balance sheets expanded at an unprecedented pace. According to Federal Reserve data, total assets rose from $4.2 trillion in January 2020 to roughly $8.9 trillion at their early-2022 peak — an increase of nearly $4.7 trillion. For the Eurosystem, the consolidated balance sheet grew from €4.671 trillion at the end of 2019 to €8.566 trillion at the end of 2021, according to the ECB’s annual financial statements — an expansion of close to €3.9 trillion, driven by the pandemic emergency purchase programme (PEPP) and the asset purchase programme (APP).
That liquidity injection coincided with sharp gains in equity markets and residential real estate across most advanced economies. The contraction starting in 2022, with quantitative tightening and rising rates, partially reversed the dynamic. By early 2026, the Fed’s balance sheet had dropped back to roughly $6.5–6.9 trillion, while the Eurosystem’s stood near €6.3 trillion — a reminder that valuations depend on financing conditions as much as on underlying fundamentals.
The limits of a strictly monetary reading
Focusing on policy rates alone leaves out the quantitative dimension of credit. A low rate does not guarantee lending expansion if banks simultaneously tighten standards — as happened after 2008 in several advanced economies. Conversely, high rates can coexist with supportive credit supply when bank balance sheets remain strong and financing demand holds up.
The economic cycle therefore cannot be read through rates alone. Credit dynamics — volumes, portfolio quality, and sectoral distribution — give a more reliable measure of the real impulse passing through to the economy. The leading signals of future turning points sit in those series, even though they attract less attention than central bank decisions.
The credit cycle is the primary causal variable behind economic fluctuations. GDP, employment, and inflation measure its delayed consequences. A rigorous macro reading starts with financing flows, not with their visible effects.
Last updated — 18 July 2026
Disclaimer – Financial Information: The analyses, commentary, and content published on eco3min.fr are provided for informational and educational purposes only. They do not constitute investment advice or a solicitation to buy or sell financial instruments. Past performance is not indicative of future results. All investment decisions involve risk and are the sole responsibility of the reader.
Read next
Full pillar →US Rental Property Real Yield: What Cap Rate and NOI Actually Leave You
A rental listing leads with a yield. Divide the annual rent by the price and the number looks…
Cap Rate Spread: What Rental Yield Pays Over the 10-Year Treasury
A 5% cap rate sounds attractive. But 5% against what? A risk-free 10-year Treasury yields near 4.5% in…
Vacancy and Turnover: The Cost That Erodes a Landlord’s Real Return
A listing shows full rent, twelve months a year. The owner knows the gaps between tenants, the make-ready…