
Gold-Copper Ratio: 620 Months Ranked Since 1975, and Why the Historical Average Is Not One Number
One ounce of gold bought 855 pounds of copper in February 2026, more than in any month since 1975.
The copper-gold ratio, 620 months, January 1975 to August 2026
Two dashed lines, one historical average, counted from two different years. The gap between them is the subject of this study.

Source: World Bank Commodity Price Data, the Pink Sheet, monthly averages. Chart: Eco3min Research.
A ranked file of 800 monthly observations, both notations of the ratio in the same columns, and the measurement that most published charts of this ratio get wrong.
The gold-copper ratio, also written copper-gold ratio, compares the price of an industrial metal with the price of a monetary one. In August 2026 the copper price was 14,326 US dollars a tonne and the gold price 4,411 US dollars a troy ounce, which puts the ratio at 1.473 and one ounce of gold at 679 pounds of copper. The lowest reading of the 620 months since January 1975 was February 2026, at 1.170, or 855 pounds of copper an ounce. This page ranks every month in the record, publishes the file behind it, and tests how much of that ranking depends on where the count begins. Where the count begins is also a question of regime, and the commodity regimes framework, from physical constraints to global cycles, is one way of choosing the window.
TL;DR
One ounce of gold bought 855 pounds of copper in February 2026, more than in any month since 1975.
- The ten lowest months of the copper-gold ratio are the same ten months, in the same order, whether the count starts in 1960, 1971, 1975, 1980, 1990, 2000, 2010 or ten years ago. All ten fall between April 2025 and April 2026.
- The historical average is not similarly stable. Across those same eight start dates it ranges from 1.924 to 4.745, a factor of 2.47. The median is steadier and still moves by 1.43.
- April 2020, the month the ratio is most often asked about, was a genuine record when it printed. It now ranks 15th of 620 and has been beaten fourteen times, first in April 2025.
- Robustness, disclosed rather than buried: the record month swaps between February and March 2026 depending on which gold benchmark is used, because the two are 0.009 percent apart. The set of ten lowest months does not change.
Scope note: this page measures where a reading sits in its own distribution. It does not assess what the ratio implies, which is the subject of a separate study linked below. Full method in the methodology, caveats in the limitations.
Latest observation
Copper-gold ratio
1.473
August 2026, monthly average
Pounds of copper per ounce of gold
679
the same fact, written the other way round
Rank in the record
24 of 620
months since January 1975, lowest first
Percentile since 1975
3.87
computed on data available at the date
Copper 14,326 US dollars a tonne, gold 4,411 US dollars a troy ounce, both World Bank Pink Sheet monthly averages for August 2026. Updated monthly.
Executive summary
Six findings
- One ounce of gold bought 855 pounds of copper in February 2026, more than in any month since 1975.
- The ranking is indifferent to the start date. The ten lowest months of the copper-gold ratio are identical, and identically ordered, from all eight start dates tested, including a window that only covers the last ten years.
- The average is not. It ranges from 1.924 counting from September 2016 to 4.745 counting from January 1960, a factor of 2.47. Drop the years when gold was an administered price and it still moves by 1.59. Anyone quoting a single historical average for this ratio is quoting their own start date.
- April 2020 is the month the search traffic asks about, and it was a record when it printed, beating September 1980. It now ranks 15th of 620 and 14 months have printed lower, the first in April 2025.
- The 2020s are not simply a low decade. Their median month, 1.861, sits below the lowest month of the entire 1990s, 1.978, and 54 of their 80 months do the same.
- The file behind this page carries 800 monthly observations from January 1960, both notations of the ratio, five percentile columns, four competing averages and the gold price regime, so the ranking can be recomputed on any window. CC BY 4.0.
The record in six numbers
1.170
lowest month, February 2026
6.350
highest month, August 1976
2.410
median of the 620 months
2.47x
spread of the eight candidate averages
415
median pounds of copper per ounce of gold
401
months without a lower reading, at the March 2020 peak of that count
Where the reading sits
The copper-gold ratio divides the copper price by the gold price. Both legs come from the World Bank Pink Sheet, which has published monthly averages of both since January 1960, so the series needs no splicing across providers and no deflator: it is a relative price, and the currency cancels.
Over the 620 months from January 1975, the ratio ranges from 1.170 to 6.350, a span of 5.43 times, which is why the chart above is drawn on a log scale. The median month is 2.410. August 2026 reads 1.473 and ranks 24th from the bottom.
The interesting part is what sits underneath it. The fourteen lowest months of the whole record are the fourteen consecutive months from April 2025 to May 2026, and the fifteenth is April 2020. Read the other way round, one ounce of gold has bought more than 745 pounds of copper in fourteen separate months since April 2025, and had never done so in the fifty years before.
What the chart shows
The ratio has drifted down across five decades, and the drift is what makes a single historical average meaningless. The dashed line at 2.620 is the average of every month since 1975. The dashed line at 1.924 is the average of the last ten years. Both are correct. They are 36 percent apart.
Why the average moves and the rank does not
The dominant way to read a ratio like this one is against its historical average. It is the natural instinct, it is what a mean-reverting series invites, and it is how the gold-silver ratio is usually presented, with some justification: that pair has spent long stretches oscillating around a level. The copper-gold ratio invites the same treatment, and search traffic shows readers asking for exactly that number.
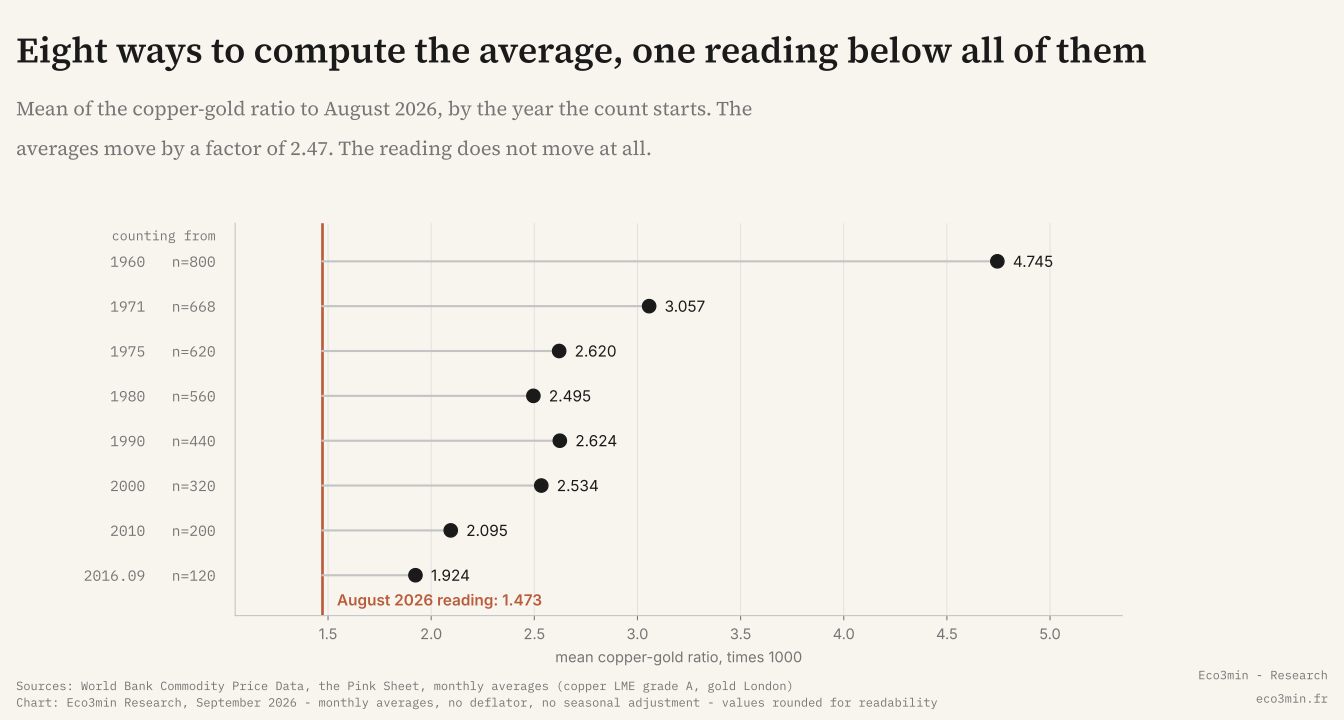
The number does not exist. Counting from January 1960 the mean is 4.745. From January 1971, the year the dollar left gold, it is 3.057. From January 1975 it is 2.620, from January 1990 it is 2.624, from January 2000 it is 2.534, from January 2010 it is 2.095, and over the trailing ten years it is 1.924. The largest of those is 2.47 times the smallest. Exclude the years when gold was fixed by treaty rather than by trade and the remaining seven still span a factor of 1.59. The median is better behaved and still moves by 1.43.
Eight ways to compute the average, one reading below all of them
Every dot is a defensible historical average. The August 2026 reading of 1.473 sits below all eight.
Source: World Bank Commodity Price Data, the Pink Sheet. Chart: Eco3min Research.
Now run the same test on the ranking. Take the ten lowest months of the copper-gold ratio counting from 1960. Then from 1971, 1975, 1980, 1990, 2000, 2010, and from September 2016, a window that holds only 120 months. The answer is the same ten months every time, in the same order: February and March 2026, then November, October, September and December 2025, then January and April 2026, then April and August 2025. The agreement extends to the fifteen lowest and breaks at the seventeenth, for a mechanical reason: the trailing ten-year window cannot contain September 1980.
That asymmetry is the finding. A mean summarises a level, and a series with a five-decade drift has no stable level to summarise. A rank summarises a position, and a position survives the drift. It is the same reason the raw copper-gold ratio dataset is more useful than any single statistic drawn from it.
What this dataset does not measure
Neither leg is the same good in 1975 and in 2026. Copper’s demand has shifted toward electrification and grid investment, and gold’s marginal buyer has shifted toward official reserve managers. The ratio is a relative price, not a constant-quality index, and nothing in the file corrects for that. Copper is also at its highest monthly nominal price on record in August 2026, at 14,326 US dollars a tonne, in the same year the ratio prints its low, which is a useful reminder that a low ratio is not a statement about copper. Why both legs moved is the subject of the copper-gold ratio as a macro signal, and this page does not duplicate it.
What the ranking does not say
A rank is a position in a distribution, and a distribution is not a mechanism. Three qualifications belong on the page rather than in a footnote.
The first is the near-tie. February 2026 reads 1.1702 and March 2026 reads 1.1703. They are 0.009 percent apart, which is inside the rounding the Pink Sheet applies to its current vintage. Recompute the whole series with LBMA gold instead of Pink Sheet gold and the two swap places: March becomes the record at 1.169. Every other conclusion on this page survives that substitution unchanged, including the identity of the ten lowest months, the rank of April 2020 and the average since 1975, which moves from 2.6204 to 2.6203. The record is a plateau, and the honest sentence is that the ratio has spent a year at levels it never reached before, not that one particular month is special.
The second is that a record low in a ratio can be produced entirely by its denominator. That is the case here, it is documented at length in the macro signal study, and this page takes it as given rather than re-deriving it. The consequence for the measurement is direct: the ranking on this page describes the ratio, and the ratio alone.
The third is that the ratio has behaved as its users expect at the two moments those users cite most. It reached what was then a record low in April 2020, within weeks of the deepest point of the pandemic shock, and it sat in its bottom decile through the 1979 to 1981 episode. A measurement page that only reported the awkward result would be selecting evidence as surely as one that only reported the flattering one.
Explore the record
The argument above rests on a claim that is easier to test than to read: that the average you get depends on the window you pick, and the rank does not. The module below lets you pick the window. Drag either handle to change the start and end of the sample, and the mean, the median and the rank of the highlighted month are recomputed on that window alone.
The module reads the published CSV directly. If it does not load, the decade chart above is the static equivalent of its default view.
The supplementary view, on a linear scale
The hero chart is drawn on a log scale because the ratio spans 5.43 times over the window, above the threshold at which a linear axis compresses the early decades into a single band. The decade view below is the linear complement: it drops the time axis entirely and shows each decade as the range between its lowest and its highest month.
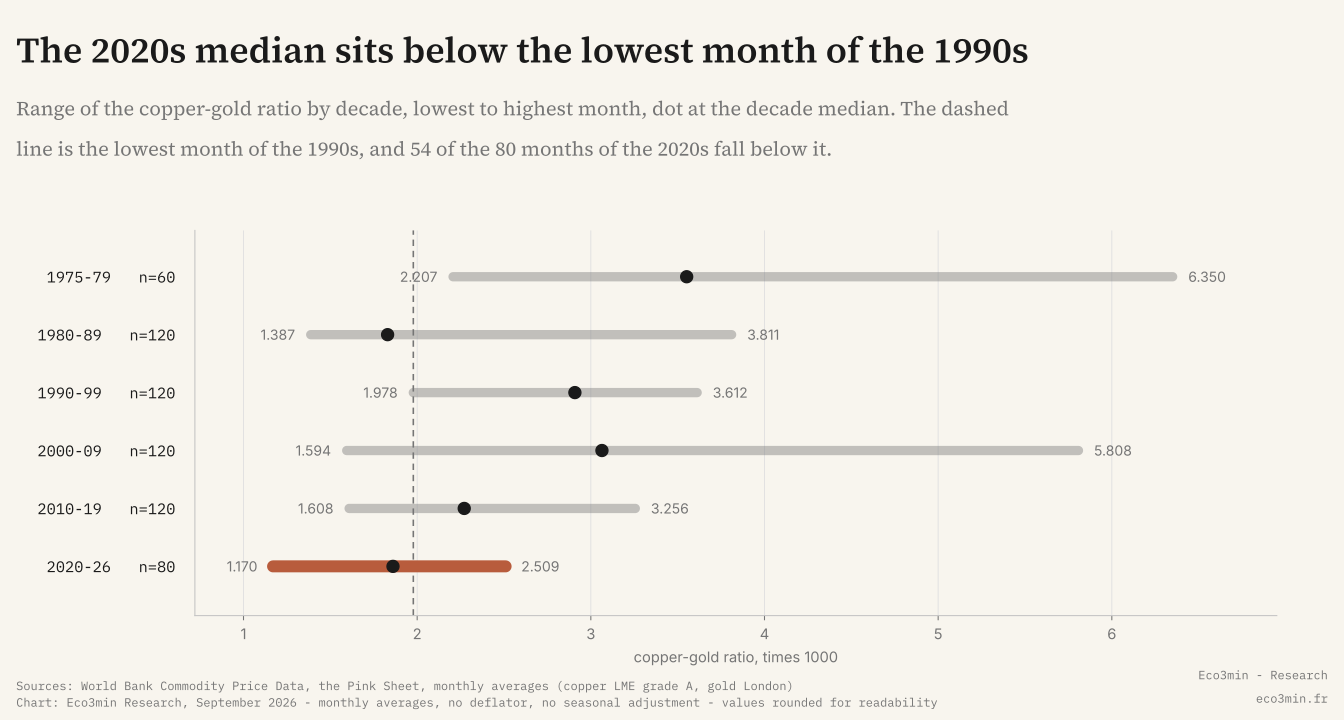
The 2020s median sits below the lowest month of the 1990s
Each bar runs from the decade’s lowest month to its highest. The dot is the decade median. The dashed line is the 1990s floor.
Source: World Bank Commodity Price Data, the Pink Sheet. Chart: Eco3min Research.
Two decades overlap the 2020s from above. The 1980s reach down to 1.387 and the 2010s to 1.608, so the current decade is not alone at the bottom of the range. What separates it is the concentration: its median is lower than the floor of the 1990s, and 54 of its 80 months are.
Forward distribution
The relation most often attached to this ratio is with the US 10-year Treasury yield, so the file carries that yield and its forward changes at six and twelve months, alongside the ratio’s own forward return. The table below is conditional on the expanding percentile, which uses only information available at the date, never the ex-post rank.
| Percentile bucket | Months | Episodes | Median 10y move, 12m | P25 to P75 | Share positive | Median ratio return, 12m |
|---|---|---|---|---|---|---|
| 0 to 10 | 67 | 13 | +82 bp | +45 to +160 bp | 86.6% | +13.7% |
| 10 to 25 | 97 | n/a | +31 bp | −40 to +87 bp | 58.8% | +1.2% |
| 25 to 75 | 341 | n/a | −29 bp | −98 to +52 bp | 38.7% | −3.9% |
| 75 to 90 | 53 | n/a | −39 bp | −91 to +35 bp | 37.7% | −16.3% |
| 90 to 100 | 50 | n/a | −38 bp | −73 to −3 bp | 22.0% | −5.2% |
The caveat is larger than the table. The 79 months that fall in the lowest bucket are not 79 independent observations: they come from 13 contiguous episodes, and the largest single episode, August 2024 to August 2026, is 31.6 percent of the bucket. Counted by episode rather than by month, 11 of the 13 had a positive median 12-month move in the 10-year yield, which is a weaker statement resting on a much smaller sample than the month count suggests. The windows also overlap, so consecutive rows share most of their forward period.
Eight of the 20 months since January 2025 have a complete 12-month forward window, so the current episode contributes to the table only in part. Past distributions are not predictive of future outcomes. Regime-conditional statistics describe historical patterns, not expected returns. Whether the relation between this ratio and the 10-year yield still holds is examined in the macro signal study, and this page takes no position on it.
Levels to watch
Below 1.170
If a month prints below the February 2026 low, the plateau extends rather than ends, and the count of months without a lower reading resets to zero for the second time in the record.
Above 1.978
A month above the 1990s floor would be the first since April 2023 to leave the range in which 54 of the 80 months of this decade have sat. It would move the reading out of the bottom decile of the expanding distribution.
At 2.620
Returning to the average since 1975 from the August 2026 reading would take a 78 percent rise in copper at an unchanged gold price, or a 44 percent fall in gold at an unchanged copper price. The arithmetic is symmetric and neither branch is a forecast.
Next release
The World Bank publishes the Pink Sheet monthly, in the first business days of the month, with the previous month’s average. The file on this page is rebuilt from it.
Decade and episode tables
| Period | Months | Lowest | Median | Highest | Median pounds of copper per ounce of gold |
|---|---|---|---|---|---|
| 1975 to 1979 | 60 | 2.207 | 3.552 | 6.350 | 282 |
| 1980 to 1989 | 120 | 1.387 | 1.830 | 3.811 | 547 |
| 1990 to 1999 | 120 | 1.978 | 2.908 | 3.612 | 344 |
| 2000 to 2009 | 120 | 1.594 | 3.064 | 5.808 | 326 |
| 2010 to 2019 | 120 | 1.608 | 2.271 | 3.256 | 440 |
| 2020 to August 2026 | 80 | 1.170 | 1.861 | 2.509 | 537 |
| Rank | Month | Copper-gold ratio | Pounds of copper per ounce of gold | Copper, USD/tonne | Gold, USD/oz |
|---|---|---|---|---|---|
| 1 | February 2026 | 1.170 | 855 | 12,951 | 5,020 |
| 2 | March 2026 | 1.170 | 855 | 12,529 | 4,856 |
| 3 | November 2025 | 1.200 | 833 | 10,812 | 4,087 |
| 4 | October 2025 | 1.200 | 833 | 10,740 | 4,058 |
| 5 | September 2025 | 1.235 | 810 | 9,984 | 3,668 |
| 6 | December 2025 | 1.241 | 806 | 11,785 | 4,309 |
| 7 | January 2026 | 1.242 | 805 | 13,012 | 4,753 |
| 8 | April 2026 | 1.244 | 804 | 12,951 | 4,721 |
| 9 | April 2025 | 1.294 | 773 | 9,177 | 3,218 |
| 10 | August 2025 | 1.302 | 768 | 9,670 | 3,368 |
| 11 | May 2025 | 1.307 | 765 | 9,533 | 3,309 |
| 12 | July 2025 | 1.327 | 754 | 9,771 | 3,340 |
| 13 | June 2025 | 1.331 | 751 | 9,835 | 3,353 |
| 14 | May 2026 | 1.339 | 747 | 13,543 | 4,587 |
| 15 | April 2020 | 1.363 | 734 | 5,058 | 1,683 |
Ranks 1 to 10 are identical under all eight start dates tested. Ranks 1 to 15 are too. The set of ten is also unchanged when gold is taken from the LBMA benchmark instead of the Pink Sheet, though ranks 1 and 2 swap.
Historical turning points
August 1976, the high. The ratio reads 6.350, with copper at 1,539 US dollars a tonne and gold at 110 US dollars a troy ounce. One ounce of gold bought 157 pounds of copper, the least of the whole window. Gold had been freely traded for five years and had not yet begun the run that would take it above 600 dollars by 1980.
September 1980, the first low that stood. The ratio reads 1.387, with copper at 2,060 dollars a tonne and gold at 674 dollars an ounce. It held the record for the lowest month for nearly forty years, and it is the reason the trailing ten-year window disagrees with the longer ones beyond rank sixteen: a ten-year window ending in 2026 cannot see 1980.
April 2020, the record the search traffic remembers. The ratio reads 1.363, with copper at 5,058 dollars a tonne and gold at 1,683 dollars an ounce, and the 10-year yield at 0.66 percent. It beat September 1980 and became the lowest month since 1975, at the 0.18th percentile of the data available at the time. It stood for five years.
April 2025, when it fell. The ratio reads 1.294, the first month to print below April 2020. Copper is at 9,177 dollars and gold at 3,218 dollars. Note the direction of both legs: copper is 81 percent above its April 2020 level and gold is 91 percent above its own. The record did not come from a collapse in either price.
February 2026, the current low. The ratio reads 1.170, with copper at 12,951 dollars a tonne, gold at 5,020 dollars an ounce and the 10-year yield at 4.13 percent. Gold’s highest monthly average of the record and a copper price 156 percent above April 2020 produce the lowest ratio of the record.
August 2026, the latest observation. The ratio reads 1.473, with copper at 14,326 dollars a tonne, its highest monthly average in the file, and gold at 4,411 dollars an ounce. The reading is 26 percent above the February low and 44 percent below the average since 1975, and it ranks 24th of 620. Two months separate it from the last lower reading.
Methodology
The ratio. The copper price in US dollars a tonne is converted to dollars a pound at 2,204.622621848776 pounds a tonne, then divided by the gold price in US dollars a troy ounce and multiplied by 1000. The inverse column, gold_copper_ratio_lb, is the gold price divided by the copper price in dollars a pound, and reads directly as pounds of copper per ounce of gold. The two are reciprocal by construction and the file asserts it.
copper_gold_ratio = (copper_usd_mt / 2204.622621848776) / gold_usd_oz * 1000
gold_copper_ratio_lb = gold_usd_oz / (copper_usd_mt / 2204.622621848776)
Frequency, and why it is monthly. Monthly, because no daily copper series with fifty years of depth exists from a source that can be redistributed under CC BY 4.0. This is disclosed in the direction that hurts: averaging within the month compresses extremes, so a daily series would probably make both the 2026 low and the 1980 low deeper, not shallower. The ranking of monthly averages is a ranking of monthly averages.
Why the analysis window starts in January 1975. The published file starts in January 1960 and carries a gold_regime column, so the choice can be reversed by the reader. Gold was an administered price at 35 dollars an ounce until the London Gold Pool collapsed in March 1968, and only fully market-determined after the United States closed the gold window in August 1971. Private ownership of gold became legal for US residents on 31 December 1974. The file marks 98 months as pegged, 41 as two_tier and 661 as floating. The analysis window takes the 620 months from January 1975. It makes no difference to the ranking: the ten lowest months are the same from 1960.
Percentiles. Every percentile column is computed on information available at the date. pct_expanding_1975, pct_expanding_1990 and pct_expanding_2000 rank a month within the months elapsed since their start. pct_trailing_10y and pct_trailing_20y rank it within the trailing 120 and 240 months. The single ex-post column is named rank_asc_1975_expost and is never used to form a bucket in the forward table.
The four competing averages. mean_since_1975, mean_since_1990, mean_since_2000 and mean_trailing_10y record, at every date, what a reader would obtain as the historical average given the start date they happened to pick. mean_dispersion_x is the largest of the four divided by the smallest, and it reads 1.364 in August 2026. The eight-way comparison quoted on this page extends the same idea to eight start dates and is computed on the full file.
Filter definitions
- Analysis window:
date >= 1975-01-01, 620 months. - Published file:
date >= 1960-01-01, 800 months. - The eight start dates:
date >=1960-01-01, 1971-01-01, 1975-01-01, 1980-01-01, 1990-01-01, 2000-01-01, 2010-01-01 and 2016-09-01, all ending 2026-08-01, with 800, 668, 620, 560, 440, 320, 200 and 120 months respectively. - The window the search query names:
2020-01-01 <= date <= 2024-12-01, 60 months. - The current run:
date >= 2025-01-01, 20 months. - Floating gold:
gold_regime == 'floating', from August 1971, 661 months. - Lowest bucket of the forward table:
date >= 1975-01-01 and pct_expanding_1975 < 10, 79 months, of which 67 have a complete 12-month forward window.
Sensitivity, four tests. First, the start date: the mean moves by a factor of 2.47 across the eight windows, the median by 1.43, and the ten lowest months not at all. Second, the gold benchmark: recomputing the ratio with the LBMA afternoon price instead of Pink Sheet gold leaves the set of ten lowest months unchanged, swaps ranks 1 and 2, leaves April 2020 at rank 15 and moves the mean since 1975 from 2.6204 to 2.6203. Third, the unit basis: computing the ratio directly as dollars a tonne over dollars an ounce, without the pound conversion, gives February 2026 as the lowest month, as the published basis does. Fourth, rounding: the September 2026 Pink Sheet vintage rounds prices to the unit, and the largest combined effect that can have on any month of the analysis window is 0.4873 percent, in August 1976.
The two vintages. The January 2025 vintage of the Pink Sheet carries full decimal precision through December 2025; the September 2026 vintage rounds every price to the unit but extends to August 2026. The file uses the first through December 2025 and the second thereafter. The 792 overlapping months are asserted to agree within 0.5 units on both legs before the build proceeds, which is exactly the rounding and no more. Pink Sheet monthly prices are historical averages of quoted prices and are not revised.
Cross-check against the issuers. Pink Sheet gold against the LBMA afternoon benchmark, resampled to monthly means over 701 common months: median relative gap 0.0011 percent, 95th percentile 0.182 percent, and four months above 1 percent, all between December 1980 and November 1985, when the Pink Sheet drew on legacy sources. Pink Sheet copper against the IMF global copper price over 415 common months from January 1992: median relative gap 0.0515 percent, 95th percentile 0.419 percent, two months above 1 percent. The IMF series is used as a control and is never redistributed, because it carries the marker “Copyrighted: Citation Required” on FRED.
Reproduction. The two Pink Sheet workbooks, the LBMA series and the 10-year yield are all public. The ranking reduces to four lines.
# start from the published CSV
d = pd.read_csv('e3m-gold-copper-rank.csv', parse_dates=['date']).set_index('date')
w = d.loc['1975-01-01':].copper_gold_ratio
print(w.nsmallest(10).index.strftime('%Y-%m').tolist())
print({s: round(d.loc[s:].copper_gold_ratio.mean(), 4) for s in ['1960', '1975', '2000', '2010']})
| Column | Unit | Source or calculation |
|---|---|---|
copper_usd_mt, gold_usd_oz | USD per tonne, USD per troy ounce | World Bank Pink Sheet, monthly averages |
copper_gold_ratio | index, times 1000 | copper per pound divided by gold per ounce |
gold_copper_ratio_lb | pounds of copper | the reciprocal, per ounce of gold |
gold_regime | label | pegged, two_tier, floating |
pct_expanding_*, pct_trailing_* | percentile | rank within data available at the date |
rank_asc_1975_expost | rank | full-sample rank, lowest first, ex post |
months_since_lower_1975 | months | months since a strictly lower reading |
mean_since_*, mean_trailing_10y, mean_dispersion_x | index, ratio | the four competing averages and their spread |
us10y_pct, us10y_fwd_*_bp | percent, basis points | FRED GS10 and its forward changes |
cg_fwd_6m_pct, cg_fwd_12m_pct | percent | forward return of the ratio |
The underlying series are published as standing datasets: the copper-gold ratio dataset, the copper price history and the gold price history.
Data sources and references
- World Bank, Commodity Price Data (the Pink Sheet), monthly prices workbook, vintages of January 2025 and September 2026. Copper is LME grade A settlement, gold is the London price, spot average of daily rates from June 2025 and the London afternoon fixing before that. Both series begin in January 1960. CC BY 4.0.
- London Bullion Market Association, LBMA Gold Price PM, daily, from 1 April 1968. Used as the independent second gold benchmark in the robustness test, resampled to monthly means.
- Board of Governors of the Federal Reserve System, H.15 selected interest rates, 10-year Treasury constant maturity, monthly, via FRED series GS10. Public domain.
- International Monetary Fund, global price of copper, via FRED series PCOPPUSDM. Used only as a cross-check on the copper leg and not redistributed, because the series carries the FRED marker “Copyrighted: Citation Required”.
- Erb, C. B., and Harvey, C. R. (2013), “The Golden Dilemma”, Financial Analysts Journal 69(4), 10 to 42. On the instability of any long-run anchor for the real gold price, which is the argument this page reaches from the ratio side.
- Harvey, D. I., Kellard, N. M., Madsen, J. B., and Wohar, M. E. (2010), “The Prebisch-Singer Hypothesis: Four Centuries of Evidence”, Review of Economics and Statistics 92(2), 367 to 377, together with the authors’ subsequent erratum correcting data construction errors. On secular trends in primary commodity prices, and on why a trending series resists summary by a mean.
- National Bureau of Economic Research, business cycle expansions and contractions, used only to date the episodes named in the turning points section.
Limitations
- Monthly averaging compresses extremes. Every reading is a monthly average of daily quotes. A daily series would very likely show deeper lows in both 2026 and 1980. The ranking is a ranking of monthly averages and nothing more.
- Neither leg is a constant-quality good. Copper’s end uses and gold’s marginal buyer have both changed across fifty years. The ratio is a relative price, not an index of like for like, and the file makes no adjustment for it.
- The record is a plateau, not a point. February and March 2026 are 0.009 percent apart and swap order under a different gold benchmark. Treating any single month as the record overstates the precision of the data.
- Two vintages, one series. The published file splices the January 2025 and September 2026 vintages of the same World Bank workbook because the newer one rounds to the unit. The overlap is asserted to agree within rounding, but it is a splice, and it is the one place the file departs from a single download.
- The 1980s gold gap. The Pink Sheet and the LBMA benchmark disagree by more than 1 percent in four months between December 1980 and November 1985. Those months sit at ranks 17 and beyond, so they do not touch the headline, and early-1980s work is best done with both sources side by side.
- The forward table rests on 13 episodes. The lowest percentile bucket holds 79 months drawn from 13 contiguous episodes with overlapping forward windows. The month count overstates the evidence by roughly a factor of five.
- The current decade is incomplete. The 2020s row covers 80 months to August 2026, not 120, and its statistics will change as the decade finishes.
Frequently asked questions
What is the historical average of the gold-copper ratio?
There is no single answer, and that is the finding of this page rather than an evasion. Counting monthly averages to August 2026, the mean of the copper-gold ratio is 4.745 from January 1960, 3.057 from January 1971, 2.620 from January 1975, 2.624 from January 1990, 2.534 from January 2000, 2.095 from January 2010 and 1.924 over the trailing ten years. The largest is 2.47 times the smallest. If a single number is required, the median of the 620 months since 1975 is 2.410, or 415 pounds of copper per ounce of gold, and it only means something quoted with its window attached.
Was the gold-copper ratio at a historical high in 2020 to 2024?
Yes at the time, and no longer. April 2020 pushed the gold-copper ratio to 734 pounds of copper an ounce, which beat September 1980 and was the highest of any month since 1975. It has since been passed fourteen times, first in April 2025, and the current high is February 2026 at 855 pounds. Measured the other way round, April 2020’s copper-gold ratio of 1.363 now ranks 15th of 620 months.
Does the answer change if the data starts in 1990 or 2000 instead of 1975?
Not for the ranking. The ten lowest months of the copper-gold ratio are the same ten months, in the same order, whether the count starts in 1960, 1971, 1975, 1980, 1990, 2000, 2010, or ten years ago. The agreement holds to the fifteenth lowest month and breaks at the seventeenth for a mechanical reason: a trailing ten-year window cannot contain September 1980. The average, by contrast, changes with every one of those choices.
Why is the ratio not adjusted for inflation?
No deflator is needed for the ratio itself. It is one dollar price divided by another dollar price on the same date, so the currency cancels and a common deflator would cancel with it. Deflating matters for each leg taken alone, which is why the copper price and the gold price are published as separate columns in the file rather than only as their quotient.
Does a record low copper-gold ratio mean copper is cheap?
The data does not support that reading. Copper’s August 2026 monthly average of 14,326 US dollars a tonne is the highest in the file, in the same year the ratio prints its lowest month. A ratio can reach a record through either leg, and this page measures the position of the quotient in its own history rather than the level of either metal. What moved and why is examined in the copper-gold ratio as a macro signal.
Why is the series monthly rather than daily, and why does it stop in August 2026?
Monthly because no daily copper series with fifty years of depth is available from a source that can be redistributed under CC BY 4.0, and a fifty-year ranking is the point of the exercise. August 2026 because that is the last month in the September 2026 vintage of the World Bank Pink Sheet, which publishes the previous month’s average in the first business days of each month.
What is in the downloadable file?
800 monthly rows from January 1960 to August 2026 and 26 columns: the copper and gold prices, both notations of the ratio, the gold price regime, five percentile columns computed on data available at the date, the ex-post rank, the count of months since a lower reading, four competing historical averages with their dispersion, the US 10-year yield and four forward columns. Released under CC BY 4.0.
How to cite
Eco3min Research (2026), Gold-Copper Ratio: 620 Months Ranked Since 1975, and Why the Historical Average Is Not One Number, https://eco3min.fr/en/gold-copper-ratio-historical-average-and-rank/, data through August 2026, CC BY 4.0.
Last updated — 18 September 2026
Disclaimer – Financial Information: The analyses, commentary, and content published on eco3min.fr are provided for informational and educational purposes only. They do not constitute investment advice or a solicitation to buy or sell financial instruments. Past performance is not indicative of future results. All investment decisions involve risk and are the sole responsibility of the reader.