
What income puts a US household in the top 10% or the top 5%?
A US household needed $261,300 in 2025 to reach the top 10% and $354,000 for the top 5%, per the Census Bureau. How both thresholds have moved since 1967.
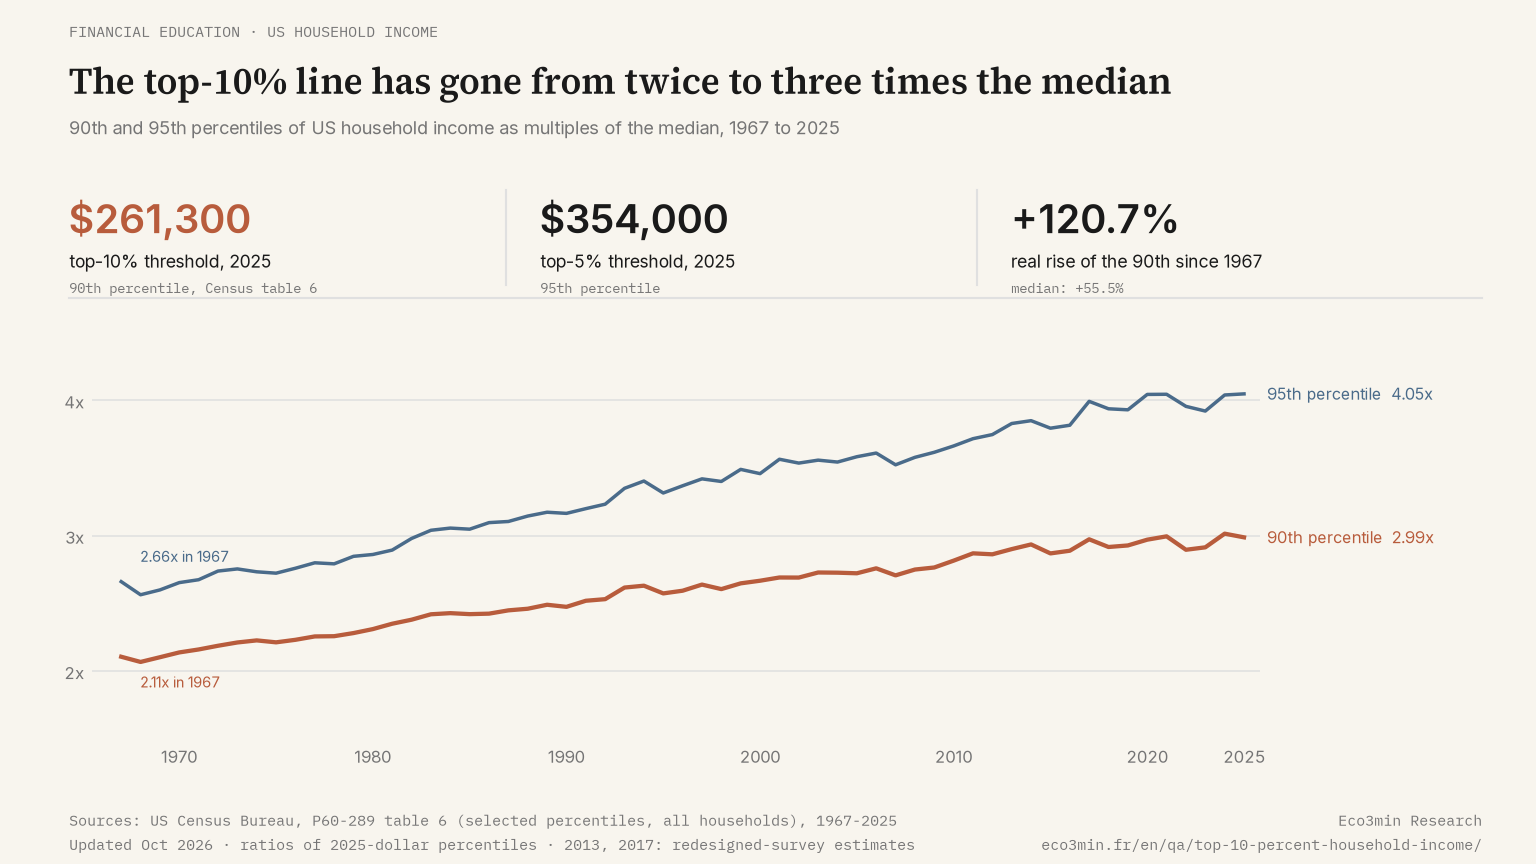
A US household needed a pre-tax income of $261,300 in 2025 to reach the top 10% and $354,000 to reach the top 5%, according to the Census Bureau. Both thresholds come from a ranking of whole households, all members’ income combined and capital gains excluded, and stand at three and four times the median of $87,460. Three in four households above the top-10% line count two or more earners, and the threshold has more than doubled in real terms since 1967 while the median rose 55.5%.
In this article
The short answer
$261,300 for the top 10%, $354,000 for the top 5%. Those are the 90th and 95th percentiles of US household income in 2025, published in table 6 of the Census Bureau’s annual income report, across 137.1 million households ranked by money income before taxes.
They are household figures. In Eco3min’s tabulation of the Census survey microdata (CPS ASEC 2026, covering 2025 income), 76.4% of households in the top 10% counted two or more earners, against 39.1% of all households. An earner is anyone with earnings during the year, however small.
The thresholds have also pulled away from the middle. In 2025 dollars, the 90th percentile stood at $118,400 in 1967 and has risen 120.7% since, against 55.5% for the median; the 95th percentile rose 136.6%.
→ Mean against median: why the mean sits above the median
What the data shows
Table 6 of the Census report gives selected percentiles of household income every year since 1967, in 2025 dollars, from the Annual Social and Economic Supplement of the Current Population Survey (CPS ASEC). Money income counts earnings, Social Security, pensions, interest and dividends, before taxes; it leaves out capital gains and noncash benefits.
- Thresholds in 2025: $261,300 for the 90th percentile, $354,000 for the 95th, against a median of $87,460. The top fifth starts lower, at $182,400.
- The 90th percentile as a multiple of the median: 2.11 in 1967, 2.28 in 1979, 2.67 in 2000, 2.93 in 2019, 2.99 in 2025. For the 95th: from 2.66 to 4.05.
- The top 5% of households averaged $594,500 in 2025, well above the threshold that admits them.
- In 2022 the 90th percentile fell 5.4% in real terms and the 95th 4.3%, against 2.2% for the median.
- On tax returns rather than households, the IRS put the floor of the top 1% at an adjusted gross income of $675,602 for 2023 (Statistics of Income, table 4.1).
The Census tables stop at the 95th percentile. For the top 1%, the IRS series is the nearest official reference, on another unit (the tax return) and another income concept: adjusted gross income includes capital gains, which money income leaves out.
→ Any income, any year: rank any household income since 1967
Why the household thresholds run high
Individual pay and household income rank on different scales. Among people with earnings in 2025, the 90th percentile was about $150,000 (Eco3min calculation on the same microdata). A household living on one income of $130,650, half the household threshold, ranked around the 67th percentile of households.
More earners, unevenly weighted. Households in the top 10% averaged 2.05 earners and 3.18 members, against 1.25 and 2.40 for all households. The second earner often weighs little: in 48.0% of top-10% households the second-largest earnings reached at least a quarter of household earnings, against 28.2% of all households. Pooling matters, but genuine two-income households are about half of the group.
Middle of working life. Households headed by someone aged 35 to 64 made up 71.1% of the top 10%, against half of all households. Older and younger households are under-represented: 17.1% are headed by someone 65 or older (30.6% overall), 11.9% by someone under 35 (19.5%).
A wider distribution. The 90th percentile went from 2.11 to 2.99 times the median between 1967 and 2025, and the widening is not confined to that point, as the 95th percentile against the 20th shows. Part of it is measurement. The two Census method changes published on both bases, in 2013 and 2017, account for 0.069 of the 0.88-point rise in the multiple, about 8%; the 1993 switch to computer interviewing was not bridged, so 8% is a minimum.
By regime, the multiple rose by 0.39 during the long disinflation from 1979 to 2000, then by 0.26 from 2000 to 2019, method changes included. Recent shocks have moved it without a lasting break: 2.99 in 2021, 2.90 in 2022 as inflation peaked, 2.99 again in 2025 (Census, published ratios). Every percentile is deflated by the same price index, so the 2022 dip reflects slower nominal growth at the top, which the table does not break down; from 2021 to 2025 the 90th percentile and the median rose 4.8% and 5.0% in real terms. The duration of the move separates the regimes: decades of steady widening before 2019, a one-year swing undone within three years since.
The top-10% line is a household line, crossed mostly by households that count two earners or more.
→ Framework: financial decisions in everyday life
What it means for different economic actors
Households. A household’s rank depends on everyone under its roof. The same salary of $130,650 places a one-earner household around the 67th percentile and a couple earning it twice at the 90th.
Investors and analysts. In the Census definition, which leaves out capital gains, earnings make up 81.4% of top-10% household income, against 75.7% for all households. Measured this way the top decile’s income is mostly pay; realized gains, the part that moves with markets, appear only in the IRS series.
Public debate. Tax proposals aimed at high earners are written for tax returns, so a household’s rank in the Census table does not tell whether it falls under them.
A common error is to read the household threshold as the pay of a top-10% worker. On 2025 data the individual 90th percentile of earnings was about $150,000, the household one $261,300.
Practical observation
What the data suggests for understanding your situation:
- Question to ask yourself: is the comparison made between households, between tax returns or between individual earners, and does the income include capital gains?
- Data to monitor: the ratio of the 95th to the 90th percentile in Census table 6, released each September, 1.35 in 2025 against 1.26 in 1967. A rising ratio means the top 5% is pulling away from the rest of the top tenth.
- Over a longer span: the IRS floor of the top 1% of returns rose from $306,635 in 2001 to $675,602 in 2023 in current dollars, a real rise of 28.1% on the IRS constant-dollar column, capital gains included.
- What the literature documents: Goldin and Katz (2008), in The Race between Education and Technology, trace the rise of the college wage premium after 1980, one channel through which upper household incomes grew faster than the middle.
This is descriptive information to help you frame your own analysis. Eco3min does not provide investment advice.
Go deeper
📁 Dataset: monthly real wage growth data
📖 Related analysis: how inflation weighs across income levels
Related questions
Frequently asked questions
Is a household in the top 10% wealthy?
The Census thresholds measure one year of income, and no official statistic defines a household as rich. A household can cross $261,300 with two salaries and little savings, while a retired couple with large assets can report a modest money income, since capital gains are left out and the value of assets is not counted. The thresholds describe a position in one distribution, for one year.
How many top-10% households rely on two incomes?
Fewer than the earner count suggests. In the CPS ASEC 2026, which covers 2025 income, 76.4% of households above the 90th percentile counted two or more earners and only 4.2% had none, against 25.5% of all households. But the second earner brought at least a quarter of household earnings in 48.0% of them. The share is no higher in the top 5%, at 76.0% and 42.0%: above the 90th percentile, a second earner no longer sets households apart.
Is there an official top-1% threshold for households?
No. The Census tables stop at the 95th percentile. The nearest official figure is the IRS floor for the top 1% of tax returns, $675,602 of adjusted gross income in 2023. It ranks returns rather than households, includes capital gains and counts a married couple filing jointly once, so it cannot be read as the next step above the Census $354,000.
Last updated — 1 October 2026
Disclaimer – Financial and Legal Information: The analyses, commentary, and content published on eco3min.fr are provided for informational and educational purposes only. They do not constitute investment advice or a solicitation to buy or sell financial instruments. Past performance is not indicative of future results. All investment decisions involve risk and are the sole responsibility of the reader. Data, charts and calculated series are provided as is and may contain errors or lag behind their source: check any figure against the primary source cited before relying on it. Content describing laws, regulations or contracts reflects the law as of its publication date and does not constitute legal or tax advice; applying it to a specific situation requires a qualified legal or tax professional.
Regulated and tax values: the rates, indices, caps and brackets with legal effect cited on this page are set by official decision, change over time and apply according to individual circumstances. Only the official publication in force on the relevant date is authoritative (for example the Journal officiel, INSEE, Banque de France, the IRS or the Social Security Administration). To revise a rent, sign or challenge a contract, or file a return, check the value at the source or with a professional.