Quarterly Earnings: Reading the Signals for Future Profits
How to read 2026 quarterly earnings to anticipate 2027–2028 profits and adjust equity exposure beyond consensus, focusing on orders, price-volume mix and free cash flow.

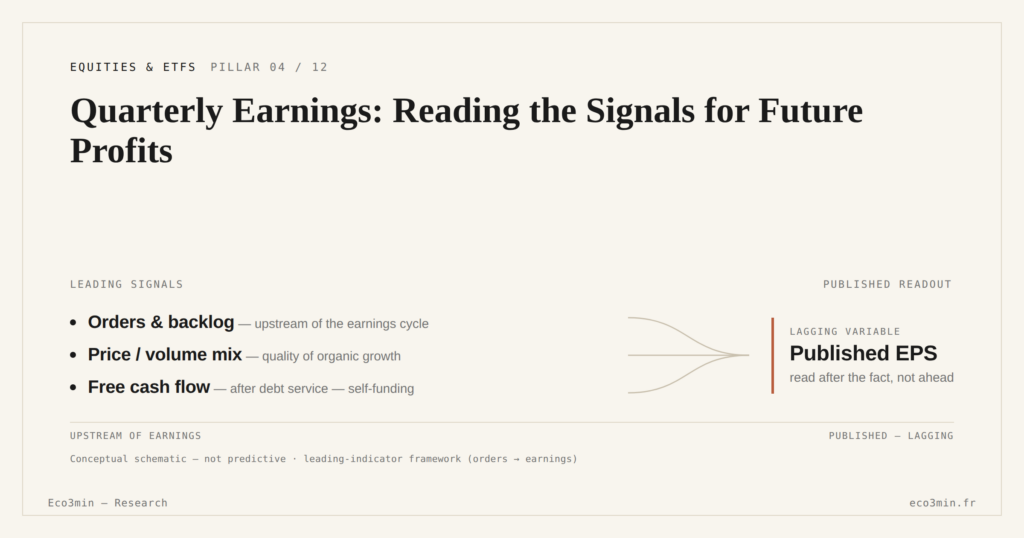
How to read 2026 quarterly earnings to anticipate 2027–2028 profits and adjust equity exposure without relying solely on consensus.
TL;DR
2026 earnings already point to the 2027–2028 trajectory; the signal sits less in headline EPS than in three lines the consensus overlooks.
- 2026 earnings growth stays positive but uneven — roughly 5–7% in the U.S. and 2–4% in the eurozone — masking a widening gap between solid and fragile companies.
- A durably higher cost of capital and the gradual refinancing of zero-rate-era debt shift what matters from the quarterly surprise to the capacity to self-fund growth.
- The three telling lines are orders, price-volume mix, and free cash flow after interest — where the next revision cycle plays out.
Why 2026 earnings matter structurally
2026 aggregates show earnings growth still positive but less uniform: ≈5–7% in the United States, ≈2–4% in the eurozone according to recent market compilations. On the surface, momentum remains “decent”.
But the macro regime has shifted: durably higher cost of capital, positive real rates, gradual refinancing of debt contracted in the zero-rate era. Reading earnings through this new lens connects to our analysis of earnings surprises in the financial regime shift. In this context, the dispersion between solid and fragile companies widens.
What is now at stake is no longer the short-term surprise, but the ability to fund growth, capex and debt with a cash flow consistent with a more demanding cost of capital. This question is treated in our reference page on how real rates, multiples and earnings shape equity valuation.
The consensus trap: looking only at EPS
The consensus typically projects:
- Global growth around 2.5–3%.
- Inflation stabilized near 2–2.5%.
- Earnings rising 7–9% annually.
This scenario implicitly assumes that margin and debt structures remain sustainable. Yet two variables undermine this assumption:
- Lagged increase in financial expenses: many companies are still gradually refinancing their debt at rates 150–300 bp higher than in 2019.
- Capped operating margins: post-inflation pricing power is fading, particularly in discretionary consumption and parts of industrials.
In other words, reported EPS can mask a gradual deterioration in earnings quality.
The three lines to analyze systematically
1. Order book and order intake
In industrials, infrastructure, B2B software and defense, orders typically lead the earnings cycle by 9 to 18 months.
- Revenue +4% but orders −8% → 2027 visibility already weakened.
- Revenue flat but bookings +15% → potential for positive revisions on a 12-month horizon.
In a world of positive real rates, visibility on future cash flows becomes central to valuation.
2. Price-volume mix
After 2021–2023 dominated by price increases, sustainability now rests on volumes.
- +6% growth with +7% price and −1% volumes → model under strain.
- +4% with +1% price and +3% volumes → healthier base.
Companies able to revive volumes without depending exclusively on pricing power tend to retain a more durable quality premium.
3. Free cash flow after interest
In the current regime, the discriminating variable is cash generated after debt service.
- FCF > 8% of revenue and net debt/EBITDA < 1x → high strategic flexibility.
- FCF < 3% of revenue and net debt/EBITDA > 3x → heightened vulnerability if rates remain elevated.
Two companies with similar EPS can diverge sharply on intrinsic value through this lens.
What this implies for 2027–2028
Scenario 1 – Controlled normalization (consensus)
- Moderate but stable growth.
- Inflation close to 2%.
- Earnings progressing steadily.
2026 publications would then represent a simple transition toward a stabilized earnings cycle.
Scenario 2 – Lagged revisions (less integrated)
- Costlier refinancings over 2026–2028.
- Gradual order slowdown.
- Margin compression on the most leveraged companies.
In this framework, negative revisions could appear with a delay, while markets still price a moderate acceleration scenario.
Common reading errors
- Confusing revenue growth with value creation: without solid FCF, growth can destroy capital.
- Analyzing a single quarter in isolation: the trajectory across 4–6 quarters is more informative than a one-off surprise.
- Ignoring the debt maturity schedule: an acceptable debt/EBITDA ratio can mask an approaching refinancing wall.
Action points
Investors
- Within equity exposure, companies with positive FCF, net debt/EBITDA below 2x and order visibility have historically shown greater resilience through cycles of elevated capital costs.
- Heavy concentrations in low-FCF models or in companies dependent on near-term refinancing have historically faced amplified pressure when capital costs remain high.
- Earnings reports can be read as an annual thesis-validation tool rather than as a systematic trading trigger.
Corporate executives
- Detail the evolution of price-volume and order book dynamics.
- Prioritize deleveraging and projects with ROCE above the cost of capital.
- Communicate clearly on debt structure and maturity profile.
Individuals and senior managers
- Excessive concentration in a single name, even a “solid” one, has historically increased idiosyncratic risk.
- Earnings publications can also be read as an indicator of sector health and employment dynamics on a 12–18 month horizon.
Key indicators for your monitoring dashboard
- FCF / revenue ratio (>5% as a comfort threshold for large caps).
- Net debt / EBITDA and refinancing schedule.
- Order trajectory across three consecutive quarters.
In an environment where capital is no longer free, the quality of cash generation relative to that capital cost has become the main valuation driver.
3 key takeaways
- The useful earnings reports are no longer those that beat EPS, but those that show solid orders and resilient FCF.
- The lagged effect of higher rates on 2027–2028 earnings is still only partially priced.
- Filtering companies by FCF, debt and order dynamics reduces structural risk without exiting equities.
Systematically connecting micro-data (cash, debt, orders) with the macro regime helps avoid consensus traps and read earnings cycles more precisely.
Last updated — 4 July 2026
Disclaimer – Financial Information: The analyses, commentary, and content published on eco3min.fr are provided for informational and educational purposes only. They do not constitute investment advice or a solicitation to buy or sell financial instruments. Past performance is not indicative of future results. All investment decisions involve risk and are the sole responsibility of the reader.
Read next
Full pillar →Reading Earnings Surprises: Cash Flow, Margins, Guidance
How to analyze an earnings surprise beyond the simple beat or miss: cash flow, margins, guidance, and weak…
Equal-Weight ETFs: The Quiet Signal Behind Rising Indices
Equal-weight ETFs reveal the true health of the equity market behind mega-cap-driven indices. Their gap with cap-weighted ETFs…
Smart Beta ETFs: The Hidden Risk Behind Factor Performance
Smart beta ETFs now hold ~15-20% of global equity ETF assets. Stacking factor exposures often rebuilds hidden concentration…