The Real Return on Regulated Cash, 1960–2026: A Long Record of Repression Windows

Each time the Livret A rate is reset, the argument is about the nominal figure. Across sixty-six years, that figure says almost nothing. The only quantity that matters over time, the real return, tells a far more uneven story than either permanent repression or guaranteed protection.
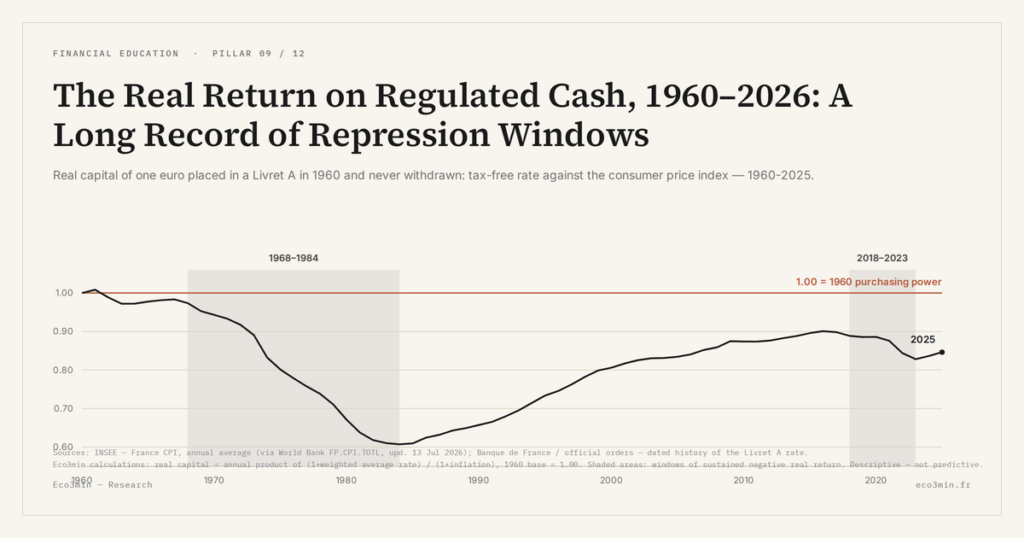
Over a single year, the debate about regulated savings is always about the nominal rate. Over six decades, only one quantity matters: the real return, the rate paid minus inflation. This article rebuilds the series from 1960, setting France’s Livret A nominal rate against the INSEE price index, and computes the cumulative real return: what one euro placed in 1960 and never withdrawn would have gained or lost in purchasing power. The result surfaces distinct repression windows, the long stretches when the real return stayed negative, notably the high-inflation 1970s–80s and the floor-rate 2010s–20s. The proprietary artefact: the full series, the cumulative real return, and a dated identification of each window, released as a reproducible, downloadable CSV. No projection, no instruction: a sourced, quantified historical read of administered cash as a case of financial repression.
In short. From 1960 to 2026, one hundred euros left on a Livret A and never withdrawn retains roughly 82 euros of constant purchasing power: the cumulative real return comes to about −18%. That net figure hides a wide dispersion. The loss concentrates in two windows, 1968–1984 (double-digit inflation, a lagging rate) and 2018–2023 (floor rates followed by an inflation shock). Between them, a quarter-century of positive real return (1985–2009) partly compensated, without ever bringing the capital back to its starting real value. Repression is not permanent: it is episodic.
The real return is the only quantity that matters over time
A nominal rate, taken alone, measures nothing. A Livret A paying 8.50% in 1981 destroyed purchasing power; a Livret A paying 0.75% in 2015 mildly preserved it. The difference lies entirely in the inflation that prevailed alongside each rate. The real return, defined as the nominal return adjusted for the rise in prices, is the only figure that lets two eras be compared. Over a few months, the gap between nominal and real is measured in tenths of a point. Over several decades, it decides outright what immobilised savings are worth. Reading a vehicle’s real return always means subtracting inflation from the headline rate, the same operation that defines what real return on savings means for any instrument.
The Livret A offers an unusually clean case for this exercise. Its return has been free of income tax and social levies from the outset: the posted rate is the rate actually received, with no fiscal layer to strip out. Comparing this net rate directly with inflation is therefore legitimate, which is not true of a taxed product, where the gross return overstates the real one. The series that follows sets this net rate against the price index, year by year.
How the series is built
The nominal rate used for each year is the annual average Livret A rate, weighted by the effective revision dates. Because the rate historically changed mid-year (February and August resets, plus exceptional dates before 1986), a year such as 1981 combines 7.50% until 16 October and 8.50% thereafter, an average of 7.67%. The inflation measure is the INSEE general price index in annual average, covering the whole of France, tobacco included: it is the indicator that captures the erosion of everyday purchasing power. The real return for a year is computed as (1 + rate) divided by (1 + inflation), minus one. The cumulative real return is the product of these annual factors from 1960 onward.
The data come from cross-checked public sources rather than from an internally certified base. The dated rate series and the INSEE inflation series are drawn from public records, completed with the official decrees for the period after 2023. A consistency check validates the whole: the product of annual inflation rates from 1961 to 2022 reproduces the cumulative INSEE price multiplier to within 0.3%. It is on this basis that one reads why this rate is a policy choice: it is not a market price that adjusts freely, but a level set by public decision, whose gap to inflation is precisely what the series measures.
The cumulative result: −18% over sixty-six years
One euro placed on a Livret A in 1960 and left to compound until early 2026 saw its nominal amount multiplied by 10.7. Over the same span, prices were multiplied by 13.0. The ratio of the two gives the verdict: the capital retains 0.82 times its starting real value. In other words, one hundred euros of 1960 equate to roughly 82 euros of constant purchasing power in 2026, a cumulative real return of −18%. Expressed annually, the average real gap comes to −0.30% per year, geometric. Thirty of the sixty-six years show a negative real return. The worst is 1974 (−6.5%, with an average rate of 6.25% against inflation of 13.7%); the best is 1994 (+2.8%, a rate of 4.50% against inflation of 1.7%). Both readings turn on the inflation term, taken here from the French inflation rate measured year over year.
The net figure conceals the substance. Decade by decade, the cumulative real return traces a deep trough followed by a partial recovery.
| Decade | Cumulative real return |
|---|---|
| 1960s | −5.6% |
| 1970s | −26.9% |
| 1980s | −8.5% |
| 1990s | +22.7% |
| 2000s | +9.4% |
| 2010s | +1.3% |
| 2020–2025 | −4.5% |
The windows: episodic repression
The cumulative path breaks down into clear windows, whose sign depends on a single mechanism: the lag between an administered rate, which adjusts slowly, and inflation, which moves fast. Depending on the direction of that move, the lag penalises or rewards the saver.
1968–1984, the deep repression. This is the heaviest window. Through the 1970s, the cumulative real return collapses by 26.9%. Inflation climbs from 9% to nearly 14% a year, while the administratively set Livret A rate stays between 4% and 8.50% and follows the rise with a structural delay. When inflation accelerates, the indexation lag works mechanically against the saver: each year the rate paid is anchored to past inflation, lower than current inflation. Real capital reaches its lowest point in 1981, at 0.62 times its 1960 value.
1985–2009, the disinflation recovery. The same mechanism reverses. The 1990s post a cumulative real return of +22.7%. The Livret A rate stayed high, held at 4.50% from 1986 to 1996, while inflation receded toward 2%. This time the indexation lag favours the saver: the administered rate, anchored to higher past inflation, exceeds current, falling inflation. Across 1984–2017, the cumulative real return reaches +47%. It is exactly the same series read by regime that makes this asymmetry legible: for administered cash, disinflation is a favourable window.
2010–2017, the floor-rate plateau. Low inflation, low rate: the real return hovers around zero. The 2010s cumulate only +1.3%. The Livret A falls to 0.75% in 2015, but near-zero inflation leaves the real return barely positive.
2018–2023, repression renewed. The negative sequence returns. The 0.50% floor in force from 2020 to 2022, then the 2022 inflation shock, produce a marked real loss: in 2022 alone, an average rate of 1.38% faces inflation of 5.2%, a −3.6% hit to purchasing power. The 2020–2025 span cumulates −4.5%. What is at stake then also depends on the amount tied up, since the share of wealth actually exposed to this gap is governed by how much can sit on the account before the ceiling binds. In 2024 and 2025, the rate moves back above inflation receding toward 1%, and the real return turns mildly positive again.
| Year | Average rate | Inflation | Real | Real capital (1960 base) |
|---|---|---|---|---|
| 1960 | 3.25% | 3.6% | −0.3% | 1.00 |
| 1974 | 6.25% | 13.7% | −6.5% | 0.81 |
| 1980 | 7.25% | 13.6% | −5.6% | 0.65 |
| 1985 | 6.25% | 5.8% | +0.4% | 0.59 |
| 1990 | 4.50% | 3.4% | +1.1% | 0.64 |
| 1995 | 4.50% | 1.9% | +2.5% | 0.71 |
| 2000 | 2.62% | 1.7% | +0.9% | 0.78 |
| 2008 | 3.67% | 2.8% | +0.8% | 0.83 |
| 2015 | 0.90% | 0.0% | +0.9% | 0.87 |
| 2022 | 1.38% | 5.2% | −3.6% | 0.82 |
| 2025 | 2.16% | 1.0% | +1.1% | 0.82 |
Key takeaways
- Cumulative real return of the Livret A, 1960–2026: roughly −18% (one hundred euros of 1960 are worth 82 euros of purchasing power in 2026).
- Two windows of real loss: 1968–1984 (inflation shocks) and 2018–2023 (floor rates, then the 2022 shock).
- One compensating window: 1985–2009, that is +47% cumulative real return across 1984–2017, driven by disinflation.
- Thirty of the sixty-six years show a negative real return.
- The capital never returned to its 1960 real value: the 1981 trough (0.62) was only half recovered.
What the series does not say
The computation rests on cross-checked public series, not on a certified internal base, and on the INSEE general deflator, tobacco included. A different index, for instance excluding tobacco or rents, would give a neighbouring but not identical result. The 2025 value remains provisional. The series measures a single instrument and compares it to none: reading the real return against other vehicles, from cash to euro-denominated funds, is a separate exercise, the one that consists of weighing real yield across cash and euro funds. Anyone wanting to reproduce the arithmetic on a single figure can run the numbers on a real return directly. Finally, a historical series says nothing about the future: the return to positive territory in 2024–2025 prejudges no future path.
The full annual series, with rate, inflation, real return and cumulative factor for each of the sixty-six years, is reproducible from the cited sources and available as a CSV.
The overall read
The real return on the Livret A since 1960 is governed by a single parameter: the gap between an administered rate, slow to adjust, and an inflation that moves faster than it does. When inflation accelerates, the lag punishes; when it recedes, the lag rewards. Across sixty-six years, the acceleration phases dominated, leaving a net erosion of the purchasing power of immobilised savings. But the overall balance is not the right level at which to read this. The dispersion is: there is no single verdict on the Livret A as a hedge against inflation, only a succession of regimes in which the same mechanism produces now a deep loss, now a real gain. The series does not settle the case for or against; it shows that the question itself depends on the period in which it is asked. A dedicated resource: our reading of cash and near-cash options.
Last updated — 5 August 2026
Disclaimer – Financial Information: The analyses, commentary, and content published on eco3min.fr are provided for informational and educational purposes only. They do not constitute investment advice or a solicitation to buy or sell financial instruments. Past performance is not indicative of future results. All investment decisions involve risk and are the sole responsibility of the reader.
Read next
Full pillar →Series I and EE Savings Bonds: Locked Formulas in a Moving Rate World
US savings bonds lock a rate formula at the moment you buy them, for the life of the…
Where the Livret A’s Money Goes: The Caisse des Dépôts Circuit and Social-Housing Finance
The savings held on Livret A accounts do not sit idle. A regulation-set share is centralised at the…
France’s LEP vs the Livret A: A Means-Tested Higher Rate, Explained
France’s Livret d’épargne populaire is often described as "the Livret A, only better". The description misleads: the LEP…