How Much Cash American Households Hold: Deposits, Money Funds, and the Savings Mix

The Federal Reserve’s accounts show American households holding more than 14 trillion dollars in bank deposits and roughly 7 trillion in money market funds. Behind a reassuring average, though, lies a sharply divided reality the mean conceals.
This page fixes the key figures of that picture, by instrument, and shows why the average balance of an American account says far less than how those balances are distributed.
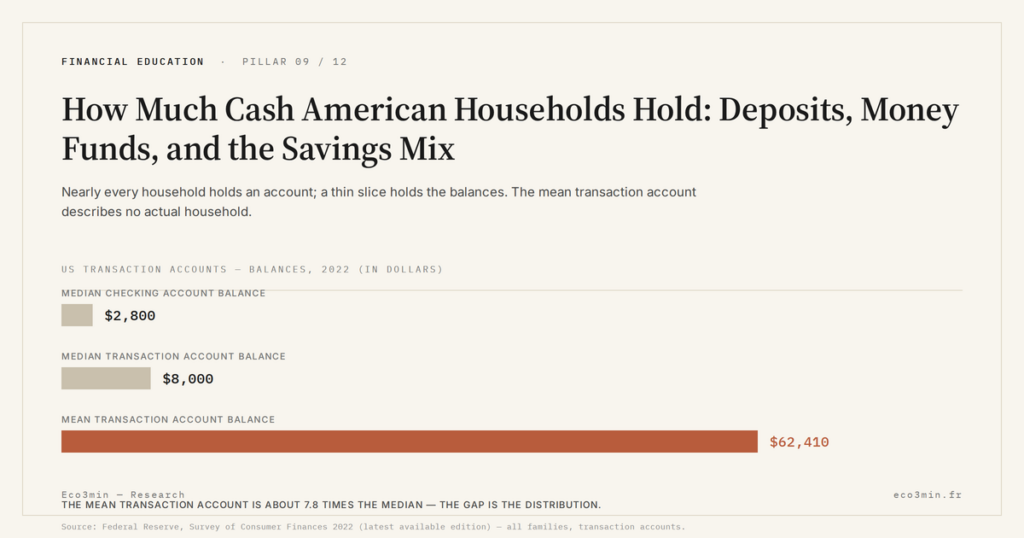
As of 2025, American households held about 14.5 trillion dollars in deposits and 7 trillion in money market funds, but the averages hide a stark gap: the median transaction account holds 8,000 dollars, the mean 62,410.
- Household deposits reached 14.5 trillion dollars in 2025, up 715 billion, with the entire gain in liquid checkable deposits as savings and CDs fell.
- Money market funds held by households total roughly 7 trillion dollars, against about 15 trillion in bank deposits system-wide.
- The median transaction account holds 8,000 dollars while the mean is 62,410, a gap driven by a thin slice of high-balance households.
The landscape: 14.5 trillion in deposits, 7 trillion in money funds
As of 2025, American households held 14.5 trillion dollars in checkable deposits, savings accounts, and time deposits such as certificates of deposit, according to the Federal Reserve’s Financial Accounts of the United States, an increase of 715 billion from 2024. The composition of that gain is telling: checkable deposits rose 1.3 trillion while savings accounts and CDs fell by 574 billion, meaning households did not add cash so much as move it into more liquid, immediately spendable accounts. Alongside these deposits, households hold roughly 7 trillion dollars in money market funds, a sum that has grown about elevenfold since 1995 and now sits against roughly 15 trillion in total bank deposits across the system.
These holdings sit within a far larger household balance sheet, of which cash instruments, deposits plus money funds, are only the most liquid layer, dwarfed by equities, retirement accounts, and housing. The composition of the cash itself is what gives the total its meaning. Checkable deposits are transaction balances meant to be spent, while savings accounts, CDs, and money funds are closer to stored wealth; a gain concentrated in the former signals liquidity preference more than accumulation. Read this way, the 715 billion increase in 2025 is less a story of households saving more than of households repositioning the cash they already held, moving it toward flexibility as the reward for locking it up receded.
This is the market-based counterpart to administered savings versus market cash in systems built around regulated accounts, and it shows how what a regulated savings account represents elsewhere is, in the United States, spread across ordinary deposits and funds. The national saving rate, at 2.6% of disposable income in April 2026, is low by international standards, and the cash that households do hold is far from evenly spread. The average balance describes a household that does not exist.
The mean is nobody’s balance
The Federal Reserve’s Survey of Consumer Finances, whose latest edition dates from 2022, puts the average balance in American transaction accounts, which include checking, savings, money market, and prepaid accounts, at 62,410 dollars. The median, however, sits at just 8,000 dollars. The gap between the two is the entire story. A simple illustration makes it concrete: if ten people each hold 5,000 dollars and one more walks in with 5 million, the median stays at 5,000 while the mean leaps to hundreds of thousands. The average is what a small number of high-balance households do to the arithmetic, which is why the median, not the mean, is the figure that describes the typical household.
The same concentration appears whichever way the data are cut. A thin slice of high-balance households holds a disproportionate share of total deposits, while a large share of households holds very little, which is why the aggregate and the typical diverge so sharply. National figures become useful only when a household can locate itself within the distribution rather than against the average, and the median is the anchor that makes that possible.
The distribution also has a shape across a lifetime. Median transaction balances stay remarkably flat between the ages of 35 and 64, the years when incomes are highest but so are the competing demands of mortgages, children, and aging parents, and rise mainly into retirement. Measured against inflation, what a household keeps in cash is best read as the real value of cash over time, not as a nominal balance that flatters the average.
The distribution also tracks longstanding wealth gaps. White families hold more than five times the wealth of the typical Black or Hispanic family, and account balances differ correspondingly across groups, so the national median itself masks further divergence beneath it. Age compounds the pattern: balances rise into retirement while staying flat through the working years, when mortgages and dependents absorb income. The aggregate is thus not only concentrated by balance but stratified by age and by group.
The savings mix and where it is shifting
Where households hold their cash is itself in motion. Money market funds, at roughly 7 trillion dollars, compete with bank deposits, and the flows between them respond to relative yields: when money fund yields run well above deposit rates, cash migrates from banks into funds, and the reverse holds when the gap narrows. This is the aggregate expression of the choice examined in high-yield savings versus money market funds, played out across the whole household sector rather than a single account. The 2025 shift into liquid checkable deposits, and out of savings and CDs, fits the same logic: as the Federal Reserve cut rates through late 2025, the reward for locking cash in less liquid accounts fell, and households moved toward flexibility.
The 2025 move into checkable deposits fits this logic precisely. As the Federal Reserve lowered rates through late 2025, the premium for holding cash in savings accounts or certificates of deposit narrowed, and households shifted toward accounts they could spend from immediately, accepting a lower yield in exchange for flexibility. The direction of the flow, out of stored-wealth accounts and into transaction balances, is itself a signal about how households were reading the rate environment. The sibling topic is taken up in the article on How an Administered Savings Rate Is Set: The Inflation-Plus-Money-Market Formula.
Fragility behind the average
The concentration of balances has a direct consequence for financial resilience. Despite trillions in aggregate deposits, only about 46% of American adults have enough savings to cover three months of expenses, and surveys find that a large share could not cover a 400-dollar emergency with cash alone. A significant minority of households report no personal savings at all. These figures are not a contradiction of the 14.5 trillion total; they are its distribution. Reference on the topic: the breakdown “Investment Vehicles Explained”. A national aggregate measured in trillions, and a median measured in thousands, describe the same country seen at two different scales, and only the second tells an individual household where it stands. The convenience and safety of holding cash, and whatever yield it earns, accrue in dollar terms mainly to the households that hold large balances, even where access to accounts is near-universal, which makes concentration a structural feature of household cash rather than a quirk of one measure. The wider context: the real-return view of short-term vehicles.
The low national saving rate compounds the picture. At 2.6% of disposable income in April 2026, it leaves little room for the median household to build a buffer, even as aggregate deposits climb. Rising consumer prices and near-record credit-card interest divert income that might otherwise reach savings, and a large minority of adults report they could not cover even three months of expenses. The aggregate cash and the fragility of the typical household are two readings of the same distribution, not a contradiction within it, and the second is the one an individual household actually lives. Placing that household on a scale takes the income side of the same question, which is the year-by-year distribution of US household incomes.
The distribution is the story
Read together, these numbers describe what the aggregate hides. Americans hold an enormous stock of cash, more than 14 trillion dollars in deposits and 7 trillion in money funds, but that stock is concentrated, and the typical household holds a fraction of the average. The mean transaction account of 62,410 dollars is a statistical artifact: it matches neither the half of households that hold far less, at a median of 8,000 dollars, nor the thin slice that holds far more. The annual photograph of American cash is worth reading for its distribution across households, not for its averages.
Reading the average account balance as typical is misleading. The median transaction account, at 8,000 dollars, sits far below the mean of 62,410, because the mean is pulled up by a thin slice of high-balance households. A national total measured in trillions and a median measured in thousands describe the same households at different scales: it is the distribution, not the average, that says where a household stands.
The overall read
The photograph of American household cash rests on a tension: a vast aggregate held by the country, a modest balance held by the typical household. Deposits and money market funds together run past 21 trillion dollars, yet the median transaction account holds 8,000, and the gap is what every average conceals. Describing this distribution prescribes nothing about where a household should hold its cash; it only makes visible what the aggregate erases. This page is updated as the Federal Reserve releases new Financial Accounts data each quarter and new Survey of Consumer Finances figures every three years. The gap between the two, one measured in trillions and the other in thousands, is the single most useful fact the photograph contains.
Last updated — 21 August 2026
Disclaimer – Financial Information: The analyses, commentary, and content published on eco3min.fr are provided for informational and educational purposes only. They do not constitute investment advice or a solicitation to buy or sell financial instruments. Past performance is not indicative of future results. All investment decisions involve risk and are the sole responsibility of the reader.
Read next
Full pillar →Where the Livret A’s Money Goes: The Caisse des Dépôts Circuit and Social-Housing Finance
The savings held on Livret A accounts do not sit idle. A regulation-set share is centralised at the…
France’s LEP vs the Livret A: A Means-Tested Higher Rate, Explained
France’s Livret d’épargne populaire is often described as "the Livret A, only better". The description misleads: the LEP…
France’s Livret A Ceiling: What Happens Mechanically When a Capped Savings Account Is Full
France’s Livret A ceiling, €22,950, is one of the best-known figures in French saving and one of the…