Why REITs fell in 2022: cap rates and the rate shock

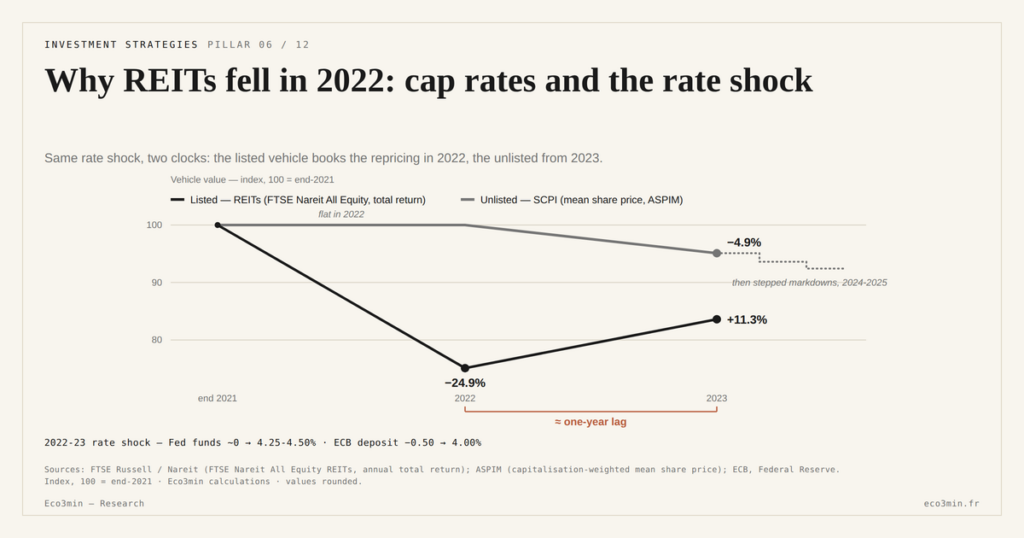
Listed REITs did not wait for 2023; they repriced in 2022, the year rates moved. As the Federal Reserve lifted the funds rate from near zero to over 4%, the market repriced the cap rate embedded in every property, and the index fell while the buildings had barely changed hands.
TL;DR
As the Fed lifted rates from near zero to over 4% in 2022, listed REITs repriced the cap-rate shock into their quotes within the year, before the underlying buildings traded.
- The shock began in the bond market: the ten-year Treasury yield rose roughly 243 basis points over 2022 to near 3.9%, repricing the cost of capital on which every property is indexed inside twelve months.
- Over 2022 the FTSE Nareit All Equity index returned -24.9%, its worst year since 2008, but the fall was uneven: offices dropped 37.6% on hybrid-work doubts while specialty assets lost just 0.8%, per Nareit.
- In the first nine months of 2022 the listed index was down more than 20% while two large American non-traded property funds still reported portfolios up roughly 12 to 13%, per Stanger: same assets, two recording clocks a year apart.
- Buildings barely changed hands as the index fell, so the move discounted expectations rather than booking realized losses; the index rebounded over 11% in 2023 while appraisal-based funds were only starting to mark down.
This article decomposes the 2022 drawdown step by step, from the policy rate to the quote, and stays on the price of the listed share — not on the formation of physical property prices.
Listed REITs did not wait for 2023: they repriced in 2022, the year rates moved. As the Federal Reserve lifted the funds rate from near zero to over 4% across 2022, the market repriced the cap-rate assumption embedded in every property, and the FTSE Nareit All Equity index fell sharply while the underlying buildings had barely changed hands. That is the signature of a listed vehicle: it discounts the rate shock immediately, where appraisal-based funds register it only later. The episode is the cleanest illustration of the cluster’s thesis — value is governed by the rate-to-cap-rate channel, not by the distributed yield. This article decomposes the 2022 transmission step by step, as a case study of the vehicle through the rate cycle, and contrasts the listed timing with the slower unlisted repricing that followed into 2023 and 2024.
From near zero to over 4%: the rate shock
The starting point is monetary. Across 2022, the Federal Reserve lifted the federal funds rate from near zero to above 4%, and on toward the mid-5% range by the middle of 2023 — the fastest tightening in four decades. The bond market moved first and fast: the ten-year Treasury yield rose by roughly 243 basis points over 2022 alone, finishing the year near 3.9%. The reference cost of capital, on which all investment property is indexed, had gone from almost nothing to a level not seen in more than a decade, and it had done so inside twelve months.
That shock did not strike property directly; it struck it through the arbitrage of investors. While money cost nothing, an asset capitalized at 3% or 4% stayed attractive for lack of a remunerative alternative. Once the risk-free rate rose by several points, that same return became insufficient: for a building to stay competitive against a now-remunerative government bond, its yield had to climb. With rents rigid in the short run, the only available adjustment ran through price. That is the spring of the whole episode, and it sits upstream of how physical property prices form, which belongs to another frame — the property credit cycle. This article stays on the price of the listed share.
The cap-rate repricing the market made in real time
Here the listed vehicle parts ways with the unlisted one. A REIT’s quote is set continuously by the stock market, which discounts expected rents at a rate tied to the bond market. The instant Treasury yields jumped, that discount rate jumped, and the present value of future rents fell in the quote — before a single building had changed hands, before any appraiser had revised a number. Over 2022, the FTSE Nareit All Equity REITs index posted a total return of -24.9%, its worst year since 2008, when it had fallen 41.1%, according to Nareit. The market had repriced the entire cap-rate shock within the year, in real time, as the yield rose.
The cleanest evidence that this was a repricing of expectations, not a recording of realized losses, is that the buildings had barely traded. Transactions thinned out as buyers and sellers stood on incompatible prices, so very few deals confirmed the new cap-rate level. The listed market did not need that confirmation: it discounted the rate move directly into the quote, and the widening discount to net asset value through 2022 and 2023 was the visible measure of how far ahead of the appraisals the public market had moved. The continuous proxy for the dearer financing that pushed cap rates up can be read in real mortgage rates through the shock, whose rise led the lagging appraisal-based record by quarters.
2022 by segment: where the drawdown concentrated
The headline -24.9% hides a wide dispersion by property type, because the cap rate did not expand by the same amount everywhere. The size of each segment’s drawdown turned on whether its future rents were in doubt. Offices, doubly exposed to higher rates and to lasting questions over remote work, fell 37.6% on the year — the deepest correction. At the other end, so-called specialty assets lost only 0.8%, while retail fell 13.3% and lodging 15.3%, according to Nareit. The same rate shock struck every segment; its amplitude depended on the durability of the underlying leases.
The office case shows the cap-rate channel at its sharpest. Two forces compounded there. The rate shock alone would have expanded office cap rates, as it did across every segment; but offices also faced a structural question over how much space tenants would renew in a post-pandemic world of hybrid work. That doubt over future rents widened the risk premium investors demanded on top of the rate-driven move, so office cap rates expanded further and faster than those of logistics or residential. The listed market, pricing both forces at once, marked office REITs down hardest — a 37.6% fall against a 0.8% move on specialty assets in the same year. The contrast is not evidence that the rate shock spared specialty property; it is evidence that the market judged specialty rents far more durable, and therefore demanded a far smaller cap-rate expansion. Related discussion: the metrics that decide a REIT.
This dispersion is the reason a REIT cannot be judged in the aggregate. Two vehicles can carry the same headline yield while holding portfolios whose cap rates expanded very differently, and therefore whose share prices fell very differently. The 2022 drawdown was not a uniform event hitting the asset class as a block; it was a correction targeted on the segments whose rents the market doubted. The rate cycle supplied the common impulse; the sector composition of each portfolio determined the depth of the fall. The single index figure averages those very different outcomes into one number that fits no individual vehicle.
Why “crash” is the wrong word
By 2023, the same Nareit index was rebounding by more than 11%, the listed adjustment already digested, even as appraisal-based vehicles were only beginning to mark down. This lead-lag is the heart of the case. The listed market led: it repriced the rate shock in 2022, in real time. The unlisted market followed: appraisal-based funds, in Europe and the United States, recorded the same shock through 2023 and 2024, with roughly a one-year delay. A French SCPI’s mean share price, for instance, fell 4.9% over 2023 — the year listed REITs had already rebounded. Same variable, two clocks, recorded a full year apart.
The lag is most vividly seen in the unlisted vehicles that report on appraisal. Over the first nine months of 2022, while the listed REIT index was down more than 20%, the two largest American non-traded property funds — Blackstone’s and a Starwood-managed peer — were reporting portfolios up by roughly 12% to 13%, according to the research firm Stanger. Same kinds of assets, same rate shock, opposite signs on the page, separated only by the mode of recording: a continuous quote on one side, appraisals that had barely lifted their assumed cap rates on the other. The reported gain of the non-traded funds did not mean their buildings had appreciated; it meant the markdown had not yet been written. That divergence, visible inside a single year, is the lead-lag of the case study in its purest form.
Calling the listed move a crash is therefore half right and half misleading. The 2022 drawdown was indeed fast and severe, as a stock-market move. But it was not a sudden destruction of value; it was the immediate discounting of a rate shock whose effect the unlisted market would spend two more years confirming. By the time the slow side finished recording, listed REITs had moved on. Reading the listed drawdown as the moment value was lost, or the unlisted markdown as a fresh present shock, both miss the same point: the value moved once, with the cycle, and each vehicle merely chose when to write it down. Placing the episode in that grid — a vehicle whose value depends on the prevailing rate regime, read with its own lag — belongs to the sub-pillar on an asset read by regime. The fall also mechanically lifted trailing yields, a distortion handled in the satellite on what the drop does to yield.
The 2022 REIT drawdown is often read as the moment property value was destroyed, and the later unlisted markdown as a separate, fresh shock. Both misread the timing: the value moved once, with the rate cycle, and the two vehicles only differ in when they record it — the listed market in 2022, in real time, the appraisal-based one through 2023 and 2024, on a lag. On this point: The case for REITs or physical real estate.
Last updated — 12 July 2026
Disclaimer – Financial Information: The analyses, commentary, and content published on eco3min.fr are provided for informational and educational purposes only. They do not constitute investment advice or a solicitation to buy or sell financial instruments. Past performance is not indicative of future results. All investment decisions involve risk and are the sole responsibility of the reader.
Read next
Full pillar →Beneficiary Designations, the Step-Up in Basis, and the 10-Year Rule: How US Accounts Transfer at Death
At death, most US financial accounts pass outside the will, straight to a named beneficiary, under tax rules…
The Fee Stack in Variable Annuities: M&E Charges, Riders, and Subaccount Costs
A variable annuity does not carry one fee, but a stack of them. Mortality and expense charges, subaccount…
The Conventional 401(k)-Match-First Funding Order: Where It Comes From, How It Works
The question of what order to fund accounts in usually draws a fixed list, presented as a rule…