What Guaranteed Savings Products Have Paid: Fixed Annuity and Stable Value Yields Through the Rate Cycle

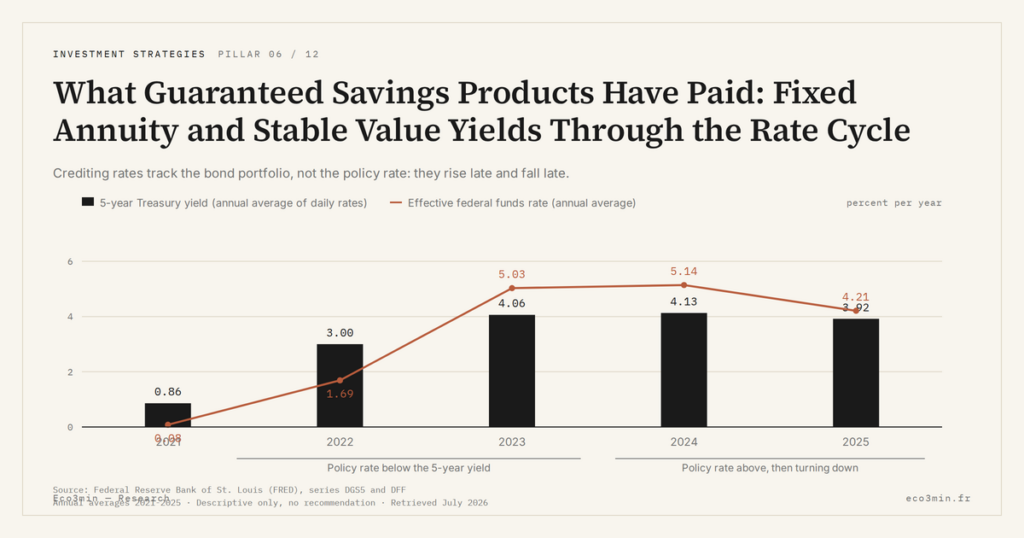
US guaranteed savings products credit a rate that trails the bond market rather than tracking it. Through the recent rate cycle, multi-year guaranteed annuities and stable value funds moved from lean crediting rates to near fifteen-year highs, with a lag that mirrors their European cousins.
The crediting rate is not the market rate. It reflects a bond portfolio’s yield, delayed and smoothed, which is why it rose slowly after 2022 and will fall slowly now that policy rates have turned.
Guaranteed US savings products credit a lagged, smoothed version of bond yields. Through this cycle they climbed to near fifteen-year highs before turning lower.
- Multi-year guaranteed annuity rates reached roughly 5% to 5.5% on five-year terms by 2025, near fifteen-year highs, well above their sub-2% low-rate-era levels.
- Fixed-rate deferred annuity sales topped 170 billion dollars in 2025, a record, per LIMRA.
- MYGAs typically pay 1.5 to 2 points more than comparable CDs; stable value funds smooth their crediting rate on a book-value basis, lagging most of all.
What the products credit, and through which cycle
Two products dominate the guaranteed-savings landscape in the US, and both pay a rate set by the bond environment rather than the stock market. The multi-year guaranteed annuity, or MYGA, is the simplest: a lump sum, a rate locked for a chosen term of two to ten years, tax-deferred growth, and no annual fee. The stable value fund, found mostly inside 401(k) plans, credits a smoothed rate backed by a portfolio of high-quality bonds wrapped in an insurance contract. Neither promises a market return; each promises a contractual one.
Through the recent cycle, both climbed sharply. In the zero-rate years around 2020 and 2021, MYGA rates sat in the low single digits, giving savers little reason to lock money away. As the Federal Reserve raised its policy rate toward 5.25% to 5.5% through 2023, insurers repriced, and five-year MYGA rates rose to roughly 5% to 5.5%, near their highest in fifteen years. The response was a flood of money: fixed-rate deferred annuity sales, the category that includes MYGAs, topped 170 billion dollars in 2025, a record, according to LIMRA, driven by those rates and by the wave of Americans reaching retirement age.
That demographic wave is not incidental. More than four million Americans a year are now reaching age 65, and a large share arrive seeking principal protection rather than market upside. A MYGA answers that demand directly, and at rates a bank cannot match: because an insurer invests in longer-dated bonds and keeps only a spread, a MYGA typically credits one and a half to two percentage points more than a comparable certificate of deposit. For a saver comparing safe options, that gap, compounded and tax-deferred over a five-year term, is the difference that has pulled record sums into these contracts.
That climb has a ceiling now behind it. The Federal Reserve began cutting rates in the second half of 2025, and MYGA crediting rates started to drift lower in response, though they remained near fifteen-year highs into 2026. The pattern is the essential one for a saver to grasp: a credited rate is a portfolio’s yield, delayed and smoothed. It rose slowly on the way up and will fall slowly on the way down, always a step behind the market that sets it.
The lag and the spread
The lag is not an accident; it is how these products are built. An insurer issuing a MYGA buys bonds to match the guarantee and credits the saver a rate derived from those bonds’ yields, keeping the difference, the spread, as its margin. A stable value fund goes further, using book-value accounting to smooth market swings so that the crediting rate moves gradually even when bond prices lurch. The result, in both cases, is a rate that reflects a portfolio assembled over years, not the yield available on any given morning.
This is the same mechanism that governs a European guaranteed fund, and it produces the same delayed reaction to the rate cycle, a point developed in the analysis of why a credited rate lags the cycle. The MYGA locks its rate for the full term, so a contract bought in 2024 keeps its rate even as new-issue rates fall; the stable value fund adjusts its crediting rate slowly, quarter by quarter, as its portfolio turns over. Both trade the immediacy of a market yield for the stability of a smoothed one.
The lock-in has a concrete edge. A saver who bought a five-year MYGA at 5.5% in 2024 keeps that rate through 2029, even as new contracts issued in 2026 credit less. That is the reward for accepting the surrender period: a rate frozen above the market it has since left behind. The mirror image applies to anyone who locked in during 2020 and 2021, still earning a low-rate-era yield with years to run. The crediting rate a saver holds is therefore a snapshot of the bond market on the day they signed, not a live quote, and the surrender schedule is what keeps that snapshot in force.
The trade-off has a floor and a cost. Most MYGA contracts guarantee a minimum renewal rate, often set near 1% at the low end though some reach 2.55%, so the downside is bounded. The cost is liquidity: surrender charges apply to withdrawals beyond a free allowance, usually around 10% a year, during a surrender period that matches the guarantee term. The saver accepts limited access in exchange for a locked, above-market rate, which is precisely the bargain a bank certificate of deposit offers on a smaller scale.
Stable value deserves its own note, because most savers hold it without choosing it. It is a common default option in 401(k) plans, sitting where a money-market fund might, but crediting a higher, smoothed rate through an insurance wrapper that lets the fund report a stable book value even when its underlying bonds move. That wrapper is the source of both its appeal and its cost: it delivers a steadier rate than a bond fund, but its crediting rate lags the market more than any MYGA, and the guarantee depends on the wrap provider’s standing. In a plan menu, it is the quiet, conservative anchor few participants examine closely.
What the crediting rate means for a saver
A rate near fifteen-year highs is attractive in nominal terms, but the saver’s real return still depends on inflation, and here the recent cycle was kinder than in Europe’s peak. As US inflation receded from its 2022 peak toward the low single digits in 2024 and 2025, a 5% MYGA rate delivered a clearly positive real return, unlike the guaranteed products that were underwater during the high-inflation years. The lag cuts both ways: locking a high rate for several years now preserves it even as new-issue rates fall, but it also means a saver who locked in during the low-rate era is still earning that lean rate today.
Against a bank CD, the MYGA usually leads. It pays 1.5 to 2 percentage points more on comparable terms and grows tax-deferred, so no interest is lost to annual taxation along the way, though withdrawals are eventually taxed as ordinary income and an early withdrawal before age 59 and a half can draw a federal penalty. The principal is protected by the insurer’s claims-paying ability and state guaranty associations rather than by federal deposit insurance, a distinction that matters at the margin of credit risk. Placed in the wider frame of which vehicle holds a saver’s money, this sits alongside guaranteed savings read through the rate regime.
Renewal is where the smoothing shows its limits. When a MYGA term ends, the contract renews at the carrier’s then-current rate unless the saver moves the money, and that rate can be far below the original if the cycle has turned. The minimum guaranteed renewal rate, often near 1%, is the only floor, and it is a low one on most contracts. Laddering terms, the way savers ladder CDs, spreads that renewal risk across years rather than concentrating it on a single maturity date. The locked rate is a benefit during the term and a decision to make again at its end. A high rate today is not a high rate for life.
- MYGA rates rose from the low single digits in 2020 to 2021 to roughly 5% to 5.5% on five-year terms by 2025, near fifteen-year highs, then began drifting lower after the Fed’s 2025 cuts.
- Fixed-rate deferred annuity sales set a record above 170 billion dollars in 2025 (LIMRA), driven by those rates and by demographics.
- Both MYGAs and stable value funds credit a lagged, smoothed portfolio yield, not the current market rate; the insurer keeps the spread.
- MYGAs typically pay 1.5 to 2 points over CDs and grow tax-deferred, but lock liquidity through surrender charges and carry insurer credit risk rather than FDIC insurance.
A note on the data
Public, standardized history for US guaranteed-savings crediting rates is thinner than for a European guaranteed fund, whose market average is published each year by the profession. The figures here therefore focus on the recent rate cycle, roughly 2020 through 2026, where carrier rate feeds, LIMRA sales data and Federal Reserve policy rates give a firm reading, rather than reconstructing a deep multi-decade series that would rest on weaker ground. Where a precise historical crediting rate is not available from a reliable source, this page describes the direction rather than inventing a figure. Rates cited are illustrative of the market and vary by carrier, term and date; past rates do not predict future ones, and any quote should be checked against the carrier’s current schedule. More on this: the overview “Choosing investments in the light of the macro cycle”.
Last updated — 1 August 2026
Disclaimer – Financial Information: The analyses, commentary, and content published on eco3min.fr are provided for informational and educational purposes only. They do not constitute investment advice or a solicitation to buy or sell financial instruments. Past performance is not indicative of future results. All investment decisions involve risk and are the sole responsibility of the reader.
Read next
Full pillar →The Fee Stack in Variable Annuities: M&E Charges, Riders, and Subaccount Costs
A variable annuity does not carry one fee, but a stack of them. Mortality and expense charges, subaccount…
The Conventional 401(k)-Match-First Funding Order: Where It Comes From, How It Works
The question of what order to fund accounts in usually draws a fixed list, presented as a rule…
Roth IRA vs Traditional 401(k): Two Shelters, Two Clocks, Two Tax Treatments
A Roth IRA and a traditional 401(k) are both tax-sheltered, but they are not two flavors of one…