
REITs and the rate cycle: how listed property reprices

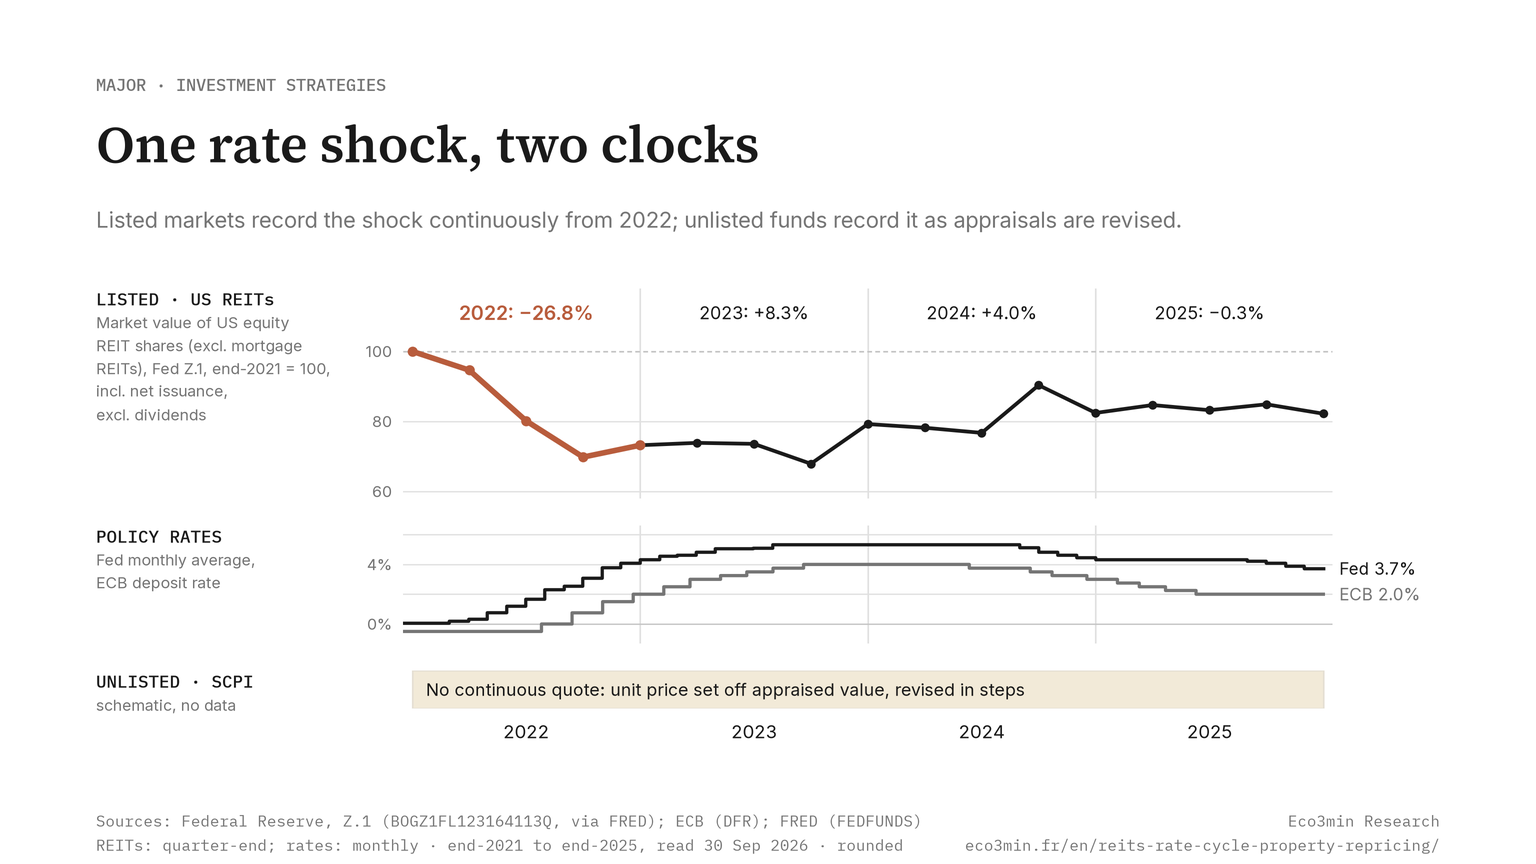
A REIT’s share price does not track its dividend; it tracks the capitalization rate the market demands on property. When policy rates rise, that cap rate follows, appraised values fall, and the listed price reprices at once — long before unlisted funds move.
TL;DR
The FTSE Nareit All Equity REITs index returned -24.9% in 2022, its worst year since 2008; listed property marks the cap-rate shock at once, while appraisal-based funds reprice over years.
- The office sector, most exposed to higher rates and to remote-work questions, lost 37.6% in 2022; by 2023 the same index had rebounded more than 11%, the listed adjustment already digested.
- Across 2022 the Federal Reserve lifted the federal funds rate from near zero to above 4%, reaching the mid-5% range by mid-2023, the fastest tightening in four decades, while the ten-year Treasury yield rose about 236 basis points to near 3.9%.
- A denominator effect deepened the divide: unable to sell illiquid unlisted property, institutions sold the liquid listed REITs to rebalance, adding downward pressure unrelated to fundamental value.
Listed real estate sits in the income bucket of most allocations. Read through the rate cycle, it behaves first as an asset whose value is governed by a market variable, not by the payout it advertises.
Most screeners rank listed real estate by headline dividend yield, as if a REIT were a fixed coupon. That static view misses the variable that actually governs price: the capitalization rate, the yield the market demands to own property. When policy rates rise, cap rates follow; at given rents, appraised property values fall; and the price reprices. But a listed REIT does so in real time, marking to market, where appraisal-based vehicles lag by quarters. The 2022 listed-REIT drawdown, tracked in the FTSE Nareit series, showed how fast the public market moves when rates spike, well ahead of unlisted funds that only repriced through 2023 and 2024. This article sets out the rate-to-cap-rate-to-value-to-price transmission, explains why the listed price moves first, and routes to the cluster satellites for how cap rates set REIT prices, the 2022 episode, yield versus total return, the discount to net asset value, the listed-versus-unlisted divide, and leverage. A complementary angle: the container grid for listed property.
The cap rate is the variable that sets the price
An office building that is leased produces an annual rental income. To turn that flow into a value, the market applies a divisor: the capitalization rate. If an asset earns one million dollars of net rent a year and the market capitalizes that kind of property at 4%, its value comes to twenty-five million dollars. Let the cap rate move to 5% and, at unchanged rents, the value falls to twenty million. The income has not moved by a dollar; the value has lost a fifth. It is this arithmetic, not the level of rent, that explains most of the price moves in investment property across a rate cycle.
The cap rate is not an administered number. It reflects the constant arbitrage investors make between holding bricks and holding other yield-bearing assets, foremost among them government bonds. When the ten-year Treasury yield climbs, property must offer more to stay competitive: the real-estate risk premium stacks on top of a higher risk-free rate, and the cap rate the market demands rises with it. The move is neither instant nor mechanical to the basis point, because property transactions are scarce, slow, and privately negotiated. But the direction is unambiguous: a rising rate cycle pushes cap rates up, and appraised values down. Further detail: the equity exposure inside unit-linked savings.
This is where the first reading error sits. A REIT’s dividend yield divides the payout by the share price. It measures current income. It says nothing about the value of the underlying portfolio, which depends on the cap rate. Two REITs showing the same dividend yield can hold assets valued at very different cap rates, and therefore carry very different capital risk across the cycle. Confusing the advertised payout with the health of the underlying portfolio is like judging a bond on its coupon alone while ignoring its market price. Related work: the withdrawal choice at retirement.
The cap rate is therefore the belt that connects monetary policy to the value of bricks. It turns a rate decision taken in Washington into a change in the value of a logistics warehouse outside Memphis or an office tower in midtown Manhattan. Hold that belt, and the behavior of listed property in the cycle stops being a black box.
The gap between the cap rate and the risk-free rate deserves particular attention, because it is what makes property attractive or not against bonds. That gap, the real-estate risk premium, pays for illiquidity, leasing risk, obsolescence, and management. Through the decade of near-zero rates that followed the financial crisis, a risk-free rate pinned close to zero let prime cap rates drift to very low levels — at times below 4% on the best offices or the best logistics — not because bricks had become safer, but because no remunerative alternative remained. The 2022 tightening reversed that logic at a stroke. By lifting the risk-free rate by several points, it made the return offered by assets capitalized at low single digits mechanically insufficient. For the risk premium to return to a coherent level, two adjustments were possible: rents rise, or prices fall. Rents being rigid in the short run, the adjustment came through prices. This compression and decompression of the risk premium is the silent engine behind every property repricing in a cycle, and it applies indifferently to a listed REIT and to a French SCPI, because both hold the same kind of capitalized rental flow.
From the policy rate to the REIT price: the transmission chain
The transmission runs through four links, each introducing its own delay. Understanding those delays is the key to the whole cluster, because it is their accumulation that produces the lag of an appraisal-based price — and, conversely, the immediacy of a listed one.
First link: the policy rate sets the cost of money. Across 2022, the Federal Reserve lifted the federal funds rate from near zero to above 4%, and on into the mid-5% range by the middle of 2023 — the fastest tightening cycle in four decades. Published in the Federal Reserve’s record of FOMC decisions. Over the single year of 2022, the ten-year Treasury yield rose by roughly 236 basis points, from 1.52% to 3.88% (Federal Reserve, DGS10 series). The reference cost of capital, on which all investment property is indexed, had more than doubled.
Second link: the cap rate the market demands rises. Property investors who could accept a 3% to 4% return on a prime office when money cost nothing now require more, to offset dearer financing and the renewed appeal of bonds. This link is slow: it takes actual transactions to reveal the new cap-rate level, and transactions dried up during the shock, with sellers refusing to crystallize the markdowns buyers were demanding. The market entered a standoff in which the “true” price was negotiated more than observed.
Third link: appraised value falls. Independent valuers, who periodically reassess fund portfolios, eventually fold in the new cap rates seen on the rare comparable transactions. It is a cautious, staggered process that records the decline rather than anticipating it. For why property prices rise or fall in the first place, independent of any vehicle, the mechanics belong to the real-estate credit cycle and price formation, covered separately; this article stays on the price of the share, not the price of the walls.
Fourth link: the price aligns with value. Here the two structures part ways sharply. An unlisted vehicle waits for the appraisal to move before its share price changes, so the markdown arrives quarters after the policy decision. A listed REIT does the opposite: its quote is set continuously by the stock market, which integrates the rate shock in a few sessions, sometimes a few hours, long before any valuer revises a number. Between the central-bank decision and the move in a listed price, days can pass; between the same decision and the move in an unlisted share price, several quarters. The variable is identical; only the recording speed differs.
A fifth, indirect effect widens the gap between listed and unlisted during the transmission: the denominator effect on institutional portfolios. When public markets fall, the relative weight of unlisted real estate — whose value has not yet moved — rises mechanically in large investors’ allocations. To return to their target property exposure, those investors must sell; yet they cannot sell the illiquid real estate that is the problem, so they sell what they can, namely listed real estate, which is perfectly liquid. This forced sale of the liquid because the illiquid cannot be sold adds downward pressure on listed REITs that has nothing to do with their fundamental value, and widens the price gap between the two vehicles at the peak of the shock. The listed side does not merely record the shock faster: it also pays for the liquidity the unlisted side is denied. It is one of the most counter-intuitive paradoxes of the cycle: liquidity, sold as an advantage, becomes a channel that amplifies the fall for the only vehicle that has it. Related material: Private Real Estate Funds vs Direct Rental Property: Pooled Exposure or Landlord Economics.
Why a listed REIT reprices in real time
The immediacy of the listed price is not a flaw of public markets, any more than the lag of an appraisal is a virtue of private ones. Each follows from its mode of valuation. A listed REIT has a continuous market price, set by buyers and sellers who discount expected rents at a discount rate that moves with the bond market. The moment Treasury yields jump, that discount rate jumps, and the present value of future rents falls in the quote — before a single building has changed hands, before a single appraisal has been refreshed. The listed market anticipates; the appraisal merely confirms, later.
An unlisted, appraisal-based vehicle works the other way. Its share value rests on periodic valuations, generally refreshed once a year, smoothed by construction between two campaigns. It absorbs shocks late, in steps, at the pace of revaluation. That inertia has a virtue — it spares the saver the daily volatility of markets — and a cost: it masks, for a time, an economic reality that has already moved. On the same building held by two vehicles of different structure, the same rate rise therefore produces two diametrically opposed recording calendars. This divergence of timing, not a difference of view on real value, is the analytical core of the cluster; it is taken head-on in the satellite devoted to listed versus unlisted property and the lag between them.
The clearest demonstration of that divergence came not from the contrast between a REIT and a stock index, but from within real estate itself, on the large non-traded REITs aimed at retail investors. Over the first nine months of 2022, while the listed REIT index was losing more than 20%, the two largest American non-traded property funds — Blackstone’s Real Estate Income Trust and a competitor managed by Starwood — were instead reporting portfolios up by roughly 12% to 13%, according to data from the research firm Stanger. Same kinds of assets, same rate shock, two opposite recordings: on one side a continuous quote repricing in real time, on the other appraisals that had barely lifted their assumed cap rates — Blackstone’s vehicle had, by the autumn of 2022, raised its assumed cap rates by only about 14% on residential and 6% on logistics. The reported gain of the non-traded fund did not mean the buildings had appreciated; it meant the decline had not yet been written down. The market adage that the absence of a quote does not remove the loss of value, only its recording, was never more literally borne out. A related perspective: REITs in Tax-Advantaged Accounts: Why Ordinary-Income Dividends Raise the Asset-Location Question.
On the unlisted side, that smoothing rests on a precise valuation machinery that governs the calendar of markdowns. The portfolio is appraised periodically, producing an appraised value from which a net asset value or, on European vehicles, a reconstitution value is derived — what it would cost to rebuild the portfolio, fees included. The price the saver pays is then set off that value, and on appraisal-based European vehicles it must stay, by regulation, within a band of plus or minus 10% around the reconstitution value. As long as falling appraisals keep the subscription price inside that band, the manager is not obliged to act. It is only when the gap crosses the threshold — when the subscription price exceeds a reconstitution value that has receded by more than 10% — that the markdown becomes mandatory. The band acts as a buffer: it absorbs the first points of appraisal decline before it gives way, which is why unlisted markdowns arrive in clean steps rather than gradually, and can concentrate into a few weeks after months of apparent stability. A listed REIT has no such buffer; its quote slides continuously, point by point, with no regulatory band to dampen the path. More context: how guaranteed funds buffer the rate cycle.
The lag has a second, less intuitive consequence: it desynchronizes the share price from the rate cycle itself. By the time an appraisal-based price finally falls, policy rates have sometimes already begun to recede. The holder of an unlisted vehicle records a past shock at the very moment the macro backdrop is clearing. A listed REIT, having repriced at the top of the rate move, can already be recovering on the same day the unlisted markdowns land. This desynchronization is a source of misreading: it leads an observer to read a falling unlisted price as a present signal, when it is the delayed echo of an earlier event.
2022: the listed drawdown that led the cycle
The 2022-2023 tightening offered a full-scale observation of this timing divergence. Both sides of paper real estate recorded the same shock, but on different dates, in different proportions, and through different mechanisms. A fuller treatment of the contrast sits in REITs versus physical real estate, by the data.
On the listed side, the adjustment was immediate and severe. In 2022, the FTSE Nareit All Equity REITs index posted a total return of -24.9%, its worst year since 2008, when it had fallen 37.7%, according to Nareit data. The office sector, most exposed both to higher rates and to lasting questions over remote work, lost 37.6% on the year. The stock market had repriced the entire cap-rate shock within twelve months, in real time, as the rise in the ten-year yield unfolded. By 2023, the same index was rebounding by more than 11%, the listed adjustment already digested. The episode is decomposed step by step, with the figures, in the satellite devoted to the 2022 REIT drawdown and its transmission.
What made the listed drawdown so clean an illustration is that it tracked the rate move almost in lockstep. As the ten-year Treasury yield climbed through the year, the REIT index gave ground in step, with the deepest losses concentrated in the months of the sharpest yield rises. The public market was not waiting for evidence of distressed sales or revised appraisals; it was discounting the new cap rate the instant the discount rate moved. By the time the year closed and the yield had stabilized near 3.9%, the index had already priced a cap-rate expansion that the unlisted market would spend the following two years confirming, transaction by transaction and appraisal by appraisal. The contrast is the whole point: one market repriced the expectation, the other recorded the realization, and the months that separated them were the lag itself, made visible on a single shared shock.
On the unlisted side, the same shock was recorded later and in more muted fashion. In Europe, the appraisal-based vehicles that mirror American non-traded REITs — French SCPIs among them — saw their share prices fall mostly through 2023 and 2024, the years in which the listed market had already rebounded. The mean SCPI share price, weighted by capitalization, fell by 4.9% over 2023 according to the French association ASPIM, with a handful of office-heavy vehicles cutting their subscription price in several successive steps. The repricing of the unlisted side therefore unfolded across 2023 and 2024, with roughly a one-year lag on the listed side, and continued to spread into 2025.
The calendar gap — 2022 for the listed market, 2023 through 2025 for the unlisted one — is not a failure of symmetry between the two markets. It is the argument. It shows that the same variable, the cap rate pushed by the rate cycle, governs both vehicles, and that only the speed of recording differs. For a continuous proxy of the shock, the bond and mortgage markets offer reference series: the real mortgage rate series documents, in real time, the dearer financing that fed the rise in cap rates.
The shock’s size depends on the property segment
Speaking of listed real estate in the singular hides a considerable dispersion by the nature of the assets held. The cap rate does not rise by the same number of points across every segment, because the risk premium demanded differs with the perceived durability of future rents. The 2022 cycle illustrated this sharply on the listed side: while the broad index of American REITs fell 24.9%, the office segment shed 37.6% on the year, whereas so-called specialty assets lost only 0.8%, retail 13.3%, and lodging 15.3%, according to Nareit. The same rate shock struck every segment, but its magnitude turned on whether the underlying rents were in doubt. Offices, doubly exposed to higher rates and to lasting questions over remote work, concentrated the bulk of the correction.
The dispersion recurs on the unlisted European side, in the same order. In 2023, office-heavy SCPIs carried the lowest distribution rate, around 4.1%, and concentrated almost all the share-price cuts, while logistics and light-industrial vehicles, carried by e-commerce, held distribution rates near 5.9% and largely preserved the value of their shares, according to ASPIM. Diversified vehicles, less concentrated by construction, also held up better. This heterogeneity has a direct bearing on how the vehicle is read in the cycle: the repricing was not a uniform phenomenon hitting the asset class as a block, but a correction targeted on the segments whose future rents were in question. Judging a REIT in the aggregate, without looking at the sector composition of its portfolio, is to ignore the variable that separates a heavily corrected vehicle from one that stayed stable through the same rate shock.
This sectoral dispersion forbids any hasty generalization about how listed property behaves against rates. It does not contradict the central mechanism — it is always the cap rate that sets the price — but it is a reminder that this rate embeds an appreciation of leasing risk specific to each segment. The rate cycle supplies the common impulse; the composition of the portfolio determines the amplitude of the response.
Reading the payout without confusing yield and value
The transmission lag produces an optical illusion on yield that any reader of paper real estate must learn to defeat. The dividend yield divides the payout by the price. Now, when the share price falls, the denominator of that ratio shrinks. At an unchanged dividend, the advertised yield rises. A decline in the value of the vehicle can therefore translate, paradoxically, into a higher published yield.
The episode in unlisted Europe supplied the exact illustration. The mean SCPI distribution rate rose from 4.52% in 2023 to 4.72% in 2024, a gain of twenty hundredths of a point. ASPIM itself noted that the increase was explained by the 4.9% fall in the mean share price over 2023, while the mean dividend actually paid had fallen by 3% over the period. The yield was rising while the income was falling and the value was receding. Reading that 4.72% as an improvement in the return of the placement would have been a contradiction in terms: it was the mechanical effect of a shrinking denominator, not a growing numerator. The same arithmetic governs a listed REIT whose price has fallen: a quote down 20% over the year lifts the trailing yield even as the total return turns deeply negative.
This mechanism makes it necessary to separate three quantities that commercial language tends to fuse into one. The dividend yield measures current income against the entry price. The change in the share price measures the capital gain or loss. Total return combines the two: a 5% dividend yield alongside a 20% fall in price gives a deeply negative total return, whatever the headline figure suggests. A vehicle can therefore advertise a flattering yield and deliver a poor total return over the same period. The distinction between the advertised dividend yield versus total return is developed in the satellite devoted to reading the payout, which also details the capital risk specific to the vehicle.
This point is not an accounting subtlety. It touches the very nature of the asset. Listed real estate is not a rate product serving a contractual coupon: it is a fraction of property ownership whose value fluctuates with the cycle. The income distributed is real, but it comes with a capital risk that is neither guaranteed nor constant. No past return prejudges future performance, and the value of a share can fall as it can rise. Reading a REIT like a bond is to ignore precisely the variable — the cap rate — that makes it a cyclical asset. A broader view: How REIT Distributions Are Taxed: Ordinary Income, Return of Capital, and the 199A Deduction.
It is often assumed that an appraisal-based fund whose share price did not fall during a rate shock was spared by that shock. In reality, the appraisal-based mode of valuation smooths and defers the recording of the decline, which then materializes in steps several quarters later; the stability shown during the shock is a deferral in time, not an immunity.
Vehicle-level risk: the discount to NAV, the redemption gate, and leverage
Beyond the capital risk tied to the cap rate, paper real estate carries two structural risks that the cycle amplifies and that the advertised yield never reveals: liquidity and leverage. They take a different form on each side of the listed-unlisted divide, but they answer to the same rate cycle.
On the listed side, liquidity is permanent — the share trades instantly on the exchange — but at a price that can drift durably from net asset value, at a discount or a premium. Through 2022 and 2023, many listed REITs traded at wide discounts to the appraised value of their portfolios, the market signaling that it expected those appraisals to fall further. The discount to NAV is not a defect of the listed market; it is the listed market doing in public what the unlisted market does in private, only sooner and more visibly. The behavior of the discount to net asset value is examined in the dedicated satellite, which mirrors the listed discount against the redemption queue of the unlisted side.
The discount itself is a price the market sets on information the appraisal has not yet caught up with. When a listed REIT trades at, say, a fifth below the stated value of its portfolio, the quote is not declaring the appraisal wrong; it is declaring it stale, and pricing the markdown it expects the valuers to make later. In that sense the discount to NAV is a forward-looking estimate of where appraisals are heading, expressed in real time by the only participants — public-market buyers and sellers — who cannot defer. The reverse holds in an easing phase: when the market expects appraisals to rise, listed REITs can trade at a premium to a NAV that still reflects yesterday’s lower values. Read this way, the discount is less a defect of the listed vehicle than a continuous referendum on the credibility of the appraisal, and the width of the discount carries information about how far the market thinks the recorded value still has to travel.
On the unlisted side, liquidity is conditional. The clearest illustration came, again, from the American non-traded funds. At the end of November 2022, Blackstone’s Real Estate Income Trust, a non-traded property fund of roughly seventy billion dollars aimed at individual investors, triggered the redemption-cap clause written into its rules: with withdrawal requests exceeding the monthly and quarterly limits set in advance, the fund honored only a fraction of orders — on the order of 43% of requests in November — and applied a proration for some fifteen months, until it met redemptions in full for the first time in February 2024. The Starwood-managed competitor put a comparable restriction in place at the same moment, and several billion dollars of exit requests were deferred over the period. The mechanism is exactly that of the redemption queue on European appraisal-based funds: when the appraised value has not yet fallen but holders anticipate the correction, exits flood toward a vehicle whose assets are illiquid by nature, and the door narrows. The liquidity of an unlisted property placement is never that of the underlying asset; it is a liquidity of structure, abundant while inflows exceed redemptions, rationed the moment the ratio inverts. The visible volatility of the listed side and the queue of the unlisted side are two ways of billing the same service — the ability to exit — at two different moments of the cycle. Related framing: how REITs move with the rate cycle.
Leverage is the second amplifier. For a listed vehicle, it sits inside the company itself, as property financing debt that must be refinanced at maturity. For a European saver buying SCPI units on credit, it sits at the level of the investor. In both cases, leverage magnifies the risk-return pair in the same direction as the cycle: it amplifies gains in the easing phase and losses in the tightening phase. When rates rise, two effects compound — the cost of debt rises and the value of the asset falls — exactly the configuration of 2022 and 2023. The asymmetry of leverage in the cycle, its tipping point, and the difference between the investor’s leverage and the vehicle’s leverage are described in the satellite devoted to vehicle-level leverage and refinancing, as a mechanism to understand, with no triggering threshold and no recommendation to use it or to avoid it.
Vehicle leverage opens a second transmission channel, distinct from the cap-rate channel: the refinancing wall. A listed vehicle or a leveraged fund contracted its debt on past terms; at maturity, it must refinance at the rates of the day. If the cycle has lifted the cost of credit between the time the loan was put in place and its renewal, the cost of debt rises on the refinanced portion, which compresses distributable income independently of any change in property values. This cash-flow channel acts even when the cap rate has stabilized: the appraised value may have stopped falling while the distributable result keeps eroding as refinancings roll through. The maturity schedule of the debt then becomes a reading variable in its own right, since a vehicle whose debt matures heavily at the peak of the rate cycle carries a risk that its cap rate alone does not reveal. This dimension partly explains why some vehicles, whose buildings had not particularly underperformed, saw their distributive capacity deteriorate during the tightening: it was not their portfolio that was weakening, but the cost of financing it that was rising at each maturity crossed. Leverage, here too, does not create the cycle risk; it multiplies its transmission, through the income statement rather than the balance sheet. A parallel read: our mapping of the real-estate access routes.
To place paper real estate in the cycle, three questions suffice: where the cap rate the market demands stands relative to the risk-free rate, how fast the vehicle records that rate (continuous quote or smoothed appraisal), and which amplifiers — liquidity, leverage — can harden the transmission. These three axes describe the behavior of the vehicle without presuming anything about the future direction of rates.
The cycle is symmetric: the clock runs both ways
The 2022-2025 cycle exposed mainly the downward face of the mechanism, but the cap rate governs the share price symmetrically: what lowers the value in a tightening phase raises it in an easing phase. The 2020-2021 period had offered the inverse demonstration. Policy rates at the floor and abundant liquidity kept the risk-free rate very low, compressed the premium demanded on property, and supported low cap rates, hence elevated values. In that regime, listed REITs traded at premiums to NAV and many appraisal-based vehicles revalued their shares upward, as appraised values rose. The same transmission chain was then working in the favorable direction, link by link, with the same recording lag as on the way down.
The concrete record of that easing phase is instructive. Through 2021 and into early 2022, before the tightening began, a number of appraisal-based European vehicles lifted their subscription prices as appraised values rose, in a range running from under 1% to more than 7% depending on the vehicle, while listed REITs in the United States traded at premiums to net asset value — the market pricing the expectation that appraisals would keep rising. Both sides were recording the favorable move, the listed one in real time through the premium, the unlisted one in steps through the upward revaluations, with the same calendar gap that would later separate them on the way down. The 2022 reversal then ran the entire chain backwards: the premium turned to a discount on the listed side within months, and the upward revaluations turned to markdowns on the unlisted side over the following two years. Nothing in the mechanism changed sign except the direction of rates; the recording lag, and the gap between the two clocks, behaved identically in reverse.
That unlisted lag is symmetric too, and this is where it can work for the already-invested holder rather than against. When rates begin to recede and listed markets rebound — the FTSE Nareit All Equity REITs index regained more than 11% as early as 2023, after its prior-year fall — the unlisted side records the easing only with the same delay it showed on the way down. The holder of an appraisal-based share whose value has not yet folded in the recovery of underlying prices then carries an inventory value that lags economic reality, in the right direction this time. The desynchronization between the share price and the rate cycle, already described on the way down, therefore holds on the way up: the delayed recording can make a unit look still subdued while financing conditions have already cleared, just as it had made one look stable while the underlying had already fallen.
This symmetry is not a prediction about the near-term direction of rates, nor an invitation to position for any particular moment of the cycle. It is the confirmation that the engine described in this article is bidirectional: the cap rate, pushed by the cycle, sets the share price up as well as down, and the mode of valuation — smoothed appraisal or continuous quote — only shifts in time the recording of the move, whatever its sign. The decline in the weighted average SCPI share price continued after 2023 at a slowing pace: -4.5% in 2024, then -3.45% in 2025 according to ASPIM, about -12% cumulated over three years, while the average distribution rate rose to 4.91% in 2025. That deceleration illustrates a drawn-out adjustment step more than a turning point: the unlisted clock always ends up catching the listed one, in one direction as in the other, but with a lag that forbids reading the displayed value as a signal of the present.
Situating listed property in a read through the cycle
Listed real estate is only one asset among others whose behavior depends on the rate and credit regime. Placing it back in that grid, rather than judging it in isolation on its dividend yield alone, is the purpose of the sub-pillar that invites the reader to choosing investments across rate cycles and market regimes. The same logic of transmission through rates governs other asset classes, with different sensitivities and different calendars.
Bond exposure offers the most direct counterpoint. A fixed-rate bond loses value when rates rise, immediately and transparently, without the recording lag specific to unlisted property. Comparing the two trajectories — the instant adjustment of a bond ETF’s exposure to the rate regime and the deferred repricing of appraisal-based property — clarifies what the mode of valuation adds to, or subtracts from, raw rate sensitivity. For the formation of property prices themselves, upstream of the vehicle, the real-estate credit cycle remains the reference frame, distinct from the placement-level read developed here.
That kinship with the bond illuminates a useful intuition: against rates, paper real estate behaves like a long-duration asset. The further out the expected income, the more sensitive the capitalized value is to a change in the discount rate, exactly as a long-dated bond falls more than a short one for the same rise in yield. A prime office portfolio leased over long terms, whose value rests on rents projected far into the future, therefore sees its valuation react more violently to a rate shock than an asset with shorter or more inflation-indexed income. The difference from the bond lies in the mode of recording, not in the nature of the sensitivity: duration acts in both cases, but the listed market writes it down continuously where the unlisted market defers it. Thinking of paper real estate in terms of duration rather than coupon places the vehicle in the same risk family as long-dated rate assets, and makes legible a behavior that looks erratic as long as it is judged by the distributed yield alone.
Finally, the position of the vehicle in the cycle is read not in absolute terms but relative to the prevailing macro regime. The current macro regime — a phase of tightening, plateau, or easing, with more or less abundant liquidity conditions — determines whether the cap rate is under upward pressure or on a path to relief, and therefore whether the unlisted recording lag works against or for the already-invested saver. Real property-price series, such as the American real housing price index, offer a long-run benchmark for telling a cycle adjustment apart from a structural turning point. Read alongside: the dependence of investment choices on the cycle.
Listed real estate is not a fixed-coupon income product: it is a cyclical asset whose cap rate, not its advertised dividend yield, governs the value.
A clock, not a shield
What the 2022-2025 cycle made plain is not a particular fragility of paper real estate, but the nature of the asset. A listed REIT and an unlisted SCPI hold the same walls, undergo the same cap-rate shock, and obey the same transmission chain; they differ only in the speed at which they write it into their price. The smoothing of the unlisted side is neither a guarantee nor an anomaly: it is a slower clock. The continuous quote of the listed side is neither recklessness nor superior insight: it is a faster clock. Understanding those clocks means ceasing to confuse the absence of a displayed fall with the absence of a real fall, and ceasing to read a dividend yield as a promise of performance. Two clocks for one asset is also a lesson in allocation, the reason listed property sits alongside the other lines of a portfolio built to hold across market regimes.
The practical consequence is a reading discipline, not a rule of action. A displayed yield describes income against a price; it says nothing about where that price stands in the cap-rate cycle, nor about how much recording the vehicle still has ahead of it. The same figure can sit on a listed share that has already absorbed a shock or on an unlisted share that has not, and the two carry that information very differently. Separating the recorded value from the value yet to be recorded is what the rest of the cluster sets out to do, segment by segment and vehicle by vehicle.
One open question remains that this frame does not settle: depending on whether one records a shock in real time or on a lag, one does not hold the same placement, even for identical walls. The visible volatility of the listed side and the deferral of the unlisted side are two ways of carrying the same risk, not two levels of risk. It is on that ground — the two clocks of a single mechanism — that the trade-offs described in the cluster’s satellites play out, without either structure being preferred to the other, and without any threshold, calendar, or allocation being suggested.
- The price of a paper-real-estate share is governed by the cap rate the market demands, itself driven by the rate cycle, not by the advertised dividend yield.
- The chain policy rate to cap rate to appraised value to share price carries several delays, whose accumulation explains the lag of an appraisal-based price and, conversely, the immediacy of a listed one.
- The listed market passes the shock through in real time (FTSE Nareit All Equity REITs -24.9% in 2022), the unlisted market on a lag and in steps (mean SCPI share price -4.9% in 2023, per ASPIM): same variable, two clocks.
- A fall in the share price can mechanically lift the advertised dividend yield, masking a degraded total return: a higher trailing yield can coincide with a deeply negative total return.
- Conditional liquidity — the discount to NAV on the listed side, the redemption gate on the unlisted side — and leverage are vehicle-level amplifiers that the rate cycle hardens and that the advertised yield does not reveal.
Last updated — 30 September 2026
Disclaimer – Financial and Legal Information: The analyses, commentary, and content published on eco3min.fr are provided for informational and educational purposes only. They do not constitute investment advice or a solicitation to buy or sell financial instruments. Past performance is not indicative of future results. All investment decisions involve risk and are the sole responsibility of the reader. Data, charts and calculated series are provided as is and may contain errors or lag behind their source: check any figure against the primary source cited before relying on it. Content describing laws, regulations or contracts reflects the law as of its publication date and does not constitute legal or tax advice; applying it to a specific situation requires a qualified legal or tax professional.
Read next
Full pillar →Target-Date Funds vs Self-Directed Portfolios: The Mechanics of a Delegated Glide Path
A target-date fund is sold as a simple, set-and-forget win. It is first something narrower: a delegated glide…
What Guaranteed Savings Products Have Paid: Fixed Annuity and Stable Value Yields Through the Rate Cycle
US guaranteed savings products credit a rate that trails the bond market rather than tracking it. Through the…
Beneficiary Designations, the Step-Up in Basis, and the 10-Year Rule: How US Accounts Transfer at Death
At death, most US financial accounts pass outside the will, straight to a named beneficiary, under tax rules…