
REIT dividend yield versus total return: reading the payout

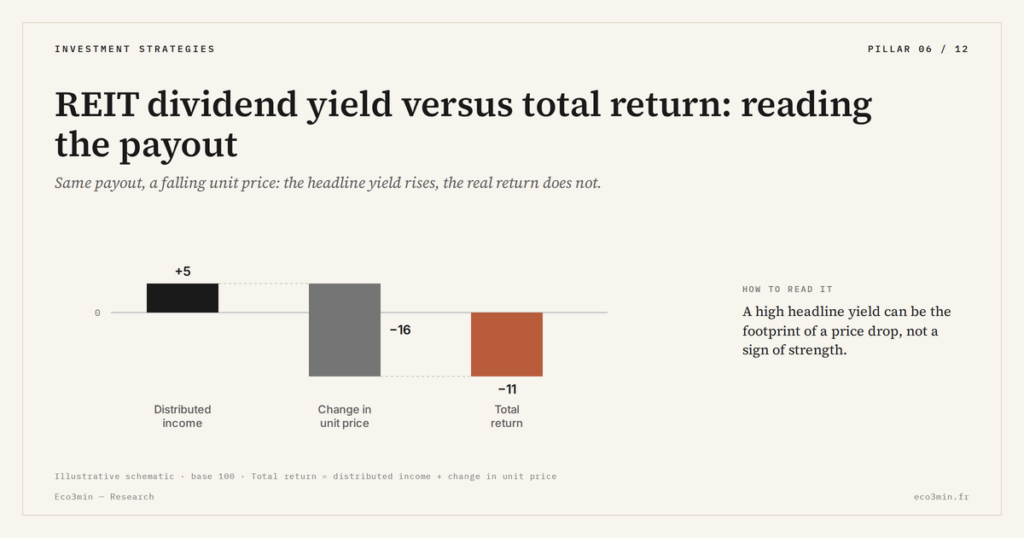
A REIT’s dividend yield divides the payout by the price. When the price falls, that ratio mechanically rises: a higher headline yield can therefore mask a degraded total return, once the move in the share price and the capital risk are taken into account.
TL;DR
A REIT's dividend yield and its total return measure different things: in 2022, the dividend yield of the FTSE Nareit All Equity REITs index rose from 2.59% to 3.97% even as its total return, dividends included, fell 24.95%.
- A screener sorting REITs by headline yield in early 2023 would have ranked near the top some of the very shares whose prices had fallen hardest: the highest yield can flag the most-corrected vehicle, not the soundest.
- Providers publish two parallel series, a price-return index tracking only quotes and a total-return index adding reinvested distributions; their gap is the dividend, and a deeply negative total return can sit beside a rising trailing yield.
Reading a REIT’s payout correctly means separating three quantities that screeners fuse into one. This article pulls them apart, and ranks no vehicle.
A REIT’s headline dividend yield — distribution divided by price — is the figure most screeners lead with. It is also the most incomplete. A 6% yield on a vehicle whose price falls 20% over the year does not deliver 6%: total return nets the price move against the distribution, and it can turn deeply negative while the yield still looks attractive. That is precisely what 2022 did to many listed REITs. Reading a REIT’s payout therefore means separating the distributed cash flow from total return, and acknowledging that the share carries genuine capital risk that the yield alone conceals. This article describes that distinction and how the rate cycle reshapes it, as part of reading yield against the rate cycle — without ranking vehicles or naming a best REIT, which would cross into advice.
What the dividend yield measures, and what it does not
The dividend yield is a simple ratio: the total distribution paid over a year, divided by the share price. It measures current income — the cash flow a holder received, set against the price paid to hold the share. As such it is useful information: it says how much the share paid out, in proportion to its value.
What the dividend yield does not measure is the value of the underlying portfolio. That value depends on the cap rate the market demands, not on the dividend paid. Two REITs showing the same yield can hold assets valued at very different cap rates, and therefore carry very different capital risk across the cycle. The yield is silent on this. It describes the income, not the health of the portfolio, nor the likely path of the share price. For more detail: our study on REITs and the rate cycle.
The common error is to treat the dividend yield like a bond yield — as a contractual income backed by stable capital. But a REIT share is not a principal redeemable at maturity: it is a fraction of property ownership whose value fluctuates. The income distributed is real, but it comes with capital risk that is neither guaranteed nor constant. Judging a REIT on its yield alone is like judging a bond on its coupon while ignoring its market price.
The denominator effect: a falling price lifts the headline yield
The subtlest trap lies in the construction of the ratio itself. The dividend yield divides the payout by the price. When the price falls, the denominator shrinks. At an unchanged distribution, the headline yield rises. A decline in the value of the vehicle can therefore translate, paradoxically, into a higher published yield.
The 2022 drawdown showed this on a large scale. As listed REIT prices fell through the year, by 27.46% on the price-return FTSE Nareit All Equity REITs index, the index’s dividend yield mechanically rose from 2.59% at end-2021 to 3.97% at end-2022, according to Nareit, because the price in the denominator was falling faster than the distribution in the numerator. A screener sorting by yield in early 2023 would have surfaced, near the top, some of the very vehicles whose prices had fallen hardest. The high yield was not a mark of strength; in many cases it was the arithmetic footprint of a deep price decline.
This has a direct consequence for comparing vehicles. At any given moment, a REIT whose price has already fallen can show a higher dividend yield than one whose price has not yet corrected, without that reflecting better performance — quite the opposite. The highest yield can flag the most corrected vehicle, not the soundest. Comparing yields without looking at the path of the share price is like comparing bond yields without looking at prices: it ranks on a figure that moves precisely because the other one moved. A screen that sorts vehicles by headline yield, with no view of where each share price sits in its own cap-rate cycle, will systematically rank the most-corrected vehicles above the least-corrected ones, and present that ordering as if it measured quality. Related study: our analysis of investing in REITs.
Total return: netting the price move against the payout
Total return corrects this blind spot by recombining the two quantities the yield implicitly separates: the distributed cash flow and the change in the share price. A 6% dividend yield alongside a 20% fall in price gives a deeply negative total return, whatever the headline figure suggests. The same vehicle can therefore advertise a flattering yield and deliver a poor total return over the same period.
The listed market makes this distinction explicit in the way it reports performance. Index providers publish two parallel series for REITs: a price-return index, which tracks only the change in quotes, and a total-return index, which adds reinvested distributions. The gap between the two is the contribution of the dividend. In a normal year that gap is positive and the total-return index sits above the price one. But in 2022 the price decline overwhelmed the distributions: the FTSE Nareit All Equity total-return index — the one that already includes dividends — still fell 24.95%, against 27.46% for its price-return twin, a gap of about two and a half points contributed by dividends. The payout did not rescue the year; it merely cushioned a far larger capital loss. That a total-return measure can be deeply negative while trailing yields rise is the clearest demonstration that the headline yield and the actual return are different quantities, and that only the latter answers the question of what the holder earned. Adjacent reading: REIT payouts and the ordinary-rate schedule.
A worked figure makes the arithmetic concrete. Take a share bought at 100 that pays 5 in distributions over the year — a 5% yield — but whose price falls to 84 as appraisals are marked down. The distributed flow is 5; the capital change is minus 16. Total return combines them: plus 5 of income against minus 16 of capital, or minus 11 on 100, a total return near minus 11% on the year. The yield recomputed on the lower price would read about 6%, higher than before. The placement lost money while its headline yield went up. Once tax on the distributed income is applied, the gap widens further, since the levy falls on the flow without regard to the unrealized capital loss. This example is purely illustrative: it describes no real vehicle and no future path, and serves only to show that a yield and a total return can point in opposite directions within the same period.
Three quantities must thus be kept apart. The dividend yield measures current income against the entry price. The change in the share price measures the capital gain or loss over the period. Total return combines the two and is the only complete measure of what the placement actually returned. A high yield is good news only if the share value has not fallen by as much; otherwise it is merely income drawn from an eroding value. This reading says nothing about what one should do; it says only what the figure actually means, leaving any decision to the reader and to their own circumstances, which this article does not assess. Related reading: how yield and payout shape a dividend screen.
What the rate cycle does to the reading
The rate cycle is exactly what drives a wedge between dividend yield and total return. In a tightening phase, rising cap rates push the share price down; total return deteriorates while the yield, inflated by the denominator effect, can look stable or even rise. In an easing phase the mechanics reverse: recovering share prices add a capital gain to the distributed flow, and total return exceeds the headline yield. The same yield figure therefore carries different information depending on where the cycle stands. Further reading: our analytical frame for investments and regimes.
This cycle-dependence is why the dividend yield, read alone, is a misleading benchmark for comparing placements at different moments. The relevant grid is not a ranking of headline yields but a reading of each vehicle through the prevailing rate regime, which the sub-pillar on comparing assets by regime develops. One further angle this article leaves aside: the share also carries a liquidity risk, distinct from capital risk, that can prevent exiting at the displayed price. That capital and liquidity risk of the vehicle is the subject of a dedicated satellite.
- The dividend yield measures current income against the share price; it says nothing about the value of the underlying portfolio, which the cap rate governs.
- When the price falls, the ratio’s denominator shrinks and the headline yield mechanically rises, even as the distribution and the value recede: a high trailing yield can be the footprint of a deep price drop.
- Only total return, which recombines the distributed flow and the change in share price, measures what the placement actually returned over the period.
- The rate cycle drives the two measures apart: a flattering yield can sit alongside a deeply negative total return in a tightening phase.
Last updated — 6 October 2026
Disclaimer – Financial and Legal Information: The analyses, commentary, and content published on eco3min.fr are provided for informational and educational purposes only. They do not constitute investment advice or a solicitation to buy or sell financial instruments. Past performance is not indicative of future results. All investment decisions involve risk and are the sole responsibility of the reader. Data, charts and calculated series are provided as is and may contain errors or lag behind their source: check any figure against the primary source cited before relying on it. Content describing laws, regulations or contracts reflects the law as of its publication date and does not constitute legal or tax advice; applying it to a specific situation requires a qualified legal or tax professional.
Read next
Full pillar →REITs and the rate cycle: how listed property reprices
One rate shock, two clocks: the listed market records it continuously (market value of US equity REIT shares,…
Target-Date Funds vs Self-Directed Portfolios: The Mechanics of a Delegated Glide Path
A target-date fund is sold as a simple, set-and-forget win. It is first something narrower: a delegated glide…
What Guaranteed Savings Products Have Paid: Fixed Annuity and Stable Value Yields Through the Rate Cycle
US guaranteed savings products credit a rate that trails the bond market rather than tracking it. Through the…