Residential Real Estate: Hidden Message in Mortgage Rates
Residential real estate adjustment now runs through credit and transaction volumes rather than headline prices. With mortgage rates anchored above the 2010s, the trade-offs for buyers and investors have been reshaped — without a sharp price drop.

Residential real estate: how the durable stabilization of rates in 2026, despite still-elevated prices, is reshaping the trade-offs for buyers and investors.
After the brutal rate shock of 2022-2023 and an adjustment phase through 2024-2025, the residential real estate market now operates in a more readable but more constraining regime: transaction volumes still below pre-2022 levels, headline prices broadly stable in nominal terms, and mortgage rates anchored at a level structurally higher than the 2010s.
The debate is no longer about a “rapid return to zero rates” but about the capacity of households and investors to absorb a durably higher cost of credit. The real question: positioning without assuming an automatic return to the pre-tightening regime.
Key takeaway: the adjustment continues primarily through credit and volumes, far more than through a sharp drop in headline prices.

TL;DR
After the 2022–2023 rate shock, residential real estate now adjusts mainly through credit and volumes, not through a sharp drop in headline prices. The complete history is documented in our US housing starts dataset (1959–2026).
- Euro-area mortgage rates have stabilized around 3.8–4.5% in early 2026 depending on country, far from the 1–2% of 2019, cutting borrowing capacity by roughly 20–30% versus the pre-2022 peak.
- Headline prices sit on a nominal plateau — cumulative adjustments of about 5–10% since mid-2023 in several major European cities, with limited forced selling.
- Affordability stays impaired: price-to-income ratios and debt-service burdens remain elevated, particularly for first-time buyers.
What matters today
To understand why the persistence of rates weighs more on volumes than on headline prices, the analysis must shift to credit. The same chain plays out in listed property: refinancing risk in listed property. The study of the credit cycle as a driver of property prices shows how the contraction and subsequent normalization of financing influence valuations with a lag, and why phases of stagnation can extend over several years.
This reading fits within the broader framework developed in the analysis of real estate cycles, rates and the real economy, which explains why residential property does not respond symmetrically to rate moves and why a durable tightening of credit can coexist with stable headline prices.
Detailed analysis
The 2026 consensus expects gradual normalization: moderate growth (≈1-1.5% across several European economies), inflation near 2-2.5%, and a progressive decline in policy rates. Even in this scenario, mortgage rates could remain durably above 3.5-4%.
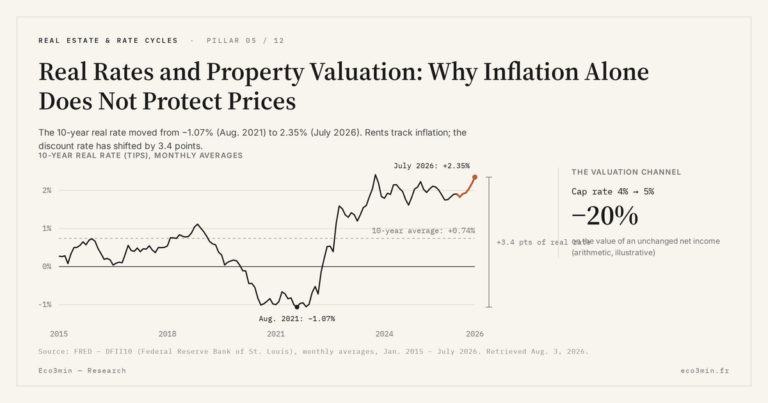
The major difference with the 2010s lies in real rates: long negative, they have turned slightly positive (≈0.5-1%). This single regime change mechanically reduces credit-supported solvent demand.
At the micro level:
- Many households locked in long fixed-rate mortgages at low levels between 2016 and 2021, limiting forced selling.
- Banks apply stricter origination criteria than before 2008.
- The adjustment runs primarily through lower transaction volumes and longer time-on-market.
Counter-argument: if disinflation became more pronounced through 2026-2027, with inflation durably below 2%, nominal rates could decline further, providing some breathing room for credit. Such a scenario would primarily benefit metropolitan areas with strong demographic dynamics.
Risks and observable patterns in the short term
- For owner-occupiers: empirically, households whose debt service consumes a large share of net income display higher financial vulnerability when shocks materialize (unemployment, refinancing windows). European prudential frameworks typically use debt-service-to-income ratios as a screening threshold, and higher down payments have historically reduced sensitivity to subsequent rate moves and price corrections by lowering loan-to-value at origination.
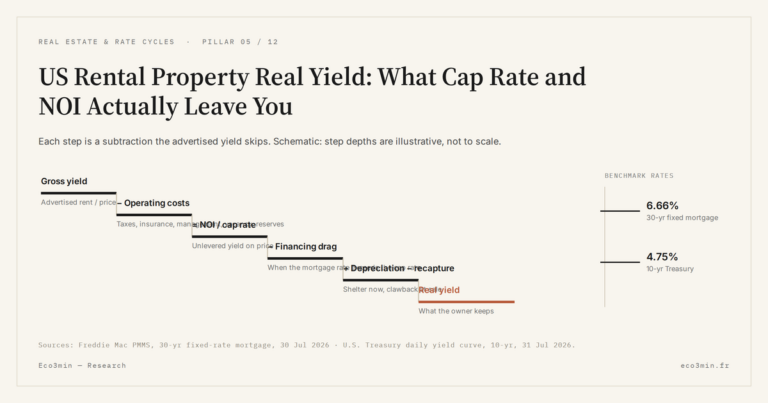
- For buy-to-let investors: with financing costs near 4%, the gross yield threshold observed in landlord screening has shifted upward, since lower yields no longer compensate the cost of credit and taxation. Below this break-even, comparable risk-adjusted returns are observable in diversified bond and ETF exposures, depending on jurisdiction.
- For multi-property owners: deleveraging on lower-yield or weaker-demographic assets has historically improved overall portfolio resilience during stagnation phases.
- Household balance sheets: in European wealth data, residential real estate has historically represented a substantial share of household net wealth, with financial assets and liquidity making up the remainder. The mix observed varies materially with age, income stability and rate regime — and the current cost of credit mechanically constrains the borrowing capacity that has historically supported residential exposure.
Weak signals to monitor
- Fixed rates on new mortgages: a durable move below 3.5% would signal meaningful easing; a hold above 4% would confirm the regime change.
- Price-to-median-income ratio: a return toward 7-8 years of gross income in major cities would mark a real rebalancing.
- Rental vacancy rate: a rise above 7-8% in a given area would signal pressure on rents.
- Share of cash transactions: a proportion durably above 30% would reflect increased market polarization.
- Regulatory shifts: rental taxation, rent caps, energy efficiency standards. An abrupt change can alter expected returns.
Likely medium-term scenarios
Scenario 1 — Controlled landing (central)
Moderate growth, inflation stabilized around 2%, gradual policy rate cuts. Mortgage rates drift toward 3.5-4% by 2027. Prices stagnate in nominal terms and correct slightly in real terms.
Scenario 2 — Rates durably elevated
Inflation around 2.5-3%, monetary caution. Mortgage rates ≈4-4.5%. Adjustment via prolonged price stagnation or real erosion over several years.
Scenario 3 — Demand shock
More pronounced slowdown, rising unemployment, localized forced selling. Targeted corrections of 10-20% in certain overvalued areas.
Priority indicator: quarterly transaction volumes. A gradual recovery in volumes without a price surge would signal a market on the path to normalization; a renewed contraction would point to prolonged blockage.
Common reading errors
- Equating price stability with absence of risk: nominal stagnation can mask a real correction via inflation.
- Looking only at the nominal rate: sustainability depends on the monthly payment, the maturity, and income stability.
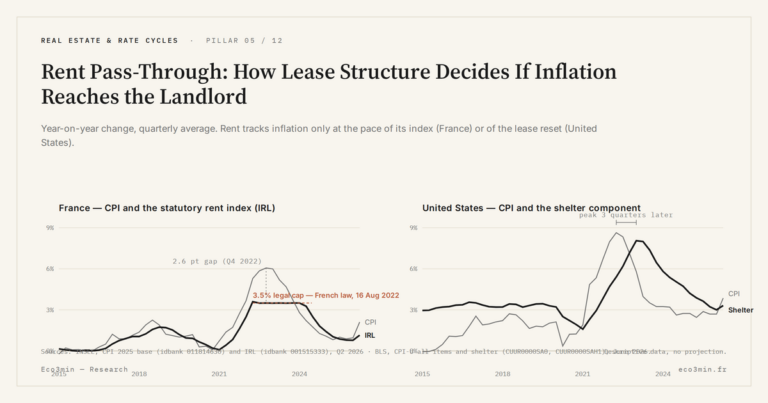
- Extrapolating rent growth indefinitely: an upward cycle can be followed by regulatory caps.
Frequently asked questions
- Is buying a primary residence in 2026 still relevant?
The pattern observed: outcomes are favourable when the monthly payment remains sustainable relative to net income and the holding horizon spans at least 8-10 years. The principal risk arises from excessive leverage at origination. - What gross yield is observed as a working baseline for buy-to-let?
With financing costs near 4%, the gross yield threshold cited in landlord screening has shifted upward; the exact level is jurisdiction-dependent and varies with local taxation and risk. - Does waiting for a crash hold up empirically?
Real estate adjustments are historically slow and heterogeneous. Strategies built around a single broad-based correction have often led to prolonged inaction. - How is exposure typically reduced when concentration is high?
Trimming lower-yielding assets, locking in fixed rates, and rebuilding liquid asset buffers have historically improved portfolio resilience.
In synthesis, residential property remains a structural component of household balance sheets, but the regime has changed: credit is no longer an automatic engine of valuation. The priority is no longer finding the perfect bottom but calibrating leverage, holding horizon, and cash-flow robustness in an environment of durably higher rates. Related material: our reference page on how credit and volumes drive property prices.
- 3 takeaways
- The shock is no longer the rate hike but the level holding high.
- The main risk is prolonged stagnation with low volumes rather than an immediate crash.
- Leverage and holding horizon matter more than the precise timing of entry.
Last updated — 12 July 2026
Disclaimer – Financial Information: The analyses, commentary, and content published on eco3min.fr are provided for informational and educational purposes only. They do not constitute investment advice or a solicitation to buy or sell financial instruments. Past performance is not indicative of future results. All investment decisions involve risk and are the sole responsibility of the reader.
Read next
Full pillar →US Rental Property Real Yield: What Cap Rate and NOI Actually Leave You
A rental listing leads with a yield. Divide the annual rent by the price and the number looks…
Cap Rate Spread: What Rental Yield Pays Over the 10-Year Treasury
A 5% cap rate sounds attractive. But 5% against what? A risk-free 10-year Treasury yields near 4.5% in…
Vacancy and Turnover: The Cost That Erodes a Landlord’s Real Return
A listing shows full rent, twelve months a year. The owner knows the gaps between tenants, the make-ready…