
Yield Curve Signals: What the 2026 Configuration Reveals
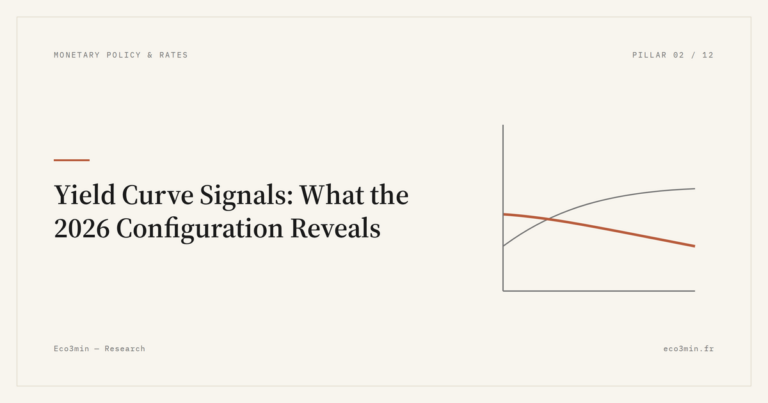
The US yield curve is dis-inverting but credit conditions remain tight heading into 2026. Mid-duration has reemerged as a central reference as markets reprice the cost of time.
This tag is dedicated to the analysis of the term structure of interest rates. Inversion, steepening, flattening: the shape of the yield curve signals expectations about growth, inflation and monetary policy. The yield curve is one of the leading indicators most closely watched by economists and investors.
The US yield curve is dis-inverting but credit conditions remain tight heading into 2026. Mid-duration has reemerged as a central reference as markets reprice the cost of time.
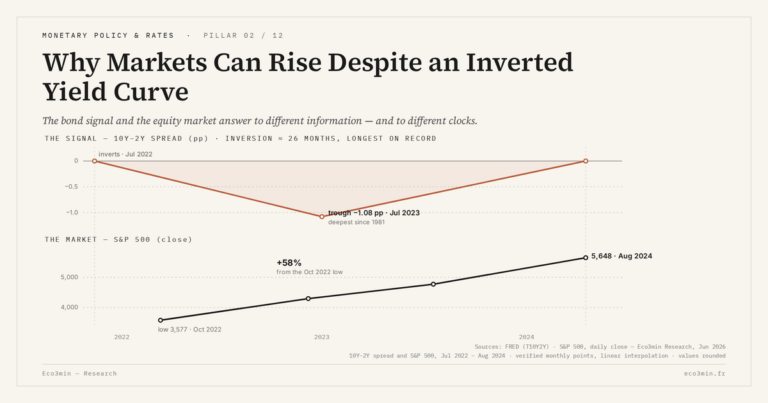
An inverted yield curve can coexist with rising markets without invalidating the signal. The lag reflects a structural disconnect between financial regime and economic regime, transmitted through credit before reaching asset prices.
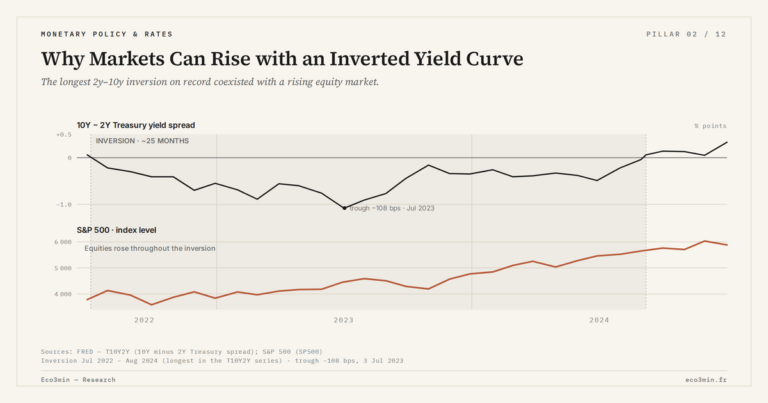
An inverted yield curve can coexist with resilient equity markets. The lag stems from balance sheet inertia, credit channel delays, and liquidity effects — not from a failed signal.

Long-term rates aggregate expectations of future short rates, inflation expectations and a term premium. They drive most monetary transmission to the real economy — far more than policy rates alone.
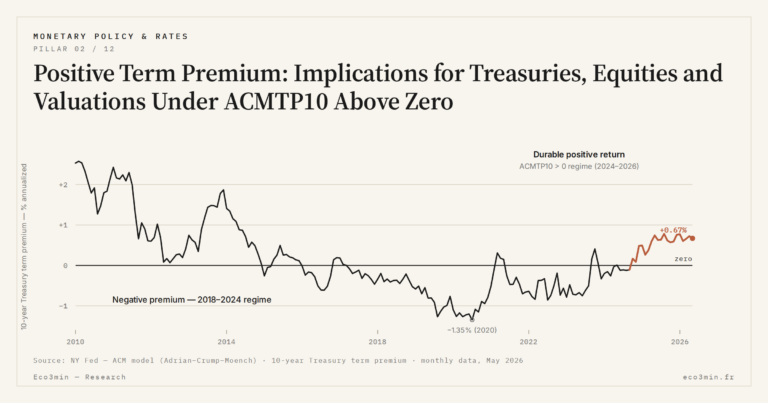
When the 10-year Treasury term premium is positive and durable, the asset-price architecture reconfigures: mechanical curve steepening, Equity Risk Premium recomposition, multiple compression for long-duration equity indices, and international transmission through portfolio flows. TL;DR A durable positive term premium steepens…
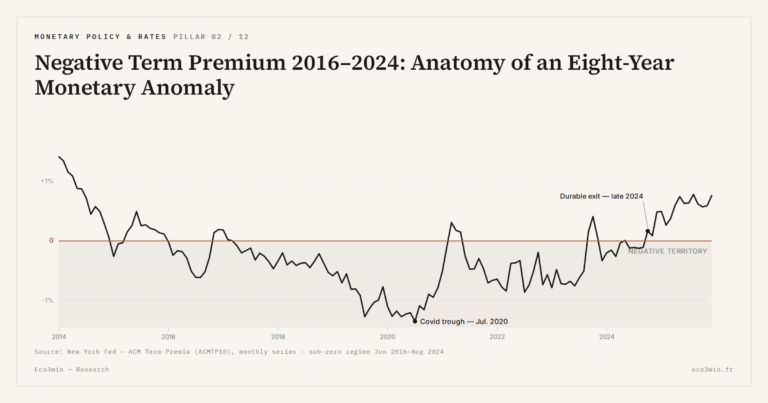
For eight consecutive years — from June 2016 to August 2024 — the 10-year Treasury term premium remained in negative territory, a configuration modern finance had theoretically ruled out and that the New York Fed nonetheless measured month after month…
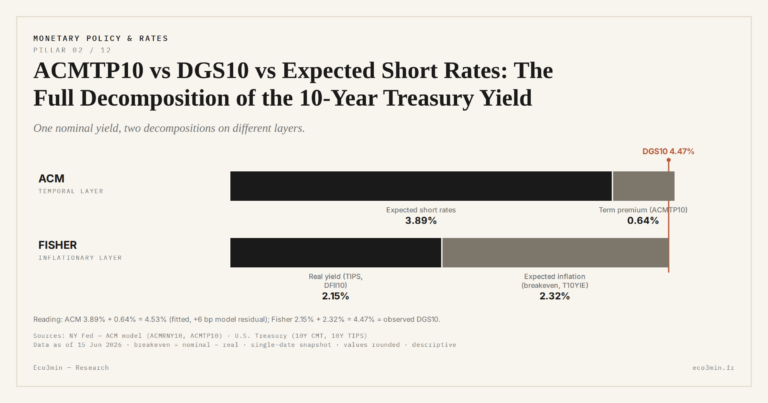
The nominal 10-year Treasury yield has not one decomposition but two, operating simultaneously on different layers — temporal for ACM, inflationary for Fisher — that intersect to form the reference grid of modern Treasury analysis. TL;DR Modern Treasury analysis splits…
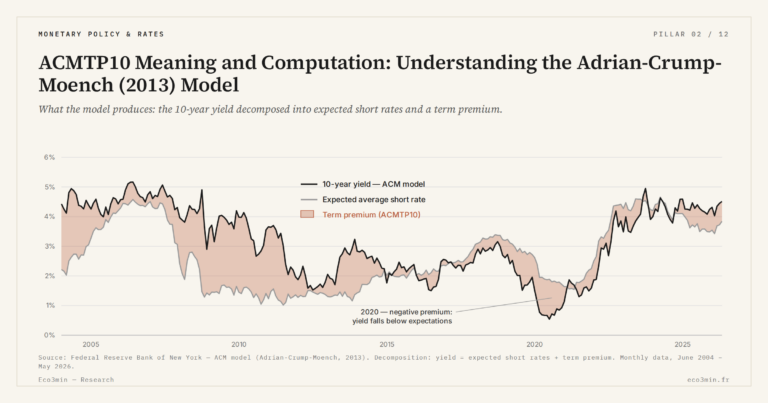
ACMTP10 is not an analyst opinion but the output of a five-factor regression published by the New York Fed in 2013, reproducible with standard statistical software and refreshed monthly on the ACM dashboard. TL;DR Built in 2013 for the FOMC's…
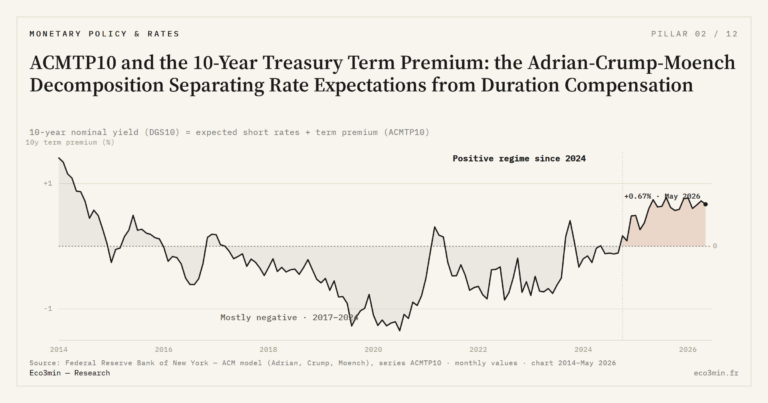
The nominal 10-year Treasury yield is not an opaque aggregate but the observable sum of two components the market prices separately, per the Adrian-Crump-Moench decomposition published by the New York Fed in 2013. TL;DR The same twenty-basis-point move in the…
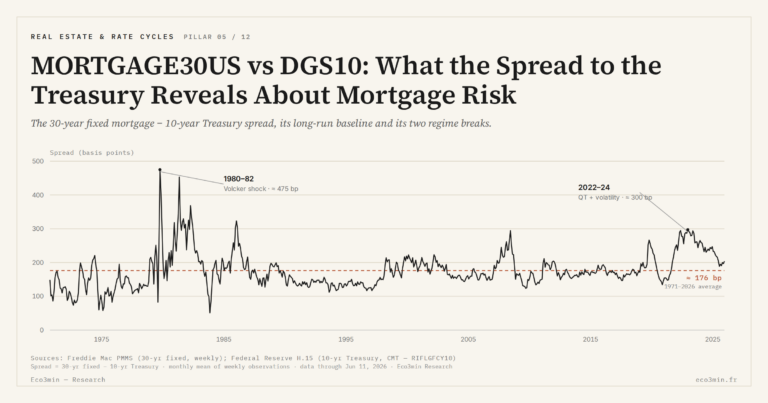
The MORTGAGE30US level says little without its distance to the 10-year Treasury. The spread, averaging around 170 basis points since 1971, breaks down into three premia — prepayment, rate volatility, MBS liquidity — making this gap the real diagnostic tool…