
Oil Shocks and US Recessions: The 4%-of-GDP Burden Threshold (1970–2026)
The consensus reaction to the 2026 oil price spike has followed a familiar script. Within days of the Strait of Hormuz crisis, mainstream outlets revived the James Hamilton canon (that ten of the eleven post-WWII US recessions were preceded by a major oil shock) and financial commentary converged on a single narrative: another recession is coming. The logic is intuitive. Oil shocks compress real incomes, feed into headline inflation, and force central banks to tighten.
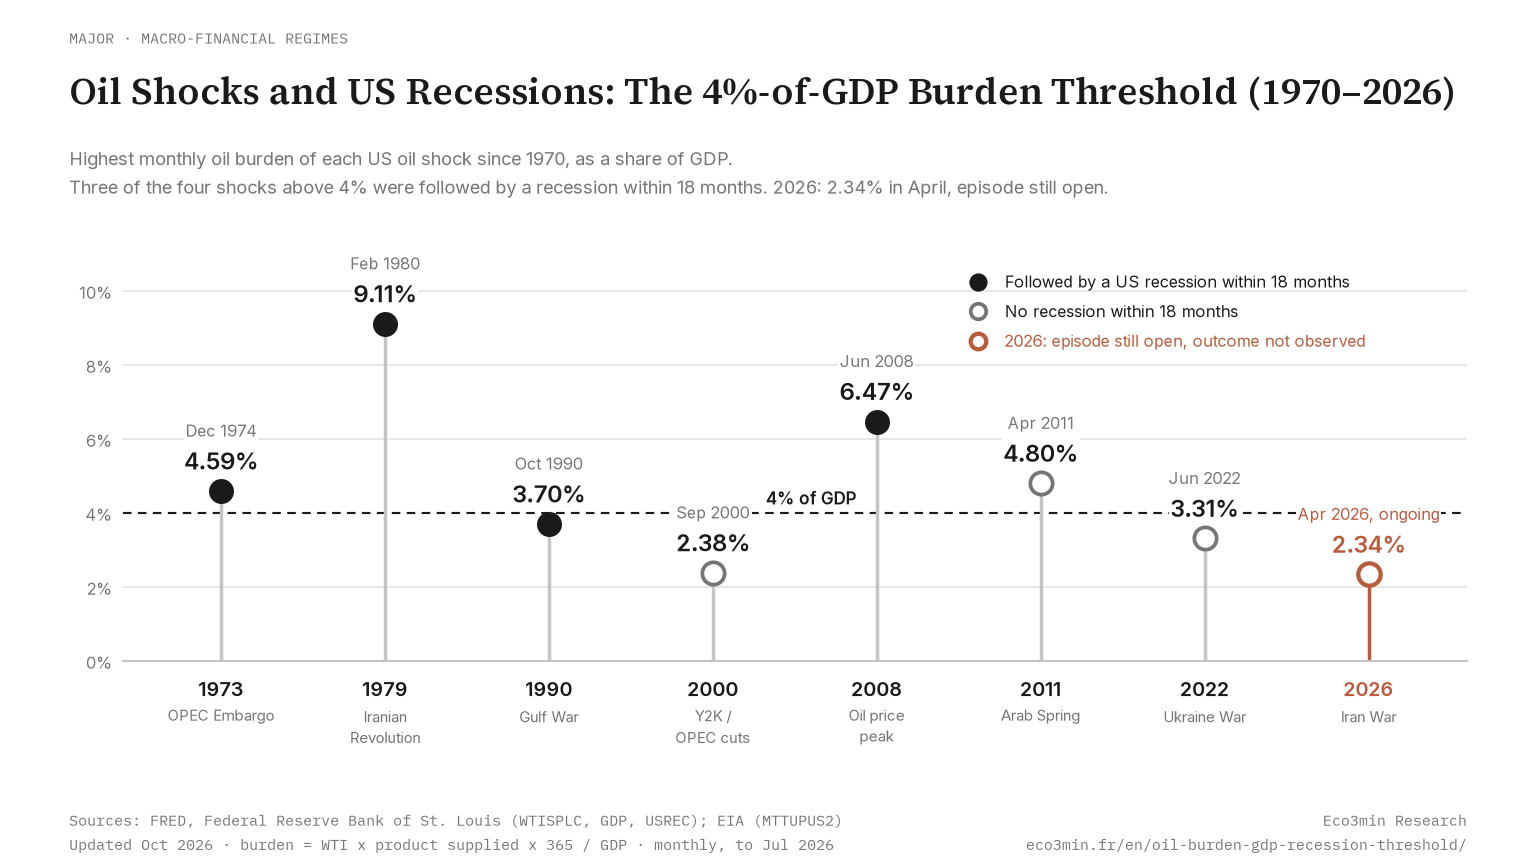
This analysis re-examines that script through a single metric: the oil burden, the share of US GDP spent on petroleum at prevailing prices. Over the 1970–2026 window, three of the four completed oil shocks whose burden peaked above approximately 4% of GDP were followed by a US recession within eighteen months; the exception is 2011. Below that line, one completed shock in three was (1990). The 2026 episode pushed the burden to 2.34% of GDP in April 2026, on the monthly average WTI price used for every episode, and to 2.67% even when valued at the highest daily spot price, $114.58 on 7 April 2026. The episode remains open, and any conclusion about its eventual outcome is conditional on the price path from here. What the data establish is narrower: the burden levels at which past oil shocks have produced US recessions are not, on data available in October 2026, present in this one.
Two structural shifts explain why a $100 barrel today is not the same shock a $100 barrel would have been in 1980: US petroleum intensity per real dollar of GDP fell by 69% between 1973 and 2025, and shale production and coordinated reserve releases have changed how fast supply can respond, although the 2026 episode, still open after eight months, shows that this does not guarantee a short shock. This page documents the underlying series, the episode-by-episode breakdown, and the methodology, including the sensitivity of the threshold rule to alternative classification choices, with the full dataset available for download.
Key Findings at a Glance
Period covered: January 1970 – September 2026 for prices, burden computable through July 2026 (FRED, EIA)
Major oil shocks identified: 8 (7 completed, 1 ongoing)
Completed shocks followed by a recession within 18 months (FRED USREC): 4 of 7
Empirical recession threshold: ~4% of US GDP (peak oil burden)
Completed shocks above threshold: 4 episodes, 3 recessions (1973, 1979, 2008; the exception is 2011 at 4.80%)
Completed shocks below threshold: 3 episodes, 1 recession (1990 at 3.70%; none after 2000 or 2022)
Heaviest burden on record: 9.11% of GDP (February 1980, Iranian Revolution)
2026 Iran War (ongoing): burden peak to date 2.34% of GDP (April 2026, monthly average WTI $100.32); 2.67% at the highest daily spot price ($114.58, 7 April 2026)
Return to the pre-shock price band: from 184 days (1990) to 2,588 days (1979); never for 1973 and 2000, not yet for 2026
US petroleum intensity of real GDP: −69% from 1973 to 2025 (from 2.83 to 0.87 thousand barrels per day per billion dollars of real GDP, in chained 2017 dollars)
The 2011 Arab Spring episode peaked at 4.80% of GDP, technically above the threshold, but was not followed by a recession in the FRED USREC series (Federal Reserve Bank of St. Louis). It is the single partial false positive in the modern series. See Counter-Arguments and Limitations and Methodology: Sensitivity to Classification.
Every Major US Oil Shock Since 1970: Burden, Duration, and Outcome
The table below lists every sustained oil price shock since January 1970, dated from the start of each price run-up (see Methodology for the 30%-above-trend check). For each episode, we report the price peak (highest monthly average WTI), the peak oil burden (highest monthly annualized US petroleum spend as a share of nominal GDP, which can fall in a different month), the duration (days from onset to the first month whose average WTI is back at or below 110% of the pre-shock 12-month average), and whether a recession began within 18 months of shock onset, according to the FRED USREC series (Federal Reserve Bank of St. Louis).
| Episode | Price peak | Peak WTI (nominal) | Peak WTI (2024 real) | Peak burden (% GDP) | Duration (days) | Recession ≤ 18m ⁴ |
|---|---|---|---|---|---|---|
| 1973 OPEC Embargo | Oct 1974 | $11.16 | $68.64 | 4.59% (Dec 1974) | no return ⁵ | ✓ Yes |
| 1979 Iranian Revolution | Apr 1980 | $39.50 | $153.16 | 9.11% (Feb 1980) | 2,588 | ✓ Yes |
| 1990 Gulf War | Oct 1990 | $35.92 | $84.47 | 3.70% | 184 | ✓ Yes |
| 2000 Y2K / OPEC cuts | Nov 2000 | $34.40 | $61.95 | 2.38% (Sep 2000) | no return ⁵ | ✗ No |
| 2008 Peak | Jun 2008 | $133.93 | $193.20 | 6.47% | 670 | ✓ Yes |
| 2011 Arab Spring | Apr 2011 | $110.04 | $154.04 | 4.80% | 578 | ✗ No ¹ |
| 2022 Ukraine War | Jun 2022 | $114.84 | $122.14 | 3.31% | 1,216 | ✗ No |
| 2026 Iran War | May 2026 ² | $102.13 ² | $95.93 | 2.34% (Apr 2026) | 241, open ³ | (ongoing) |
¹ 2011 is the only post-1970 episode where the burden briefly crossed 4% without a subsequent recession in USREC: a partial false positive. See Counter-Arguments and Limitations below.
² Monthly averages, as for every other row (FRED WTISPLC). The highest daily spot price was $114.58 on 7 April 2026 (FRED DCOILWTICO): valued at that price, with April consumption and second-quarter GDP, the burden would reach 2.67%. Versions of this page published before October 2026 used an intraday high of $117.63 against February consumption and an extrapolated GDP.
³ Episode still open: since March 2026, no monthly average WTI has come back to 110% of the pre-shock average ($64.15, i.e. $70.57). The daily spot price dipped just below that level in late June and early July 2026 (FRED DCOILWTICO) before the monthly average rose to $97.31 in September. Days counted from 1 February to 30 September 2026. For the full chronology, see every US recession since 1948.
⁴ The “recession ≤ 18m” flag uses shock onset as the start of the 18-month window, following the convention in Hamilton (2003). Under a peak-based clock, the 2000 episode would reclassify (the 2001 recession, whose peak month in the USREC series is March 2001, began approximately 4 months after the November 2000 price peak). See Methodology: Sensitivity to Classification. For further reading, see the 2026 trade-offs after the end of cheap money.
⁵ The monthly average WTI never came back to 110% of its pre-shock average: the 1973-74 shock and the 1999-2000 rebound from the 1998 low reset the price level for good. Versions published before October 2026 showed 488, 1,065 and 610 days for 1973, 1979 and 2000, which the duration rule does not reproduce.
Sources: Federal Reserve Bank of St. Louis (FRED series WTISPLC, CPIAUCSL, GDP, USREC, DCOILWTICO); U.S. Energy Information Administration, series MTTUPUS2 (U.S. product supplied of crude oil and petroleum products). Recession series: Federal Reserve Bank of St. Louis, NBER based Recession Indicators for the United States from the Period following the Peak through the Trough [USREC], retrieved from FRED, Federal Reserve Bank of St. Louis; https://fred.stlouisfed.org/series/USREC. Dataset rebuilt from these series on 30 October 2026.
What the Data Show: Three Structural Findings
1. Above 4% of GDP, three oil shocks in four were followed by a recession
Across the seven completed shocks documented above, the peak oil burden separates outcomes around 4% of US GDP, but imperfectly. Three of the four episodes that crossed that line (1973, 1979, 2008) were followed by recessions within eighteen months in the FRED USREC series; the fourth, the 2011 Arab Spring episode, peaked at 4.80% without a downturn. Below the line, 2000 and 2022 produced no recession, while 1990 did at 3.70%: in the USREC series that business-cycle peak falls in July 1990, the month before Iraq invaded Kuwait, so the oil shock and the contraction cannot be separated. The 2026 episode, whose burden peaked at 2.34% in April 2026, sits well below the line, though the episode remains open.
The pattern matters because the threshold is expressed as a share of GDP, not as a dollar price. A $100 barrel, in 2024 dollars, represented three very different shocks to the US economy: at each month’s consumption and GDP, it would have absorbed about 5.6% of GDP in April 1980, 3.3% in June 2008 and 2.5% in April 2026. What the 4%-of-GDP rule captures is the fraction of national income that is redirected toward petroleum, and historically, once that fraction exceeds roughly one twenty-fifth of GDP, the real-economy pass-through becomes large enough to trigger a broader contraction. It is worth flagging that the 2008 peak was endogenous to the financial conditions unraveling in the second half of that year (Kilian, 2009): part of the price action reflected, rather than purely caused, the recessionary dynamic. The threshold is therefore best read as a marker of elevated risk, not a deterministic trigger. The burden itself multiplies a price by a volume, daily US oil consumption, before dividing by GDP.
2. US oil intensity has fallen by more than two-thirds since 1973
The denominator of the burden ratio has changed as dramatically as the numerator. In 1973, US petroleum products supplied averaged 17.3 million barrels per day (EIA). Real GDP stood at $6.1 trillion in chained 2017 dollars (BEA), which puts intensity at 2.83 thousand barrels per day per billion dollars of output. In 2025, consumption averaged 20.7 million barrels per day and real GDP reached $23.9 trillion. Intensity fell to 0.87. Real output grew 3.9-fold over those fifty-two years, while consumption rose 20%. The petroleum intensity of US real GDP therefore fell by 69%, an Eco3min calculation on these two annual series. Each barrel now supports about 3.3 times as much real output as in 1973. This is the single most important structural reason the same nominal oil price is a smaller shock today. For context: The joint reading of monetary metal and energy.
The mechanisms behind this decline are well-documented: the shift from manufacturing to services, the tripling of vehicle fuel economy standards since the 1970s, the electrification of rail and industrial heat, the substitution of natural gas for fuel oil in power generation, and, more recently, the emergence of electric vehicles as a meaningful share of new sales. None of these trends reverse quickly. The 2026 economy is not the 1973 economy running the same oil-shock transmission mechanism at higher prices; it is a structurally different economy. Structurally different, and running under a different macro-financial regime altogether, on the far side of the arc that runs from the Great Moderation to the structural break.
3. Shock duration has not compressed: the 2026 episode is still open
The duration column does not show the compression that earlier versions of this page described. Counted until the monthly average WTI is back at or below 110% of its pre-shock 12-month average, the 1990 Gulf War shock lasted 184 days, the 2011 episode 578 days, 2008 670 days and the 2022 Ukraine episode 1,216 days; the 1979 shock took 2,588 days, and the 1973 and 2000 shocks never came back to that band. The 2026 Iran War episode has not come back either: after a dip in June and July, the monthly average rose again to $97.31 in September 2026, about 52% above its pre-shock average of $64.15. Shale production, which responds within months rather than years, and coordinated Strategic Petroleum Reserve releases, used at scale in 2022, are the mechanisms usually cited for shorter disruptions; the episodes in the table do not yet show them shortening oil shocks. Worth reading alongside: Market Volatility in 2026: A New Regime for Stocks, Bonds, and Crypto.
A shock whose price-elevated duration is measured in months rather than years transmits less to the real economy even at the same peak price, because the capital-spending and consumption-adjustment channels work on multi-quarter horizons. A short-duration spike in headline CPI does not, by itself, reset inflation expectations or credit conditions the way a multi-year plateau would.
Why a Burden Threshold Exists: The Transmission Mechanism
The existence of a ~4% burden threshold is not a coincidence of the data. It corresponds to the point at which three transmission channels compound into a recessionary dynamic, as documented in the literature on oil and macroeconomic activity from James Hamilton’s work at UC San Diego through to Lutz Kilian’s structural VAR decompositions (notably Kilian and Vigfusson, 2011).
The first channel is real income compression. An oil price spike is effectively a tax paid by US consumers and businesses to petroleum producers, some of whom are foreign. That tax can be sized for one’s own consumption in the fuel burden calculator, income share included. When the tax rises from, say, 2.5% to 6% of GDP, the income loss to non-oil sectors becomes large enough to force material cuts in discretionary spending. On the same topic: where French pump-price money actually goes. At 2% of GDP, the same mechanism operates but the amplitude is small enough to be absorbed by buffer stocks of savings and corporate margins. On the downstream side, how refining margins shape oil-sector profits.
The second channel is monetary policy response. Oil shocks feed headline inflation directly and core inflation indirectly through transportation and petrochemical input costs. Central banks historically respond to the resulting inflation impulse with tighter policy, even when they recognize the shock’s supply-side origin. The same dynamic, traced through the WTI price specifically, is set out in the WTI oil-burden transmission mechanism. The degree of tightening scales with the magnitude and persistence of the shock. Below roughly 4% of GDP, the inflation pass-through is modest enough that a determined central bank can “look through” the impulse; above it, the political and mandate pressures typically force a tightening that compounds the real-income effect.
The third channel is uncertainty and capital allocation. Large, sustained oil shocks raise implied volatility across energy-sensitive sectors (transportation, chemicals, heavy industry, airlines) and induce capital-spending deferrals. The 2008 cycle and the 1979–1981 cycle are particularly clear examples of this. A spike of a few weeks, by contrast, is too short to trigger meaningful capex re-sequencing; firms treat it as a timing issue rather than a regime change. At eight months, the 2026 episode is past that point, even though its burden has stayed below 2.4% of GDP.
When any one of these channels operates in isolation, the effect is manageable. It is their compounding, observed mainly above roughly 4% of GDP in the modern series, that produces recessions.
Why the 2026 Shock Is, So Far, Below the Historical Threshold
The 2026 Iran War episode combines three properties that, on data available in October 2026, keep it below the historical recessionary-shock band, and one that does not. The peak price, a monthly average of $102.13 in May 2026 ($95.93 in 2024 dollars), sits at the 79th percentile of real-terms WTI since 1986, well below the $193 real-terms peak of June 2008 and the $153 of April 1980; the highest daily spot price, $114.58 on 7 April 2026, does not change that ranking. The consumption denominator, 20.8 million barrels per day in April 2026 (EIA), is only about 6% above June 2008 (19.7 million), but the GDP denominator has grown from $14.9 trillion in the second quarter of 2008 to $32.6 trillion in the second quarter of 2026 (BEA), which by itself divides the ratio by 2.2. At those levels, the 4% line corresponds to a monthly average WTI of about $170 a barrel. The duration is the property that does not help: eight months after onset, the monthly average price has not returned to its pre-shock band.
This is not a claim that the 2026 shock is economically costless. The temporary inflation impulse is real, consumer sentiment has registered the gasoline price move, and certain energy-intensive sectors have absorbed margin compression. Nor is it a forecast that the episode will remain sub-threshold: a monthly average WTI approaching $175, at July 2026 consumption and third-quarter 2026 GDP, would bring the burden into the historical recessionary band, at which point this analysis would require revision. The narrower claim is that the mechanical conditions under which past US oil shocks have produced US recessions are not, on data available in October 2026, present in this one, and that the consensus invocation of the Hamilton rule conflates a nominal price level with a macro-relevant shock. A related read: China Geopolitical Risk: The Hidden Tipping Point.
Reading the Burden From the Recession Side
Counting from recessions rather than from shocks gives a less tidy picture. On the Eco3min monthly series (WTI, EIA petroleum products supplied, BEA nominal GDP), the burden exceeded 4% of GDP in the twelve months before three of the seven US recessions since 1973: 1980 (8.2% in December 1979), 1981–1982, and 2007–2009 (4.8% in November 2007). It stayed below 2.6% before the other four, which began in November 1973, July 1990, March 2001 and February 2020. The 2020 downturn had no oil cause at all. Read this way, the threshold flags one type of recession, the oil-driven kind; a low burden does not rule out a contraction produced by monetary tightening, a financial imbalance or an external shock.
Household budgets carry most of the real-income channel described above. Per the BEA, energy goods and services took 6.4% of US household consumption in 1970, peaked at 9.2% in 1981, fell to 4.4% in 1998, rose to 6.1% in 2008 and 4.7% in 2022, and came back to 3.7% in 2025. In 1980, with the burden above 8% of GDP, energy absorbed 7.8% of household disposable income, against 3.3% in 2025. When that share climbs, households cut restaurants, leisure and durable goods first, the most cyclical components of GDP. Inflation expectations act as a second filter: the 1973–74 and 1979–80 shocks produced double-digit inflation because expectations were not yet anchored by a credible monetary policy, whereas the 2011 episode, above 4%, brought neither double-digit inflation nor a recession.
One change is specific to the shale era. The United States became a net exporter of crude oil and petroleum products in late 2019 in monthly data, and on an annual basis in 2020. When WTI rises, part of the wealth transfer now flows to US producers instead of abroad, and the terms-of-trade loss that still hits Europe, Japan and India is largely neutralized at the national level. It persists regionally: producing states such as Texas, North Dakota and New Mexico gain at the expense of net-importing regions on the East and West Coasts and in the non-producing Midwest. On crude oil alone, the country still imports more than it exports, so the net surplus comes from refined products. The household channel stays fully active, which is why the same burden now carries a different distributional pattern in the US than it did before 2020.
Counter-Arguments and Limitations
The case against the conclusion presented here is worth stating plainly. Four objections deserve serious consideration.
First, the burden metric measures cost, not transmission speed. A short, sharp shock could still damage financial conditions via credit spreads, equity volatility, and dollar dynamics even if the cumulative income loss is modest. The 2022 episode, despite staying sub-threshold, coincided with the sharpest bond drawdown on record; a similar coincidence of oil and credit stress in 2026, even briefly, could produce outcomes not captured by the burden-threshold rule.
Second, the threshold is an empirical regularity, not a structural law. With only eight modern episodes, the 4%-of-GDP line is drawn from a small sample. The 2011 Arab Spring episode, which breached the threshold without triggering a recession, hints that post-2008 monetary policy regimes may have shifted the transmission mechanics. The rule has already failed in both directions: 2011 was absorbed above the line, and 1990 produced a recession below it.
Third, the 2026 episode is not yet closed. Eight months after onset, the monthly average WTI ($97.31 in September 2026) remains about 52% above its pre-shock average. The burden is computable through July 2026, the last month of EIA consumption data at this update: 1.83% of GDP, with July’s monthly average WTI at $80.46, the lowest since February 2026. At current consumption and GDP, the burden would reach 4% with a monthly average WTI of about $175 a barrel, at which point the analysis on this page would require revision. The dataset and methodology are designed to be updated monthly as new observations arrive.
Fourth, the statistical confidence around the threshold is wide. A more formal classification approach (for example, a logistic regression jointly weighting peak burden and duration) would produce a smoother decision boundary than the single 4%-of-GDP line drawn here. With only seven completed episodes, however, such a model is too unstable to dominate the dominant-axis intuition: the implied boundary shifts substantially when any single observation is excluded. The threshold framework presented here trades statistical sophistication for transparency, and is best interpreted as a necessary-but-not-sufficient empirical regularity rather than a calibrated probability model.
A disciplined reading of the evidence, therefore, is that the 2026 shock as currently observed does not meet the historical conditions for a recessionary oil shock. It does not rule out one, and it does not imply that current macroeconomic conditions are benign for reasons unrelated to oil. The full account is given in our study on economic cycle phases and market implications.
Common Misinterpretations
Citing the “ten of eleven recessions” rule without adjusting for magnitude. The Hamilton observation is correct but describes a selection of shocks that were mostly above the burden threshold by construction. Applying the rule to the 2026 episode treats the presence of a price spike as the relevant variable rather than its scale. The threshold analysis presented here is a refinement, not a contradiction, of Hamilton’s framework.
Equating nominal price levels across decades. Commentary that compares the 2026 peak of ~$102 (May 2026 monthly average) directly to the 1980 peak of ~$40 or the 2008 peak of ~$134 confuses dollars-of-the-day with shock magnitude. The relevant comparison is the share of national income the economy redirects toward petroleum at each price, and that comparison places 2026 closer to 2000 than to 1979.
Ignoring duration. A $120 barrel held for two years and a $120 barrel held for six weeks are not the same macroeconomic event. The 2022 Ukraine shock lasted 40+ months and did not produce a recession precisely because the burden-weighted duration never reached the historical compound threshold. The 2026 episode, eight months old, has a burden that peaked at 2.34% of GDP: on the same reasoning, its duration is now the variable to monitor, against a burden still far below the 1979-80 and 2008 levels.
Over-reading single-sector indicators. Energy equity performance, gasoline retail prices, and Brent-WTI spreads all responded sharply to the 2026 shock. These are valid signals of stress in the affected sectors but do not, individually or collectively, substitute for the aggregate burden measure when the question is whether the overall economy is at recessionary risk from oil.
Methodology and Sources
Primary metric: Oil burden as a share of GDP, defined as
Burden_t = (WTI_t × PetroleumConsumption_t × 365) / NominalGDP_t
where WTI is the monthly average nominal WTI spot price (USD/barrel), PetroleumConsumption is US petroleum products supplied (thousand barrels per day, converted to annual barrels), and NominalGDP is the seasonally-adjusted annualized rate for the corresponding quarter. The burden is expressed in percent.
Price series: WTI Spot Price, monthly average, FRED series WTISPLC. Available from January 1946.
Consumption series: U.S. product supplied of crude oil and petroleum products, monthly, thousand barrels per day, EIA series MTTUPUS2. Available through July 2026 at this update.
GDP series: US Nominal GDP (SAAR), quarterly, FRED series GDP. Forward-filled to monthly within each quarter. Months whose quarter the BEA has not yet published carry no burden value; nothing is extrapolated. Third quarter of 2026: BEA advance estimate of 29 October 2026.
Inflation adjustment: CPI-U (all urban consumers, seasonally adjusted), FRED series CPIAUCSL. Used for the “2024 real” conversion of peak WTI prices, rebased to the 2024 annual average.
Recession dates: FRED USREC series (Federal Reserve Bank of St. Louis), monthly. The “recession within 18 months” flag of the episode table is true if USREC equals 1 in any month within 18 months of shock onset. In the monthly dataset, recession_usrec_peak_incl equals 1 from the peak month through the trough month inclusive, the peak being the month before USREC first equals 1. The recession_next_18m column equals 1 when USREC equals 1 in at least one month from the current month through the eighteenth month after it.
Shock episode definition: Onset is dated to the start of the price run-up. In seven of the eight episodes, monthly WTI then stood at least 30% above its trailing 36-month average for two consecutive months or more; the 2011 episode crossed that line in April 2011 only. The final episode list has been cross-checked against the canonical oil-shock taxonomy in the academic literature (Hamilton, 2003; Kilian and Vigfusson, 2011).
Duration definition: Days from episode onset to the first month, after the price peak, whose average WTI is back at or below 110% of the pre-shock 12-month average. The 1973 and 2000 episodes never returned to that band; the 2026 episode, still open, is counted to 30 September 2026. The peak burden is the highest monthly burden of the episode and the price peak its highest monthly average WTI; the two fall in different months in 1973, 1979, 2000 and 2026.
Limitations: (1) WTI is used as a price proxy; US refiner acquisition costs differ slightly. (2) The burden measure captures direct petroleum expenditure but not second-round effects via plastics, chemicals, and other petroleum derivatives. (3) The threshold is estimated from seven completed observations; statistical uncertainty around the ~4% line is substantial. (4) The framework applies to the US economy specifically; oil-importing economies with higher petroleum intensity (e.g., India, Japan) may exhibit different thresholds.
Sensitivity to classification. The “recession within 18 months” flag is computed from shock onset, following the convention used in Hamilton (2003) and most subsequent oil-shock literature. An onset-based clock reflects the period during which transmission channels are compounding into the real economy, and is the academically standard convention. Under a stricter peak-based clock, however, one episode would reclassify: the 2000 Y2K/OPEC episode peaked in November 2000, and the 2001 recession began in March 2001, its peak month in the USREC series, approximately four months after the price peak, well within an 18-month peak-based window. Under that alternative specification, the 2000 episode shifts from “no recession” to “recession”, reducing the count of clean below-threshold non-recessions from two (2000, 2022) to one (2022 only).
The economic literature attributes the 2001 recession primarily to the dot-com bust rather than to the 2000 oil price move (Hamilton 2003 explicitly treats 2001 as non-oil-driven), which is the substantive justification for the onset-based convention adopted here. Under either specification, three of the four above-threshold completed shocks were followed by a recession, 2011 being the exception; below the threshold, the count is one in three under the onset clock (1990) and two in three under the peak clock (1990 and 2000), so the weight of the 2000 case depends on the convention retained.
Academic references:
- Hamilton, J. (2003). “What Is an Oil Shock?” Journal of Econometrics, Vol. 113, No. 2.
- Kilian, L. (2009). “Not All Oil Price Shocks Are Alike: Disentangling Demand and Supply Shocks in the Crude Oil Market.” American Economic Review, Vol. 99, No. 3.
- Kilian, L. and Vigfusson, R. (2011). “Are the Responses of the U.S. Economy Asymmetric in Energy Price Increases and Decreases?” Quantitative Economics, Vol. 2, No. 3.
- Blinder, A. and Rudd, J. (2008). “The Supply-Shock Explanation of the Great Stagflation Revisited.” NBER Working Paper No. 14563.
- Bernanke, B., Gertler, M., and Watson, M. (1997). “Systematic Monetary Policy and the Effects of Oil Price Shocks.” Brookings Papers on Economic Activity, Vol. 1997, No. 1.
Frequently Asked Questions
What is the oil burden, and why use it instead of the oil price?
The oil burden is the share of national income a country spends on petroleum at prevailing prices. It is the product of the price, the physical quantity consumed, and the inverse of GDP. Using this ratio rather than the nominal price controls for the two things that have changed most in the US economy over the past fifty years: the size of GDP grew roughly 22-fold in nominal terms between 1973 and 2025, and the petroleum intensity of US real GDP fell by more than two-thirds over the same period. A $100 barrel in 2026 is, measured as a share of national income, a much smaller shock than the same nominal price would have been in 1980. In depth: the US–China semiconductor war.
Does the 4%-of-GDP threshold always predict a recession?
Over the modern data (1970–2026), every completed episode that crossed 4% was followed by a recession within 18 months from shock onset, with one partial exception: the 2011 Arab Spring spike reached 4.80% without an ensuing recession. The reverse does not hold either: the 1990 shock peaked at 3.70% and was followed by a recession whose peak, in the USREC series, falls in July 1990, the month before Iraq invaded Kuwait. The threshold is best understood as an empirical regularity with a credible transmission-mechanism explanation rather than as a deterministic rule. With only seven completed episodes of identification, the confidence interval around the 4% line is wide. The classification of the 2000 episode is also sensitive to the choice of timing convention, see Methodology, Sensitivity to Classification.
Why hasn’t the 2022 Ukraine War shock caused a US recession?
The 2022 episode was the longest in the series, approximately 40 months from onset to return near baseline, but the peak burden reached only 3.31% of GDP. Two structural factors compressed it: US petroleum consumption had declined slightly from pre-pandemic levels, and nominal GDP had grown rapidly during the post-Covid fiscal expansion. The shock was persistent but shallow on the burden measure, and US recession has not followed.
Could the 2026 shock still produce a recession later?
Yes. The thesis presented here is conditional on the shock profile observed through September 2026. At current consumption and GDP, a monthly average WTI of about $175 a barrel would bring the burden to the historical threshold, at which point the analysis on this page would require revision. A shorter-duration but financial-market-stress-amplified shock could also produce a recession through a credit-conditions channel that the burden metric does not directly capture (see Counter-Arguments and Limitations, first objection). The page will be updated monthly as new data arrives.
How does this relate to the Hamilton “ten of eleven recessions” rule?
Hamilton’s well-known observation identifies major oil shocks preceding most post-WWII US recessions. It does not specify a magnitude condition: it treats the presence of a shock as binary. The burden framework presented here is a refinement: it distinguishes major-enough shocks (those that cross the 4%-of-GDP threshold) from notable but sub-threshold episodes. Under this refinement, Hamilton’s observation holds for three of the four above-threshold episodes (2011 is the exception), while among the below-threshold episodes only 1990, whose recession starts from a July 1990 peak in the USREC series, was followed by one; 2000, 2022 and, so far, 2026 sit outside it.
Isn’t it too early to draw any conclusion while the 2026 shock is still open?
The strongest objection to the analysis presented here is that the 2026 episode is incomplete. On data through September 2026, the monthly average WTI peaked at $102.13 in May, eased to $80.46 in July and rose again to $97.31 in September, without returning to its pre-shock band. The conclusion drawn on this page is therefore narrower than “no recession will follow”: it is that, on data available in October 2026, the burden profile does not match the historical recessionary template. If the price re-accelerates and stays elevated, the burden metric will rise, the duration figure will extend, and the classification will revisit. The framework is built to be updated, not to lock in a forecast.
What would change the threshold over time?
Anything that altered the transmission mechanisms discussed above. A meaningful reversal of US petroleum intensity (for instance, a prolonged pause in electrification), a persistent weakening of monetary policy’s willingness to accommodate supply shocks, or a regime change in household and corporate balance sheets that reduced absorption capacity, could all shift the threshold. The data presented here describe the 1970–2026 structure; they do not predict it will hold indefinitely.
Download the Complete Dataset
Two CSVs: the full monthly time series (January 1970 to September 2026, 681 observations) and the episode summary (8 shocks).
Timeseries CSV (monthly) Episodes CSV (summary)
Source: eco3min.fr, FRED / EIA data. Data terms: the FRED series marked “citation required” (WTISPLC, and USREC for the recession columns) remain under their producers’ and FRED’s terms (cite both); the other columns come from US public-domain sources (EIA, BEA, BLS). Eco3min grants no licence over this data; Eco3min text and analysis: CC BY 4.0.
Conclusion
The 2026 oil price spike is a real event with real costs. It has compressed margins in energy-intensive sectors, contributed to a temporary inflation impulse, and surfaced the fragility of global supply chains dependent on the Strait of Hormuz. What it has not done, on the evidence assembled here through September 2026, is meet the historical conditions under which US oil shocks have translated into US recessions. Recession or not, reliance on a single maritime chokepoint is a geopolitical exposure before it is an energy statistic, and it belongs to the channels through which geopolitics reshapes markets and economic regimes.
The 4%-of-GDP burden threshold sorts the modern record imperfectly: three recessions after four completed shocks above it (2011 being the exception), one after three below it (1990). The 2026 peak to date, 2.34% of GDP in April 2026, sits level with the 2000 OPEC-cuts episode (2.38%) and below the 2022 Ukraine War (3.31%). The combination of a decline of more than two-thirds in US oil intensity (in real terms) since 1973 and nominal GDP more than doubling since 2008 places this shock, so far, outside the recessionary-oil-shock reference class on the burden measure; its duration, eight months and counting, is the dimension still unsettled. Eco3min’s analysis of the 1973 oil embargo traces this episode.
This does not mean US recession risk is zero, nor that oil has ceased to matter for macroeconomic dynamics. It means that applying a 1970s mental model to a 2020s economy produces forecasts calibrated to a transmission mechanism that has materially weakened, and that the consensus invocation of the Hamilton rule conflates a nominal price level with a macro-relevant shock. The threshold framework, and the underlying burden metric, are offered here as the most defensible operational way to distinguish the shocks that have historically mattered from those that have not, with the explicit caveat that the 2026 observation is preliminary and the page will be revised monthly as new data arrives.
Last updated — 30 October 2026
Disclaimer – Financial and Legal Information: The analyses, commentary, and content published on eco3min.fr are provided for informational and educational purposes only. They do not constitute investment advice or a solicitation to buy or sell financial instruments. Past performance is not indicative of future results. All investment decisions involve risk and are the sole responsibility of the reader. Data, charts and calculated series are provided as is and may contain errors or lag behind their source: check any figure against the primary source cited before relying on it. Content describing laws, regulations or contracts reflects the law as of its publication date and does not constitute legal or tax advice; applying it to a specific situation requires a qualified legal or tax professional.